
A graphical model for haloanhydrite components and P-wave velocity: A case study of haloanhydrites in Amu Darya Basin*
2016-12-02 07:25GuoTongCuiWangHongJunMuLongXinZhangXingYangMaZhiTianYuandLiHaoChen
Applied Geophysics 2016年3期
Guo Tong-Cui, Wang Hong-Jun, Mu Long-Xin, Zhang Xing-Yang, Ma Zhi, Tian Yu, and Li Hao-Chen
A graphical model for haloanhydrite components and P-wave velocity: A case study of haloanhydrites in Amu Darya Basin*
Guo Tong-Cui?1, Wang Hong-Jun1, Mu Long-Xin1, Zhang Xing-Yang1, Ma Zhi2, Tian Yu1, and Li Hao-Chen3
Wave velocities in haloanhydrites are difficult to determine and significantly depend on the mineralogy. We used petrophysical parameters to study the wave velocity in haloanhydrites in the Amur Darya Basin and constructed a template of the relation between haloanhydrite mineralogy (anhydrite, salt, mudstone, and pore water) and wave velocities. We used the relation between the P-wave moduli ratio and porosity as constraint and constructed a graphical model (petrophysical template) for the relation between wave velocity, mineral content and porosity. We tested the graphical model using rock core and well logging data.
Salt, anhydrite, graphical model, P-wave velocity, Amu Darya Basin
Introduction
About 45% of the natural gas and 11% of the oil of the global resources are associated with salt tectonics. However, accurate imaging of the subsalt structure remains the main challenge of subsalt seismic exploration because accurate velocities in haloanhydrites are difficult to obtain (Schoenherr et al., 2007). The boundary between interbedded salt deposits and anhydrites is also difficult to identify. In addition, haloanhydrite includes not only salt and anhydrite but also mudstone and pore water, and all these components affect the wave velocity.
Petrophysics enhance the reliability of seismic interpretations and reduce the exploration risks (Tapan and Gary, 2005). The fluid displacement method based on the Gassmann equation (Gassmann, 1951) is commonly used to show the changes in the lowfrequency elastic modulus owing to pore fluids. The model is applicable to clasolite with well-developed porous structure and inapplicable to tight haloanhydrites. This method has been improved by many scholars (e.g., Han and Batzle, 2005; Mavko and Mukerji, 1995; Nolen-Hoeksema, 2000; Sams and Andrea, 2001) to account for the effect of pore structure and fluids to wave velocity. In sandy mudstones and carbonates, the Biot model (Biot, 1951a, 1951b) and Xu–White model (Xu and White, 1995) are commonly used.
To analyze the effect of shale content and porosityon the elastic parameters and wave velocity of rocks, Ruiz and Dvorkin (2009) and Vialle and Vanorio (2011) experimentally investigated the effect of carbonate porosity and fluids on velocity. The petrophysical models mentioned above, as well as several empirical models, are widely used in the exploration of sandy mudstone and carbonate reservoirs.
Petrophysical models mainly investigate welldeveloped porous layers and focus on the elastic parameters and their relation to pore structure and fluid properties. However, with respect to haloanhydrites, which have low porosity and a single fluid (water), such variations are limited; in contrast, the variations in mineralogy significantly affect the wave velocities. Using the Amu Darya Basin, as an example, we introduce an original petrophysical model to the investigation of velocities in haloanhydrites. Using the relation between the P-wave modulus and porosity as constraint and the well logging response model, we examine the effect of the four main mineralogical components of haloanhydrites (anhydrite, salt, mud, and water) on rock velocities, and a model for the relation between mineralogy and velocity for different porosities is constructed. In areas without wells, the mineralogy of haloanhydrites is obtained through data inversion.
Geology of the study area
The study area is located in the right bank of Amu Darya. In this area, a well-developed layer of haloanhydrites up to 2000 m in thickness covers the target carbonates. Located in eastern Turkmenistan and southern Uzbekistan, the Amu Darya Basin is rich in gas and salt deposits. Kimmeridgian–Tithonian haloanhydrite deposits practically cover the entire basin. Haloanhydrites comprise alternating anhydrite and salt layers from bottom to top; thus, they are described as three anhydrite units and two salt units. Figure 1 showsthe seismic reflections of haloanhydrites in the study area and the geological interpretation of the seismic profile. The haloanhydrites distribution in the area is nonuniform.

Fig.1 Stratigraphy on the right bank of Amu Darya and the seismic profile of haloanhydrites.
Figure 2 shows a seismic prestack time migration profile. Subsalt seismic imaging also shows evidence for pull lift, which suggests that the velocities in the salts and anhydrites are not the same. This further suggeststhat the velocities in the haloanhydrites are related to the thickness and structure of the host rocks and their mineralogy. Based on the well logs, we explore the effect of the mineralogy of haloanhydrites on velocity.

Fig.2 Seismic profile of haloanhydrites on the right bank of Amu Darya, showing pull lift.
Velocity of haloanhydrite components
Using well logs and core data as well as whole-rock mineralogy, we show that the haloanhydrites comprise anhydrite, salt, mudstone, and water. The velocities of anhydrite and salt are obtained from well logging, cores, bulk mineralogy, and acoustic logging. P-wave velocities of pure anhydrites (> 98%) and pure salt rocks (> 98%) were statistically evaluated. The P-wave velocity of pure anhydrite rocks is 6299 m/s, which is the velocity of the mineral anhydrite. Furthermore, the P-wave velocity of pure anhydrite rocks is 4549 m/s, which represents the velocity of mineral salt.
Figure 3 shows the velocities of anhydrite, salt, andpore water. When the porosity is low, the velocity of the points with the highest anhydrite content corresponds to the velocity of the mineral anhydrite. When the porosity content of anhydrite is low, the velocity of the points with the highest content of salt corresponds to the velocity of mineral salt. The P-wave velocity of pure anhydrite rocks is 1612 m/s.

Fig.3 Velocities of anhydrite, salt, and pore water.
There are no pure mudstones in the haloanhydrites, and the wave velocity in mudstone is commonly determined by the neutron-density triangle intersection (Vercellino, 1976; Crues, 1977). However, where density logging curves of haloanhydrites are lacking, plots of the natural gamma-ray logging curve (GR) and acoustic wave logging curve (DT) that represent the sensitivity of mudstone, are used to determine the velocity of mudstone.
Figure 4 shows the GR and DT of pure anhydrites between 2836 m and 3033 m and of mudstone–anhydrites between 2030 m and 2200 m pin well B1. The point for pore water is first found on the plot before looking for the point with the highest anhydrite content.Then, the points for water and anhydrite, and mudstone are linked to form a triangle. The points corresponding to 70% mudstone are located on the 70% line that links anhydrite and mudstone points. The vertex of the triangle is the point for mudstone, and the P-wave velocity of pure anhydrite rocks is 3556 m/s.
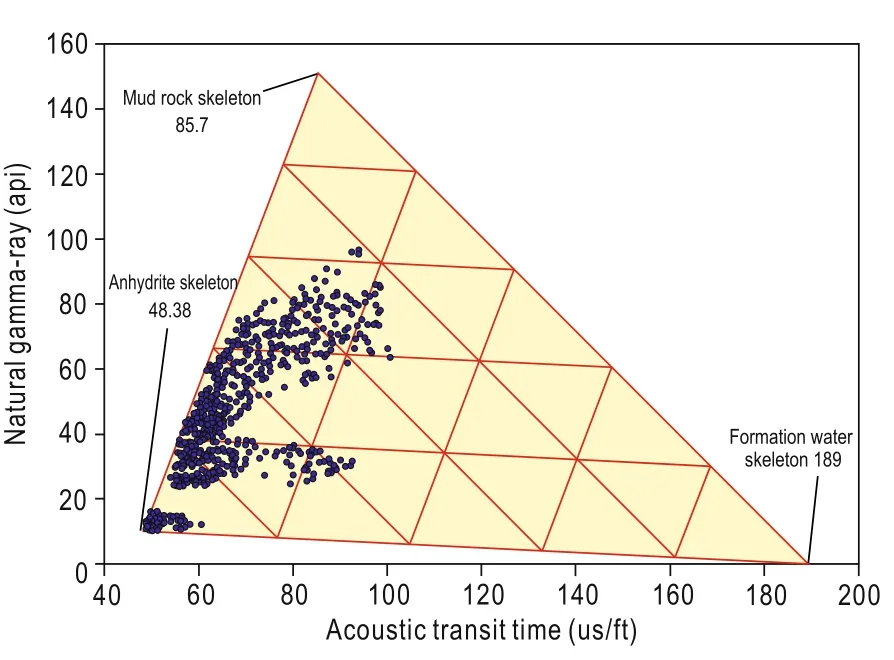
Fig.4 Calculation of the velocity in mudstone.
The horizontal coordinate represents the anhydrite content, the longitudinal coordinate represents the acoustic wave velocity of haloanhydrites, and the colored points represent the porosity.
Calculation of the haloanhydrite mineral
Based on the interpretation of multimineral well logging, a response model is constructed. Data from well logging and cores as well as powder X-ray diffraction suggest that haloanhydrites comprise anhydrite, salt, mudstone, and pore water. The response model is given below

where X is the logging response value, V1, V2, V3, and Φ represent the content of anhydrite, salt, mudstone, and pore volume, respectively, and X1, X2, X3, and Xfcorrespond to the logging response characteristics of anhydrite, salt, mudstone, and pore fluids.
Because of the lack of oil and gas in the pores of haloanhydrites, the pores of haloanhydrites are likely filled with water completely. The GR and DT data are combined with the logging response model

In equation (2), GRwand DTwcorrespond to the natural gamma rays (GR) of pure water and the acoustic transit time (DT) of the rock framework. GR1, GR2, and GR3represent the natural gamma rays of pure anhydrite, pure salt, and pure mudstone, respectively. GR is the total natural gamma rays of haloanhydrites. DT1, DT2, and DT3stand for the acoustic transit time of pure anhydrite, pure salt and pure mudstone respectively. DT is the total acoustic transit time of haloanhydrites. RT1, RT2, and RT3is the resistivity of anhydrite, salt, and mudstone, respectively, and RT is the total resistivity of haloanhydrites. The parameters for pure anhydrite, pure salt, pure mudstone, and pore water are listed in Table 1.
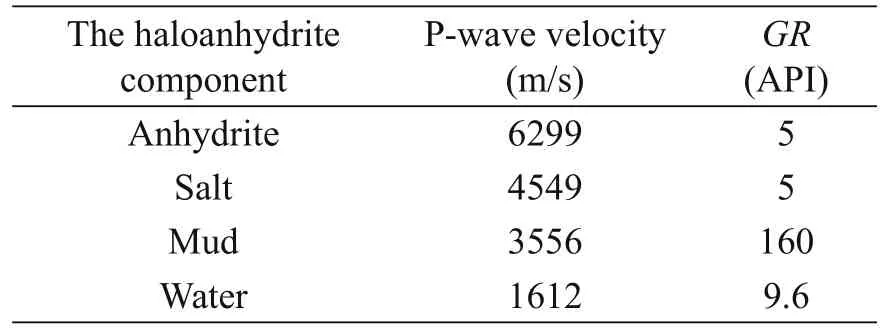
Table 1 P-wave velocity and GR parameters
Based on the dual-water model (Clavier, 1977), pore water can be divided into free and bound water, and the well logging model is

where CT refers to the uninvaded formation conductivity, which is the reciprocal of the deep resistivity in the study area. CXOis the flushed zone conductivity, which is the reciprocal of the shallow resistivity in the study area.
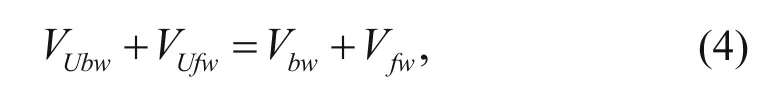
where CUbwand CUfwrepresent the conductivity of bound water and the conductivity of free water in the uninvaded zone, respectively; their values are set at 18.51 and 4.298. Cbwand Cfware the conductivity of bound water and free water in the flushed zone, respectively, and their values are set at 18.51 and 22.52. VUbwand VUfwstand for the relative volumes of bound water and free water in the uninvaded zone, and Vbwand Vfware the relative volumes of the flushed water and free water in the flushed zone.
Equations (1)–(2) are then combined to
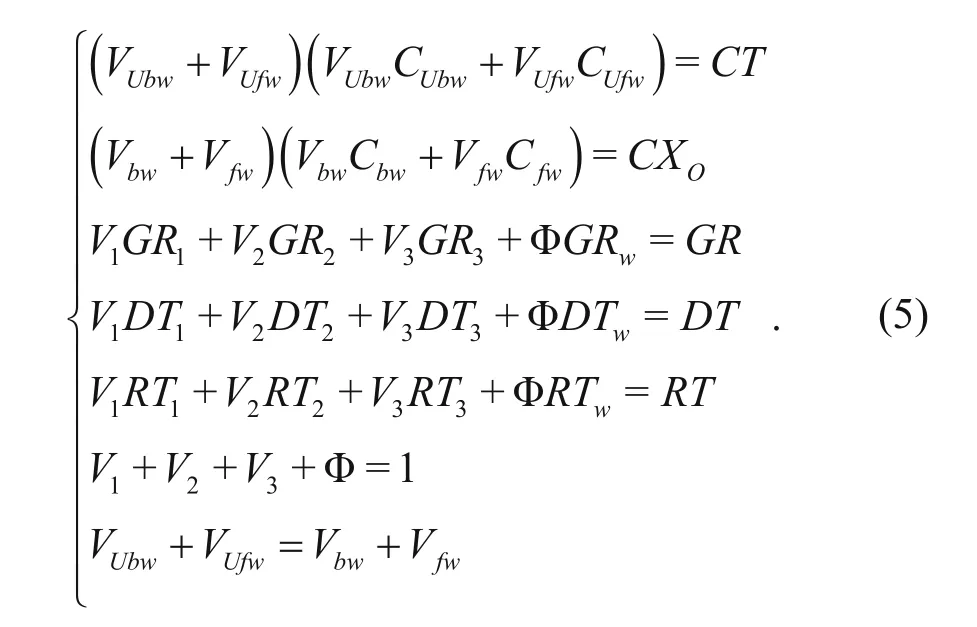
The use of equation (5) minimizes the errors. Furthermore, together with the deep and shallow resistivity curves, the values of V1, V2, V3, and Φ or the anhydrite, salt, and mudstone content and porosity of haloanhydrites in a single well can be obtained.
Figure 5 shows the petrophysical parameters and mineral content in haloanhydrite vs depth in a single well, and the mineral content and velocities of the upper salt units and middle anhydrite units in 46 wells. In the salt units, the salt ranges from 50% to 100% and is mostly higher than 85%. The mudstone content ranges from 0% to 20% and is mostly less than 10% and, finally, the porosity ranges from 0% to 10% and is mostly less than 5%. In the anhydrite units, the salt and anhydrite contents range from 0% to 100% and the mudstone from 0% to 12%. In large-scale thick haloanhydrites, the relation between mineralogy and wave velocities is complex. In fact, empirical data from one region cannot be extrapolated to another.
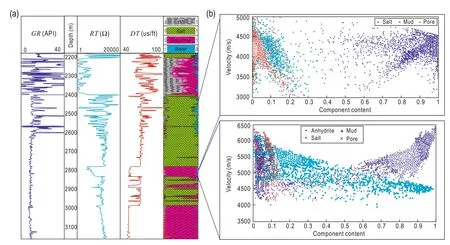
Fig.5 (a) GR, RT, and DT well log stratigraphy. (b) Salt–mudstone–pore velocities in the upper salt units (top) and middle anhydrite units (bottom) vs mineral content.
Mineralogy and velocities in haloanhydrite
The matrix of haloanhydrite consists of anhydrite, salt, mudstone, and rigid pores. The data from 46 single wells suggest that the variation in the porosity of haloanhydrites is less than 5–10% and the pores are filled with water. Using the relation between P-wave modulus and porosity as constraint and the logging response function of the various minerals, we present a model building flow for the mineralogy and velocities in haloanhydrites (see Figure 6).
The relation between P-wave velocity and elastic moduli is (Mavko et al., 2009)where Vpis the P-wave velocity, K is the bulk modulus, G is the shear modulus, M is the P-wave modulus, and ρ is the rock density.

The P-wave modulus and rock density depend on mineralogy and porosity.
1. Based on the mineralogy and porosity data from well logging, the rock density is

where V1, V2, V3, and Φ correspond to the anhydrite, salt, and mudstone content and porosity, and ρ1, ρ2, ρ3, and ρware the densities of anhydrite, salt, mudstone, and pore water, respectively. The corresponding theoretical densities of these components are 2.96 g/cm3, 2.16 g/ cm3, 2.58 g/cm3, and 1 g/cm3.
2. Based on the acoustic well logging velocity, the P-wave modulus M is

3. For a multiminerallic system, the P-wave modulus is

where the Reuss average is
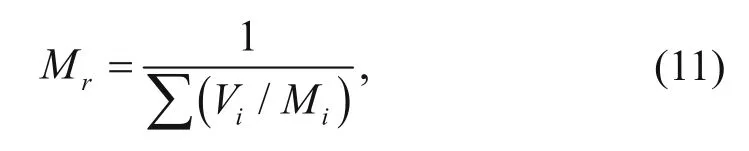
the Voigt average is

where Miis the P-wave modulus of individual mineral components, and Viis percentage of the individual mineral.
4. The relation between the M/Msand porosity φ is
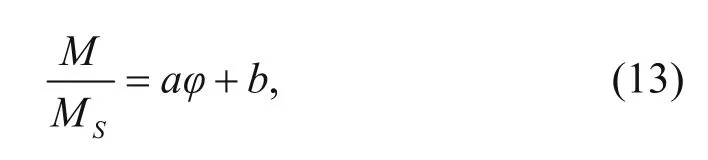
where a and b are empirical parameters.
5. From equations of (9) and (13), we obtain

and can calculate the velocity in haloanhydrites for fixed porosity.
6. The fundamentals of the graphical model that is used to reflect the relation between mineralogy and velocity in haloanhydrite is as follows: in a coordinate system where anhydrite content serves as the horizontal coordinate and rock velocity serves as the longitudinal coordinate, the porosity should be fixed and anhydrite and salt should vary. The velocity of mudstone, anhydrite, and salt are obtained at fixed porosity. Then, the porosity and anhydrite and salt are allowed to vary until agreement with the well logging data is reached.
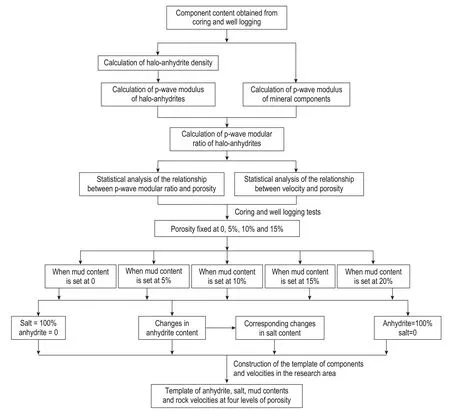
Fig.6 Flow diagram of the template for anhydrite-salt-mud-pore (formation water) and rock velocities.
This is shown in Figure 7, where the mudstone content is set at 0% and the porosity is fixed at 0%, 5%, 10%, 15%, 20%, and 25%, and the salt and anhydrite contents are 95%, 90%, 85%, 80%, and 75%. A curve is drawn to reflect the relation between mineral components and velocity in haloanhydrite. When the porosity is 0%, the salt and anhydrite contents approach 100%. When the anhydrite content is 0%, the rock velocity corresponds to the velocity of salt. In addition, when the anhydrite content is 100%, the rock velocity corresponds to the velocity of anhydrite.

Fig.7 Velocity vs anhydrite, salt, and pore water at different porosities.
Figure 8 shows the relation between anhydrite, salt, and mudstone and rock velocity at 0% porosity. When the mud content is fixed at 0, 10%, 20%, 30%, and 40%, the corresponding salt and anhydrite contents are 100%, 90%, 80%, 70%, and 60%. Subsequently, velocity curves vs mineral content for variable mudstone content can be drawn.
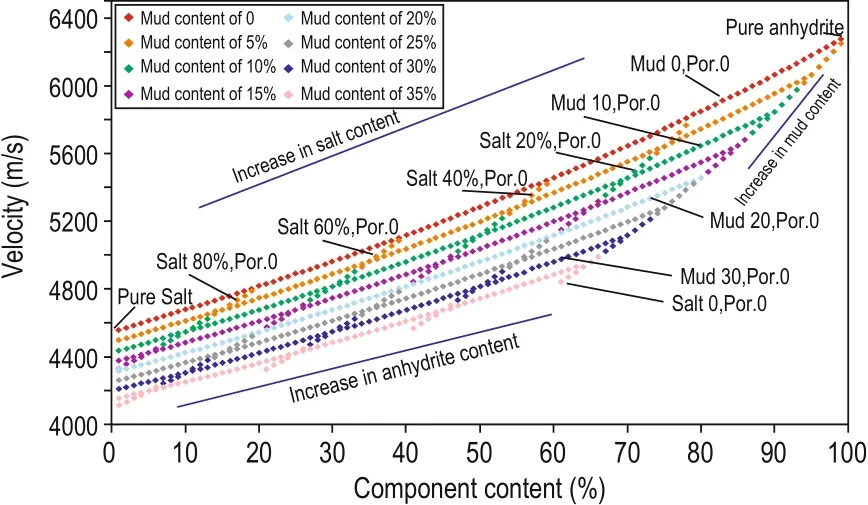
Fig.8 Velocity vs mineral content at 0% porosity.
When the porosity is fixed at 5%, 10%, and 15%, a similar method is adopted to construct the template for showing the relation among anhydrite, salt, and mudstone and velocity. This is shown in Figure 9 for 0–20% mudstone and 0–15% porosity. The porosity of haloanhydrites is generally less than 5% and that of mudstone is between 0% and 20%. In these ranges, the data in Figure 9 are applicable to most haloanhydrite layers.
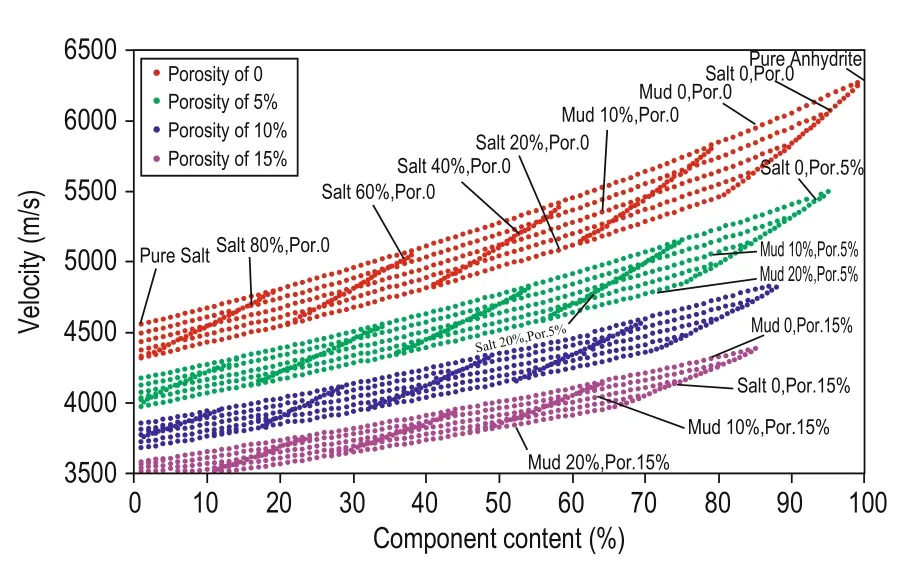
Fig.9 Velocity vs mineral content for fixed porosity and mudstone.
Comparison with cores and well logs
We used core and well logging data from five wells in the study area to test the graphical model. The results of this exercise with the parameters in Table 2 are shown in Figure 10. There is good agreement between field data and method predictions.

Table 2 Parameters of the mineral components in haloanhydrite
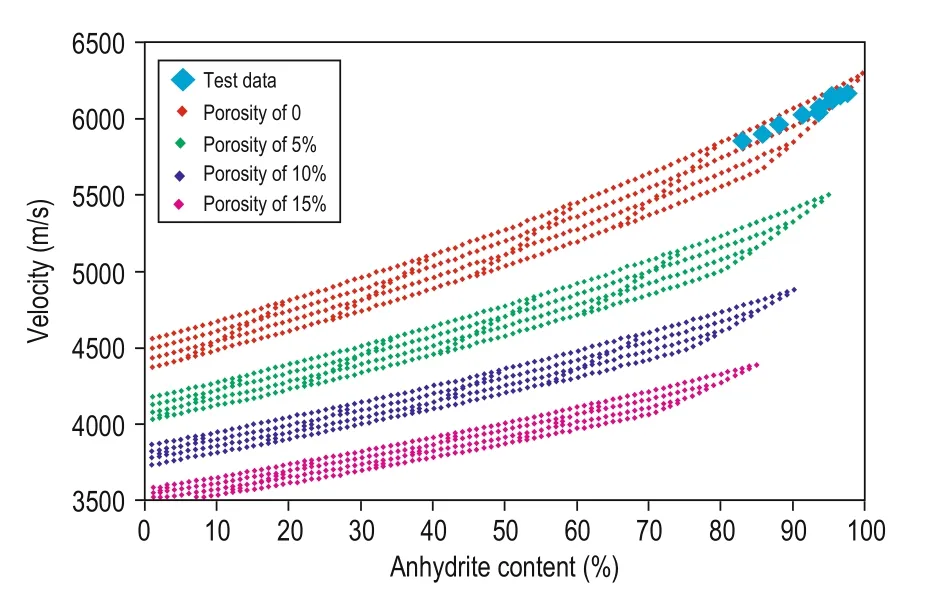
Fig.10 Core data and graphical model.
In Figure 11, we show the relation between the P-wave modulus ratio M/Msand porosity φ in the middle anhydrite unit with anhydrite content between 75% and 99%.
In addition, in this unit, the salt content is small, the mudstone content is less than 15%, and porosity ranges from 2% to 4%. The modulus ratio decreases with increasing porosity and the relation between the P-wave modulus ratio and porosity is

From equation (14), equation (16) is obtained

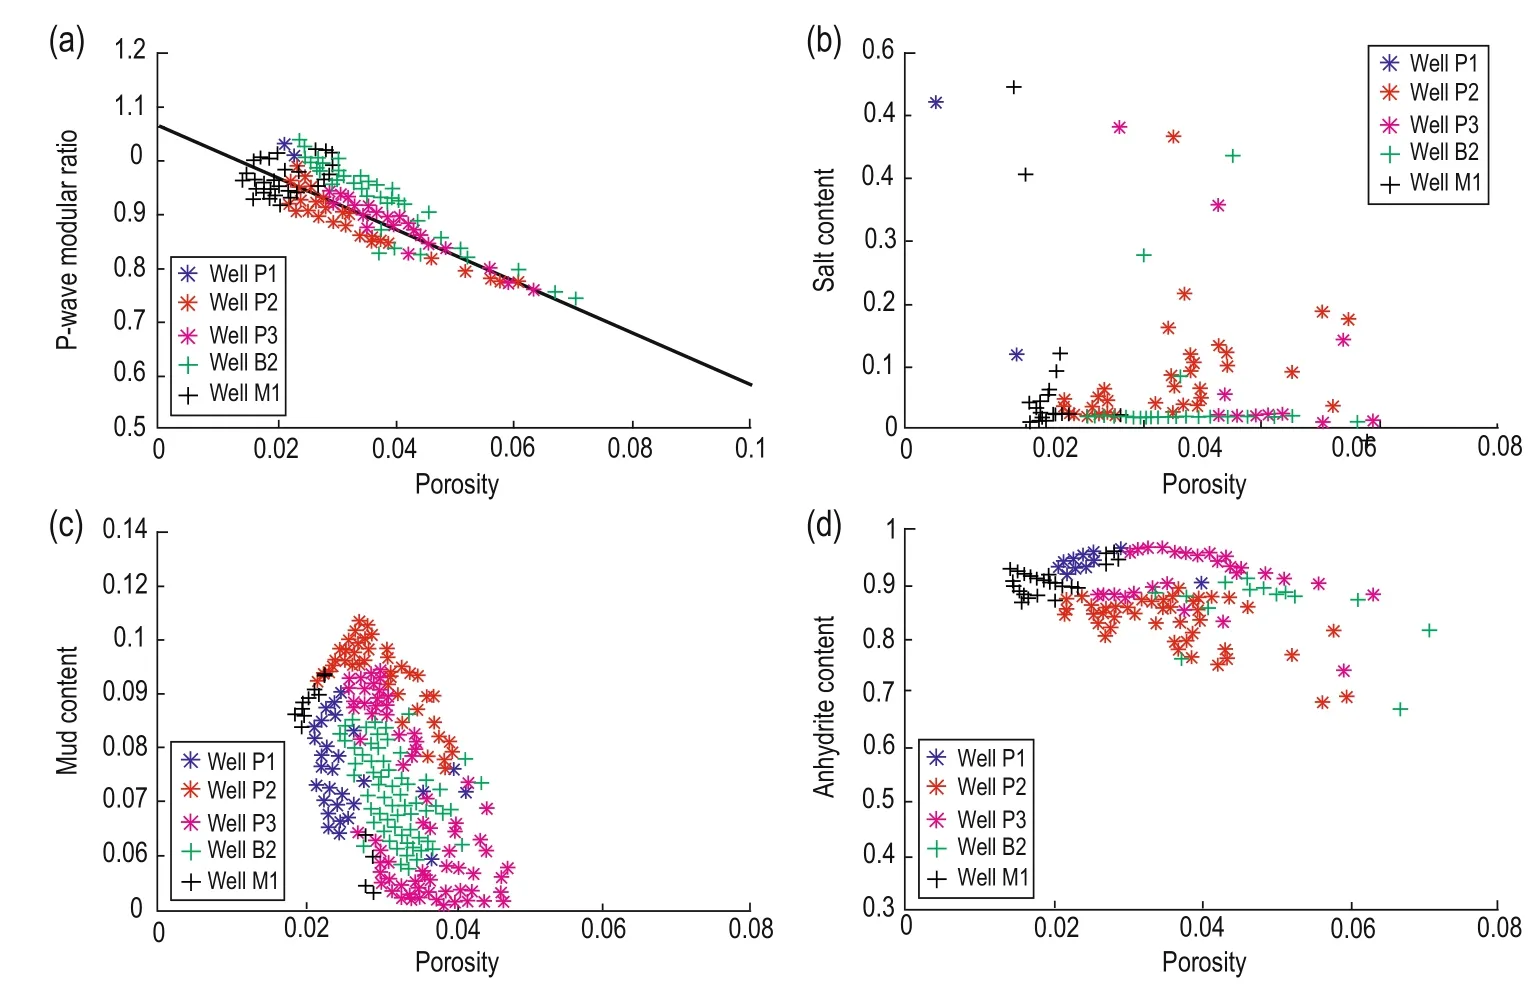
Fig.11 P-wave moduli ratio vs porosity in the middle anhydrite unit.
To show the relation between P-wave velocity and anhydrite content in the middle anhydrite unit, we construct Figure 12 for fixed porosities of 1% and 5%. In Figure 12a the points with 1% porosity from the well logs lie on the 0% porosity grid. The points on the grid line with a porosity fixed at 5% are calculated with well logs. The red and green triangulation points are for 0% mudstone, whereas the two other sets of triangulation points, blue and yellow, represent mudstone content of 5%. The mudstone trend line agrees with the mudstone isoline in the graphical model within error.
In Figure 12b, the points on the 0% and 5% porosity grid lines correspond to points with 1% and 5% porosity from well logs. Points on the same trend line have the same salt content. This figure highlights five trendlines, on which the points have the same salt content. From left to right, the salt contents are 0%, 10%, 20%, 30%, and 40%. Points that have the same color have the same mudstone content.

Fig.12 Velocity vs anhydrite content in the middle anhydrite unit for different mudstone and porosity content.
The two sets of trend lines suggest that the P-wave velocity increases with increasing anhydrite content. For increasing porosity and decreasing P-wave velocity, the P-wave velocity and anhydrite content curves point downward. Such a conclusion is consistent with Figure 9.
Application of the template to haloanhydrite
The proposed template of velocity vs mineral components in haloanhydrite can be used to rapidly obtain mineralogy and velocity data. When mineral and velocity data are taken from well loggings, the well logging and seismic data can be used to obtain the mineral content of haloanhydrite. Polygonal areas are defined for different components to map the mineral content in three dimensions and thus improve the velocity model for haloanhydrites. A point with a specified anhydrite content in a pseudo well should be selected and use the template to determine the porosity, salt content, and mudstone content of this datum. From field data, we know that the porosity is low. Thus, only variations in anhydrite, salt, and mudstone content are considered.
The porosity of haloanhydrites on the right bank of Amu Darya is generally less than 5%. Then, we can use the template and inverted mineralogical data to calculate the velocities. Using this approach, we identify sevengroups in Figure 13.

Fig.13 Data for anhydrite, salt, mudstone, and pore water from a pseudo well.
1. For high anhydrite content, the velocities for pure anhydrite can be used.
2. High salt content; the velocities of pure salt can be used.
3. Mixture of salt and anhydrite, with ignored porosity; the relation between salt and anhydrite and velocity is linear.
4. Mixture of salt and mudstone, and porosity close to 5%.
5. Mixture of salt and anhydrite, and porosity close to 5%.
6. Mixture of anhydrite and mudstone, and porosity close to 5%.
7. Mixture of salt and anhydrite, and porosity close to 10%.
The risk of classifying interbedded halite and anhydrite strata is reduced, and the important components are defined.
Conclusions
We investigate the effect of the main mineral components in haloanhydrites (anhydrite, salt, mudstone, and pore water) on the P-wave velocities at fixed porosities. We constructed a graphical model to describe the relations among the mineral components and that between mineralogy and P-wave velocity using the relation of porosity and the P-wave moduli ratio as constraint.
Using field and well logging interpretation data, we tested the graphical model and concluded that it can be used to semiquantitatively classify the P-wave velocity and mineralogy variations in haloanhydrites. Furthermore, the model can help improve the velocity predictions for interbedded salt and anhydrite layers in haloanhydrite.
Acknowledgements
The authors express their sincere thanks to Professors Pei Zhenglin, Zhao Jianguo, and Zou Changchun and Dr. Wang Kewen, whose critical and constructive comments and suggestions greatly improved the final paper.
Biot, M. A., 1951a, Theory of propagation of elastic waves in a fluid saturated porous solid. I. Low frequency range: Acoust. Soc. Am., 28, 168-178.
Biot, M. A., 1951b, Theory of propagation of elastic waves in a fluid saturated porous solid. II. Higher frequency range: Acoust. Soc. Am., 28, 179-191.
Clavier, C., 1977, The theoretical and experimental bases for the “Dual water” model for the interpretation of shaly sands: SPE6859, 1-6.
Crues, J. R., 1977, Lithology crossplots: Applications in an evaporate Basin- the Maverick basin of south west Texs: SPWLA eighteenth Annual Logging Symposium, 1-20.
Gassman, F., 1951, Elastic waves through a packing of spheres: Geophysics, 16(4), 673-685.
Han, D., and Batzle, M. L., 2004, Gassmann’s equation and fluid-saturation effects on seismic velocities: Geophysics, 69(1), 398-405.
Mavko, G., and Mukerji, T., 1995, Pore space compressibility and Gassmann’s relation: Geophysics, 60(6), 1743-1749.
Mavko, G., Mukerji, T., and Dvorkin, J., 2009, The rock physics handbook: Tools for seismic analysis in porous media: Cambridge University Press, New York, 70-130.
Nolen-Hoeksema, R. C., 2000, Modulus porosity relations, Gassmann’s equation, and the low frequency elastic wave response to fluids: Geophysics, 65(5), 1355-1363.
Ruiz, F., and Dvorkin, J., 2009, Sediment with porous grains: rock-physics model and application to marine carbonate and opal: Geophysics, 74(1), 1-15.
Sams, M. S., and Andrea, M., 2001, The effect of clay distribution on the elastic properties of sandstones: Geophysical Prospecting, 49(3), 128-150.
Schoenherr, J.,Yrai, J. L., and Kukla, P. A., 2007, Limits to the sealing capacity of rock salt: A case study of the Infra-cambrian Ara salt from the South Oman Salt Basin: AAPG Bulletin, 91(11), 1541-1557.
Tapan, M., and Gary, M., 2005, Quantitative Seismic Interpretation: Cambridge University Press, Per Avseth, 72-80.
Vercellino, W. C., 1976, Computer crossplots for well evaluation of complex lithologies: Dresser Atlass Tech. Memor., 7(2), 1-30.
Vialle, S., and Vanorio, T., 2011, Laboratory measurements of elastic properties of carbonate rocks during injection of reactive CO2-saturated water: Geophysical Research Letters, 38(1), L01302, 1-5.
Xu, S. Y., and White, R. E., 1995, A new velocity model for clay-sand mixture: Geophysics Prospecting, 43, 91-118.

Guo Tong-Cui received B.Sc. from Northwest University in 1990 and her Ph.D. in Petroleum Geology from the Research Institute of Petroleum Exploration & Development in 2005. She is a senior engineer at the Research Institute of Petroleum Exploration & Development, working on seismic data interpretation, reservoir prediction, and geology. Email: guotc@petrochina.com.cn
Manuscript received by the Editor July 2, 2016; revised manuscript received September 15, 2016.
*This research is supported by the National Major Scientific and Technological Special Project (No. 2011ZX05029-003) and the project of the Research Institute of Petroleum Exploration & Development (No. 2012Y-058).
1. Research Institute of Petroleum Exploration and development, Beijing 100083, China.
2. PetroChina International Corporation, Beijing 100034, China.
3. China Huayou (Group) Corporation, Beijing 100724, China.
?Corresponding Author: Guo Tong-Cui (Email: guotc@petrochina.com.cn)
? 2016 The Editorial Department of APPLIED GEOPHYSICS. All rights reserved.

- Applied Geophysics的其它文章
- Spherical cap harmonic analysis of regional magnetic anomalies based on CHAMP satellite data*
- Coherence estimation algorithm using Kendall’s concordance measurement on seismic data*
- Three-dimensional numerical modeling of fullspace transient electromagnetic responses of water in goaf*
- 3D finite-difference modeling algorithm and anomaly features of ZTEM*
- 3D modeling of geological anomalies based on segmentation of multiattribute fusion*
- Anomalous astronomical time-latitude residuals: a potential earthquake precursor*