
Robust salt-dome detection using the ranking of texture-based attributes*
2016-12-02 07:25MohamedDeriche
Applied Geophysics 2016年3期
Mohamed Deriche
Robust salt-dome detection using the ranking of texture-based attributes*
Mohamed Deriche?1
The accurate interpretation and analysis of seismic data heavily depends on the robustness of the algorithms used. We focus on the robust detection of salt domes from seismic surveys. We discuss a novel feature-ranking classification model for saltdome detection for seismic images using an optimal set of texture attributes. The proposed algorithm overcomes the limitations of existing texture attribute-based techniques, which heavily depend on the relevance of the attributes to the geological nature of salt domes and the number of attributes used for accurate detection. The algorithm combines the attributes from the Gray-Level Co-occurrence Matrix (GLCM), the Gabor filters, and the eigenstructure of the covariance matrix with feature ranking using the information content. The top-ranked attributes are combined to form the optimal feature set, which ensures that the algorithm works well even in the absence of strong reflectors along the salt-dome boundaries. Contrary to existing salt-dome detection techniques, the proposed algorithm is robust and computationally efficient, and works with small-sized feature sets. I used the Netherlands F3 block to evaluate the performance of the proposed algorithm. The experimental results suggest that the proposed workflow based on information theory can detect salt domes with accuracy superior to existing salt-dome detection techniques.
Seismic interpretation, salt-dome detection, texture attributes, GLCM
Introduction
Traditionally, seismic interpretation has largely been carried out by human experts with extended training and experience. Moreover, manual or subjective methods are slow, require a large amount of manpower, and can be affected by human errors and fatigue, among other factors. With the growing amount of data to be analyzed, and in order to reduce processing time and bias, we have witnessed, in recent years, an increasing interest in developing computer-based systems that could be used in the analysis of such data automatically without human intervention. The major goal from such an analysis is the extraction of important geological features, which are then used in detecting different seismic events including faults, salt domes, horizons, etc. However, it is worth noting that the success of such automated event detection systems rely heavily on the robustness of the different attributes extracted from the data, and the use of such attributes in the classification and detection stages, and subsequently in decision making.
Seismic attributes are critical tothe interpretation process. A good seismic attribute is directly sensitive to the geologic feature or reservoir property of interest. Seismic attributes have long been used in explorationeven beforethere weredigital recordings. The first seismic attribute used in oil exploration was the NR (zones of no reflection) attribute (Chopra and Marfurt, 2005), which was used to detect faults in analog recordings of seismic data. Currently, geologists areable to compute important seismic attributes, such as structural elevation, reflectors dip, and discontinuities. Reflectors dip and structural elevation are used in estimating hydrocarbon traps, whereas the discontinuity attribute is used to highlight faults (Chopra and Marfurt, 2005).
Digital recording of seismic data was introduced in the 1960s. It was noted that reflections from hydrocarbonbearing rocks show large amplitudes compared to their surroundings. The large amplitudes were named“bright spots”and were extensively used to detect gas reservoirs (Forrest, 2000). Seismic attributes, such as amplitude, flat spots, and frequency loss, were used to identify the “bright spots” in seismic data. In the 1970s, three additional attributes, instantaneous amplitude, instantaneous phase, and instantaneous frequency, derived from trace analysis, were introduced to seismic interpretation. Instantaneous amplitude and frequency were used to estimate the presence of hydrocarbons, whereas instantaneous phase was used to label faults in seismic data. Later on, several new attributes, such as dominant frequency, average amplitude, and zerocrossing frequency, were used to improve the accuracy of hydrocarbon estimation and fault detection.
Trace attributes suffer from waveform interferences and are strongly affected by reflections from neighboring surfaces. To overcome these limitations, curvature maps from 3D seismic data and texture attributes from 2D and 3D seismic data were proposed (Lisle, 1994). The curvature attribute is used to estimate the regional dip and small-scale features that are associated with open fractures and fault depth. The idea of applying texture-based attributes to seismic applications became more popular over the last decade or so. In particular, attributes derived from the gray-level co-occurrence matrix (GLCM) were used to detect salt domes, faults, etc. Some of the common GLCM attributes are energy, contrast, entropy, and homogeneity.
One of the key tasks in seismic data interpretation is the detection of salt bodies because oil and gas are associated with salt domes owing to the excellent sealing that they provide. Salt-dome detection is a difficult and time-consuming task, especially in the case of 3D seismic data (Berthelot et al., 2013). Most of the automated and semi-automated salt-dome detection algorithms in the literature use either edge-detection methods (Zhou et al., 2007; Aqrawi et al., 2011; Amin and Deriche, 2015a), normalized cuts and image segmentation (Lomask et al., 2004; Lomask et al. 2006), active contours (Zhang and Halpert, 2012; Hauk?s et al., 2013) or methods based on texture attributes (Berthelot et al., 2012; Berthelot et al., 2013; Shafiq et al., 2015), and hybrid edge-detection and texture-based methods (Amin and Deriche, 2015b) or patch-based classification methods (Amin et al., 2015; Amin and Deriche, 2016).
Numerous attributes have been proposed but very limited efforts have been extended in identifying and ultimately ranking such attributes with respect to the task of interest; that is, accurate salt-dome detection or the detection of other important events in seismic data. In this study, we solve the problem by proposing a new robust framework for salt-dome detection based on an optimal set of attributes using information theory concepts. We start by computing the GLCM attributes, the Gabor filter-based attributes, and the eigenstructurebased attributes. Then, I select an optimal set of features using three popular feature-selection approaches; namely, the minimum redundancy maximum relevance (mRMR), the mutual information feature selection (MIFS), and the joint mutual information (JMI) algorithms. We rank the attributes according to their importance in terms of information content and salt-dome relevance and select the most important ones for detecting salt domes.
The proposed salt-dome detection algorithm
Seismic attributes can reveal the textural differences between salt areas and the surrounding geology more robustly when compared to edge-based attributes (Amin and Deriche, 2015b). A salt structure can be defined as an area of incoherent texture compared to its surroundings. The proposed algorithm selects the most important texture attributes, using a feature selection criterion, from the features extracted from the co-occurrence matrix together with those from the Gabor filter and eigenstructure attributes. The different attributes in this study represent the diversity in the feature characteristics in the space and transform domains. The final selected feature set is then used to train a classifier. The classifier estimates the probability of each pixel in the seismic image. The probabilities are used to divide the target salt boundary. Figure 1 shows the overall structure of the proposed system. The detection accuracy is directly linked to the selected texture attributes. The different attributes used in this study are listed in Table 1 and discussed below.

Fig.1 Steps of the proposed methodology.

Table 1 Texture-based seismic attributes
Gray-level co-occurrence matrix (GLCM) attributes
The GLCM is used in image processing to describe the spatial dependencies of gray levels. The GLCM approximates the joint probability distribution of two gray levels. The high values away from the diagonal in the GLCM show the sharp gray level changes, whereas the high values close to the diagonal show the small variations in the gray levels. The GLCM-based attributes discussed by Haralick et al. (1973) were first applied by Gao (2003) to detect salt-dome boundaries. These attributes can detect the changes in texture among a pairs of pixels along a chosen direction and a given neighborhood (Berthelot et al., 2013).where qd, θ(i, j) is the number of occurrences of gray levels separated by distance d in direction θ. From the GLCM, the following attributes can be obtained.
GLCM contrast
The GLCM contrast measures the gray-level variations of neighboring pairs in an image using the following equation (Haralick et al., 1973):
where P(i, j) is the joint probability distribution given by the co-occurrence matrix. If the neighboring pixels have very similar gray-level values, then the image contrast is very low. Salt regions and horizons have smooth textures; therefore, the contrastis low in these areas. The GLCM contrast is high for salt boundaries that are rich in texture.
GLCM entropy
The GLCM entropy measures the spatial disorder in textures. The GLCM entropy is (Haralick et al., 1973):

The value of this attribute is high for dipping reflectors and low for salt areas.
GLCM dissimilarity
The GLCM dissimilarity is similar to the GLCM contrast but different in power, and it measures the amplitude variations of neighboring pairs in an image (Haralick et al., 1973):

The GLCM dissimilarity is low when the neighboring pairs have similar gray levels. This attribute has high values along salt boundaries, where large amplitude variations are also observed.
D. GLCM energy
The GLCM energy attribute is (Haralick et al., 1973):

This attribute is high for strong reflectors along salt-dome boundaries.
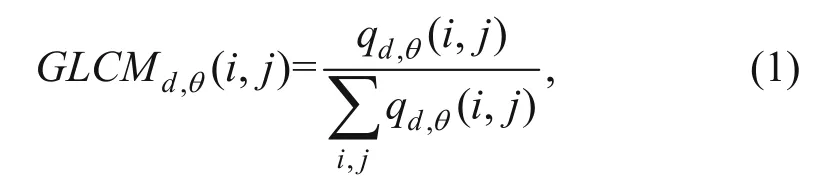
Figure 2 shows the GLCM contrast, entropy, dissimilarity, and energy attributes computed for Inline image 411 (see Figure 5a,, image taken from the F3 dataset in the experimental results section). The GLCM-based attributes can differentiate between textures related to salt-dome boundaries and non-related textures. We observe here that the GLCM entropy and energy maps highlight the strong amplitudes whereas the GLCM contrast and dissimilarity maps give high values for variations across the salt boundaries. The GLCM dissimilarity is similar to GLCM contrast attribute with a difference in power; contrast, unlike dissimilarity, grows quadratically and measures local gray level variations. The dissimilarity attribute measures the amplitude variations of neighboring pairs in an image taking a maximum value of 1 (Berthelot et al., 2013).

Fig.2 GLCM attributes for Inline411: (a) contrast, (b) entropy, (c) dissimilarity, (d) energy.
Gabor filter-based attributes
The periodicity and orientation of seismic textures can be described using attributes derived from the Fourier spectrum. Frequency-based texture attributes are used to extract the impact of reflectors. Gabor filters, as discussed in Randen and S?nneland (2005), can be used in seismic image processing to extract frequency-based attributes. These attributes are computed by summing the energy covered by Gabor filters normalized by the total energy. Different choices of parameters can discriminate between seismic textures with different frequency content. Gabor filters are designed to find the dominant size and orientation of different textures in an image. The Gabor filter attributes were selected in this study to complement the GLCM texture-oriented attributes because such linear filters were proven efficient in many edge-detection problems.
Gabor filters with orientation θ and a given radial filter center FR are given by (Jain and Farrokhnia, 2001):where u′ = u cosθ + vsinθ, v′ = -usinθ + vcosθ, and σuand σvspecify the filter bandwidth. In Figure 3, the Gabor filter masks correspond to θ = 0, π/4, π/2, and 3π/4. In Figure 4, Gabor-filtered image maps representing Inline411 are shown. The blue color, here, corresponds to the minimum value and the red color correspond to the maximum value.


Fig.3 Gabor filter masks (d = 1): (a) θ = 0, (b) θ = π/4, (c) θ = π/2, and (d) θ = 3π/4.
Fig.4 Gabor filter attributes for Inline411: (a) θ = 0, (b) θ = π/4, (c) θ = π/2, and (d) θ = 3π/4.
Eigenstructure attributes
The self-similarity properties of seismic waveforms have traditionally been modeled using the concept of correlation. In particular, the covariance matrix has been efficiently used in estimating the coherence and trace attributes (Randen and S?nneland, 2005). Such attributes are crucial in detecting salt-dome boundaries. The covariance, or eigenstructure attributes, is computed using the covariance matrix from the gradients in the x-, y-, and z-directions

where N is the window size (N = 9 for 3 × 3 windows), Gaand Gbare the gradients in directions a and b, and μaand μbis the mean in the a-and b-direction, respectively. From the covariance matrix, the most important attributes (Berthelot et al., 2012) are the following.
Trace Attribute
The covariance matrix is first estimated from the data and then decomposed into a set of ordered eigenvalues and corresponding eigenvectors. The eigenvalues of the covariancematrix are used to obtain the trace attribute (Berthelot et al., 2012):

where λis are the eigenvalues of the covariance matrix. Strong reflections from the salt domes create strong amplitudes across the boundaries, whereas the profile of the salt domes is relatively smooth. Therefore, this attribute is high along boundaries and low in nonboundary regions.
Coherency estimate
The coherency estimate (Berthelot et al., 2012) is given as:

where λ1is the highest eigenvalue and λ1…. λpare the eigenvalues obtained from the eigenvector decomposition of the covariance matrix, is based on the eigenstructure of the covariance matrix. The coherence attribute represents the contrast information present in seismic slices. The attribute exhibits high values in smooth areas and low values across salt-dome boundaries with typically high-amplitude variations.
The largest eigenvalue attribute
The largest singular value attribute is itself used as attribute (Berthelot et al., 2012):

Salt-dome boundaries are often represented by strong edges in seismic data. The largest eigenvalue attribute corresponds to the edge strength in a chosen volume. The value of this attribute is high for salt-dome boundaries for strong edges and weak for the surrounding areas, Figure 5 shows the feature maps obtained using the eigenstructure attributes for Inline411. We observe here that the trace and the largest eigenvalue attributes give high values for strong edges across the salt boundaries whereas the coherency attribute gives low values for smooth areas and high values for strong contrast variations.

Fig.5 (a) Inline411; eigenstructure attributes: (b) trace, (c) coherency estimate, (d) largest eigenvalue.
Attribute ranking based on the information content
The initial survey of the different attributes used in seismic interpretation revealed a long list of correlations. Unfortunately, the dimensionality principle dictates that it is important to balance the minimum number of relevant attributes while preserving the important interpretation characteristics of selected features. Thus, in this study, the various attributes are tested and show the existence of a minimum set of attributes that are optimum in relation to the accurate detection of salt domes. To obtain this optimum set of attributes, I rank the different attributes based on their information content and the task at hand.
For the experiments, I selected three commonly used techniques for feature ranking; namely, the mutual information feature selection (MIFS) algorithm, the minimum redundancy maximum relevance (mRMR) algorithm, and the joint mutual information (JMI) algorithm. The MIFS algorithm, proposed by Battiti (1994), iteratively creates the optimal feature set by selecting the feature with the highest Jmifsscore at every iteration

where S is the set that includes the currently selected features, Y is the class label, and Xkis the kth feature. I(X, Y) is the mutual information between variables X and Y

where p(xy) is the joint probability mass function, and p(x) and p(y) are the marginal probabilities.
The I(Xk;Y) term in Jmifsmaximizes the feature relevance. The second term is introduced to ensure the low correlation with features already selected in S. Iteratively, the features are ranked from best to worst. By selecting different values of β, different feature selection criteria are obtained. Choosing β = 0 results in the independent selection of features; the criterion is also known as mutual information maximization (MIM). As discussed by Battiti (1994), in most feature selection applications, the optimal value of β is 1. In this study, Ihave also used β = 1.
The mRMR algorithm, proposed by Peng et al. (2005), is similar to the MIFS algorithm. The β coefficient in the mRMR is equal to the inverse of the size of the current feature selection set. As S increases, the value of β approaches zero, which means that the selection of features will be carried independently, as in case of the MIM. The selection criteria for mRMR are
The JMI algorithm (Yang and Moody, 1999; Meyer et al., 2008) uses the concept of mutual information. In particular, the selection criterion for the JMI is
After some manipulation (see Brown et al., 2012), the above relation can be rewritten as

Similar to the mRMR, the JMI also selects the features independently as the size of feature set S increases.
Experimental results
I have used the publicly available Netherlands offshore F3 block (North Sea) to analyze the performance of the proposed salt-dome detection algorithm. The block covers an area of 24 × 16 km2.The algorithm starts by extracting the salt- and nonsalt-dome boundary points from the labeled data. The labels were obtained in collaboration with Dr. A. Al Suhail, who worked extensively with Earth data.
From the training data, I compute the GLCM, the Gabor, and the eigenstructure-based features. The training features are then ranked using the MIFS, the mRMR, and the JMI algorithms. The top K-ranked features were used to train a supervised Bayesian classifier. For a given Inline and at each point, the algorithm computes the top K-ranked GLCM, the Gabor, and the eigenstructure attributes. Each point is then classified as either a salt-dome boundary or a nonsalt-dome boundary. The final salt-dome boundaries are obtained by joining all the classified points and removing the noisy and unwanted regions using basic morphological operations.
In Table 2, I list the ranking of the features according to the three criteria. Figure 6a shows the histogram of the top ranked feature (obtained from 400 data points). The distributions of the salt-dome and nonsalt-dome boundary samples are separate and the overlapping is very small. The receiver operating characteristic (ROC) curve confirmed the results (>0.97 AUC). Figure 6b shows the histogram of the salt-dome and non-salt-dome boundary samples for the lowest ranked feature. The two distributions overlap completely and therefore the classification accuracy using this feature is expected to be very low.

Table 2 Feature ranking using the mRMR, MIFS, and JMI selection criteria
The experiments suggested that the salt-dome boundary classification using the six top-ranked features is the most accurate. Adding more attributes in the classification did not improve the overall accuracy; this validates the concept of the “curse of dimensionality”. In Table 3, the six top-ranked features using the mRMR, MIFS, and JMI feature selection criteria are listed. The top six features using mRMR and MIFS are the same.This is expected, as all three algorithms are based on the information content of the features with respect to the class labels. Figure 7 shows the salt-dome boundaries detected for Inline 364 and Inline411 using the top six attributes ranked by using the JMI criteria.

Fig.6 (a) Histogram of the highest ranked feature. (b) Histogram of the lowest ranked feature.

Table 3 Top six features selected using the mRMR, MIFS, and JMI criteria

Fig.7 (a)Salt-dome boundary for Inline411; (b) Outline of the boundary in (a); (c) Salt-dome boundary for Inline364; and (d) Outline of boundary in (c).
Figure 8 shows the classification accuracy of the saltdome boundary for Inlines411 to 421 detected using the proposed method (ranking was based on mRMR/MIFS and JMI) and the texture attributes based on the method without ranking. In Table 5, the average classification accuracies of the proposed method (ranking was based on mRMR/MIFS and JMI), the texture attributes-based method without ranking (Berthelot et al., 2013), the 3D edge-detection method (Aqrawi et al., 2011), and the multidirectional 3D edge-detection method (Amin and Deriche, 2015a) are listed. The texture attributesbased method using the JMI selection criteria has average accuracy of 91.4%, which is 7% higher than the 3D Sobel-based method, 5% higher than the textureattributes-based method without ranking, 2% higher than the multidirectional edge-based method, and 0.5% better than the texture attributes-based method using mRMR or MIFS. Note that the proposed method with ranking is approximately 40% more computationally efficient than the texture-based method without ranking (see Table 4). It is important to mention that the training and feature ranking procedure is only carried once. The listed execution times provide an idea of the order of differences between the techniques when implemented on a generic i7 desktop machine.

Fig.8 Classification accuracy of the salt-dome boundaries for Inlines411 to 421.

Table 4 Average execution time (Inlines411 to 421)

Table 5 Average classification accuracy (Inlines411 to 421)
Conclusions
In this study, I introduced a new feature-ranking classification model for accurate salt-dome detection in 3D seismic volumes. The proposed algorithm uses an optimal feature set created from the ranking of the attributes computed using the co-occurrence matrix, Gabor filters, and the eigenstructure of the covariance matrix. The concept of information content with respect to the class labels (salt- and non-salt-related) has been used to rank the features. Experiments using the F3 dataset showed that the proposed salt-dome detection algorithm based on the feature ranking is robust, computationally efficient, and can detect the salt-dome boundaries with accuracy outperforming existing edgebased and texture-based salt-dome detection methods.
Acknowledgments
The work presented in this paper has been supported by the Center for Energy and Geo-Processing (CeGP) at King Fahd University of Petroleum & Minerals (KFUPM), under Project no. GTEC 1401–1402. The author would like also to thank Asjad Amin for his help with the software implementation and testing of the algorithms.
Amin, A., and Deriche, M., 2015a, A new approach for salt dome detection using a 3d multidirectional edge detector: Applied Geophysics, 12(3), 334–342.
Amin, A., and Deriche, M., 2015b, A hybrid approach for salt dome detection in 2d and 3d seismic data: IEEE International Conference on Image Processing (ICIP), 2537–2541.
Amin, A., Deriche, M., Hegazy, T., Wang, Z., and AlRegib, G., 2015, A novel approach for salt dome detection using a dictionary-based classifier: 85th SEG Annual International Meeting, Expanded Abstracts, 1816–1820.
Amin, A., and Deriche, M., 2016, Salt dome detection using a codebook-based learning model: IEEE Geoscience and Remote Sensing Letters, PP(99), 1–5.
Aqrawi, A. A., Boe, T. H., and Barros, S., 2011, Detecting salt domes using a dip guided 3d sobel seismic attribute: 81th SEG Annual International Meeting, Expanded Abstracts 2011, 1014-1018.
Battiti, R., 1994, Using mutual information for selecting features in supervised neural net learning: IEEE Transactions on Neural Networks, 5(4), 537–550.
Berthelot, A., Solberg, A. H. S., and Gelius, L. J., 2013,Texture attributes for detection of salt: Journal of Applied Geophysics, 88, 52–69.
Berthelot, A., Solberg, A. H. S., Morisbak, E., and Gelius, L. J., 2012, 3d segmentation of salt using texture attributes: 82th SEG Annual International Meeting, Expanded Abstracts, 1–5.
Brown, G., Pocock, A., Zhao, M. J., and Luján, M., 2012, Conditional likelihood maximisation: a unifying framework for information theoretic feature selection: J. Mach. Learn. Res., 13, 27-66.
Chopra, S., and Marfurt, K. J., 2005, Seismic attributes—A historical perspective: Geophysics, 70(5), 3SO-28SO.
Forrest, M., 2000, “Bright” investments paid off: AAPG Explorer., 18-21.
Gao, D., 2003, Volume texture extraction for 3D seismic visualization and interpretation: Geophysics, 68, 1294–1302.
Haralick, R. M., Shanmugam, K. S., and Dinstein, I., 1973, Textural features for image classification: IEEE Transactions on Systems, Man, and Cybernetics, 3, 610–621.
Hauk?s, J., Ravndal, O. R., Fotland, B. H., Bounaim, A., and Sonneland, L., 2013, Automated salt body extraction from seismic data using the level set method: First Break, 31, 35–42.
Lisle, R. J., 1994, Detection of zones of abnormal strains in structures using Gaussian curvature analysis: AAPG bulletin, 78(12), 1811-1819.
Lomask, J., Biondi, B., and Shragge, J., 2004, Image segmentation for tracking salt boundaries: 74th SEG Annual International Meeting, Expanded Abstracts, 2443 -2446.
Lomask, J., Clapp, R. G., and Biondi, B., 2006, Parallel implementation of image segmentation for tracking 3d salt boundaries: 68th EAGE Annual International Meeting, Expanded Abstracts, 1–5.
Meyer, P. E., Schretter, C., and Bontempi, G., 2008, Information-theoretic feature selection in microarray data using variable complementarity: IEEE Journal of Selected Topics in Signal Processing, 2(3), 261–274.
Peng, H., Long, F., and Ding, C., 2005, Feature selection based on mutual information: Criteria of max dependency, max-relevance, and min-redundancy: IEEE Transactions on Pattern Analysis and Machine Intelligence, 27(8), 1226–1238.
Randen, T., and S?nneland, L., 2005, Atlas of 3D seismic attributes: Mathematical Methods and Modelling in Hydrocarbon Exploration and Production, Springer Verlag, 23-46
Shafiq, M., Wang, Z., Amin, A., Hegazy, T., Deriche, M., and AlRegib, G., 2015, Detection of salt-dome boundary surfaces in migrated seismic volumes using gradient of textures: 85th SEG Annual International Meeting, Expanded Abstracts, 1811–1815.
Yang, H., and Moody, J., 1999, Data visualization and feature selection: New algorithms for non-Gaussian data: Advances in Neural Information Processing Systems, 12, 687-693.
Zhang, Y., and Halpert, A. D., 2012, Enhanced interpreteraided salt boundary extraction using shape deformation: 82th SEG Annual International Meeting, Expanded Abstracts, 1–5.
Zhou, J., Zhang, Y. Q., Chen, Z. G., and Li, J. H., 2007, Detecting boundary of salt dome in seismic data with edge-detection technique: 77th SEG Annual International Meeting, Expanded Abstracts, 1392-1396.

Dr. Mohamed Deriche received his MSc and PhD from the University of Minnesota in 1994. He then joined the Queensland University of Technology, Australia. In 2001, he joined the EE Department at King Fahd University of Petroleum & Minerals, where he is leading the signal processing group. He has published over 200 papers in multimedia signal and image processing. He has delivered numerous invited talks. He has chaired several conferences including TENCON, GLOBALSIPMPSP, IEEE GCC, and IPTA. He has supervised more than 30 MSc and PhD students. He has received the IEEE third Millennium Medal, the Shauman award from best researcher, and excellence in research and excellence in teaching awards at KFUPM as well as several other awards.
Manuscript received by the Editor May 13, 2016; revised manuscript received September 9, 2016.
1. Center for Energy and Geo-Processing (CeGP) at King Fahd University of Petroleum & Minerals (KFUPM), Saudi Arabia.
?Corresponding author: Mohamed Deriche (Email: mderiche@kfupm.edu.sa)
? 2016 The Editorial Department of APPLIED GEOPHYSICS. All rights reserved.

- Applied Geophysics的其它文章
- Spherical cap harmonic analysis of regional magnetic anomalies based on CHAMP satellite data*
- Coherence estimation algorithm using Kendall’s concordance measurement on seismic data*
- Three-dimensional numerical modeling of fullspace transient electromagnetic responses of water in goaf*
- 3D finite-difference modeling algorithm and anomaly features of ZTEM*
- 3D modeling of geological anomalies based on segmentation of multiattribute fusion*
- Anomalous astronomical time-latitude residuals: a potential earthquake precursor*