
Sensitivity of the simulated CO2 concentration to inter-annual variations of its sources and sinks over East Asia
2019-06-11 06:20FUYuLIAOHongTIANXiangJunGAOHaoCAIZhaoNanHANRui
FU Yu*, LIAO Hong, TIAN Xiang-Jun, GAO Hao, CAI Zhao-Nan, HAN Rui
a Climate Change Research Center, Chinese Academy of Sciences, Beijing, 100029, China
b Jiangsu Key Laboratory of Atmospheric Environment Monitoring and Pollution Control,Jiangsu Collaborative Innovation Center of Atmospheric Environment and Equipment Technology, School of Environmental Science and Engineering, Nanjing University of Information Science and Technology, Nanjing, 210044, China
c International Center for Climate and Environment Sciences, Institute of Atmospheric Physics, Chinese Academy of Sciences, Beijing, 10029, China
d National Satellite Meteorological Center, China Meteorological Administration, Beijing, 100081, China
e Key Laboratory of Middle Atmosphere and Global Environment Observation, Institute of Atmospheric Physics, Chinese Academy of Sciences, Beijing, 10029,China
Abstract The study on how the variations in CO2 sources and sinks can affect the CO2 concentration over East Asia would be useful to provide information for policymaker concerning carbon emission reduction. In this study, a nested-grid version of global chemical transport model(GEOS-Chem)is employed to assess the impacts of variations in meteorological parameters,terrestrial fluxes,fossil fuel emissions,and biomass burning on inter-annual variations of CO2 concentrations over East Asia in 2004-2012. Simulated CO2 concentrations are compared with observations at 14 surface stations from the World Data Centre for Greenhouse Gases (WDCGG) and satellite-derived CO2 column density(XCO2) from the Gases Observing SATellite (GOSAT). The comparison shows that the simulated CO2 column density is generally higher than that of GOSAT by 1.33 × 10⁻⁶ (annual mean point by point biases averaged over East Asia). The model reasonably captures the temporal variations of CO2 concentrations observed at the ground-based stations, but it is likely to underestimate the peaks-to-troughs amplitude of the seasonal cycle by 50%or more.The simulated surface CO2 concentration in East Asia exhibits the largest inter-annual variation in December-January-February (DJF). The regional mean absolute deviation (MAD) values over East Asia are within (4.4-5.0) × 10-6 for all seasons.Model sensitivity simulations indicate that the inter-annual variations of surface CO2 concentrations are mainly driven by variations of meteorological parameters,and partly modulated by the inter-annual variations of terrestrial fluxes and fossil fuel emissions in local regions.The variations of the terrestrial fluxes and fossil fuel emissions may account for ~28%of the inter-annual variation of surface CO2 concentration in southern China. The inter-annual variations of the peaks-to-troughs amplitude are dependent on variations of meteorological parameters,terrestrial fluxes and fossil fuel emissions in local regions. The influence of biomass burning emissions is relatively weak.
Keywords: Carbon dioxide; Inter-annual variation; Terrestrial biosphere flux; Fossil fuel emission
1. Introduction
Carbon dioxide (CO2) is one of the most important longlived greenhouse gases in the atmosphere. Its spatiotemporal variations are affected by human activities (i.e.,fossil fuel consumption, cement production, and land use change), as well as the exchanges between atmosphere and biosphere/ocean. East Asia, especially China, has been developing rapidly in the past few decades, accompanied by increased anthropogenic emissions. The atmospheric CO2levels in China hit new highs(up to 407×10-6)in 2017,with a relatively high annual growth rate due to large anthropogenic emissions (CMA, 2018). The terrestrial ecosystems in East Asia might play a critical role in the regional carbon budget(Le Qu′er′e et al., 2018). However, there still exist large uncertainties in the magnitude and spatio-temporal pattern of terrestrial carbon sinks at continental and regional scales resulted from the complex interactions between biosphere and atmosphere (Piao et al., 2009a, 2009b; Zhang et al., 2014;Jiang et al., 2016; Thompson et al., 2016). With rising scientific and political concerns about the regional effects of the carbon cycle, it is very essential to understand the highresolution CO2spatial distribution and variation of CO2, and a more objective estimate for the impact of the carbon flux on the CO2concentration variations in East Asia may help the policymakers about the carbon emission reduction and climate adaptation.
Chemical transport model (CTM) is a common tool for studying the variation of atmospheric CO2concentrations at global/regional scale. The CO2volume fraction in CTM is driven by prior inputs of CO2fluxes, including fossil fuel emission,biofuel emission,biomass burning emission,oceanic and terrestrial fluxes etc., and mediated by atmospheric transport. In order to investigate the spatio-temporal variation of the CO2concentration, many studies focused on evaluating the applicability of chemical transport models in CO2simulations by using atmospheric CO2ground-based observations as well as satellite-based CO2column density (XCO2) measurements (Feng et al., 2011; Zhang et al., 2015; Li et al.,2017). For instance, Feng et al. (2011) assessed the global chemical transport model (GEOS-Chem) simulation of CO2by using surface observations, aircraft measurements and satellite data from Atmospheric Infrared Sounder (AIRS)during 2003-2006.In East Asia,Li et al.(2017)evaluated the regional chemical model (CMAQ) simulation of the CO2concentration in 2012 by using GOSAT observations and ground measurements.However,due to the large uncertainties in regional carbon sources and sinks,the performance of highresolution CTM in simulating the spatio-temporal variation of CO2remains unclear,especially the inter-annual variation over East Asia.
Some efforts have been made to investigate the contribution of terrestrial ecosystems to the atmospheric CO2concentration based on chemical model simulations.Randerson et al.(1997)and Nevison et al. (2008) indicated that the terrestrial flux contributes 40%-80% to both seasonal and inter-annual variations of CO2in the Northern Hemisphere. However, the contribution of terrestrial ecosystems to the CO2concentration is contingent on the prescribed terrestrial carbon flux in the model. Several studies have analyzed the impacts of the terrestrial flux uncertainty on the CO2concentration, and the results showed that large discrepancies in the prescribed terrestrial flux could lead to biases over 5 × 10⁻⁶in the CO2concentration near surface (Fujita et al., 2003; Chen et al.,2013; Messerschmidt et al., 2013).
The data assimilation using CTM model system and observations offers a good way to provide optimized CO2fluxes.Therefore, some works of CO2simulations have tried to use the optimized estimates of terrestrial fluxes derived from the data assimilation systems to reduce the uncertainties associated with terrestrial fluxes (Nassar et al., 2010; Feng et al., 2011; Deng and Chen, 2011; Kou et al., 2015). Only a few studies focused on East Asia.Kou et al.(2015)reported that terrestrial fluxes could elevate the CO2concentration in North China and Southeast China in winter (December-February,DJF)by over 5×10⁻⁶while reduce it by over 7 × 10⁻⁶in summer (June-August, JJA) by using a regional CTM (RAMS-CMAQ) with and without terrestrial fluxes in East Asia. Nevertheless, the contribution of terrestrial ecosystems to the inter-annual variation of the atmospheric CO2concentration over East Asia has not been addressed in most modeling studies. In addition, excluding of the inter-annual variation of terrestrial fluxes might be an important source of uncertainties for further carbon flux assimilation, since the terrestrial fluxes have been reported to exhibit a significant inter-annual variation because of the changes in meteorological parameters (e.g., temperature and precipitation), land cover and land use(Zeng et al.,2005;Piao et al.,2009a;Sitch et al., 2015; Wang et al., 2016).
In this study,a comprehensive CO2simulation in East Asia during 2004-2012 is conducted by using a nested version of global chemical transport model with the optimized terrestrial fluxes from CarbonTracker.The main goals of this study are to investigate the variation of atmospheric CO2concentration,and to quantify impacts of the major CO2sources and sinks on the atmospheric CO2concentration at both seasonal and interannual scales, which helps to better understand the carbon sources and sinks, as well as regulate the carbon emissions.
2. Methods and data
2.1. Methods
2.1.1. Model description
The CO2concentration over East Asia (11°S-55°N,70°-150°E) is simulated by using the nested grid global chemical transport model (GEOS-Chem v10-01, http://www.geos-chem.org), which is driven by the GEOS-5 assimilated meteorological fields from the Goddard Earth Observing System (GEOS) of the NASA Global Modeling and Assimilation Office.The nested GEOS-Chem model has a horizontal resolution of 0.5°latitude by 0.667°longitude and 47 vertical layers. The chemical boundary conditions are taken from the GEOS-Chem global simulations performed at the horizontal resolution of 2°latitude × 2.5°longitude. The GEOS-Chem simulation of CO2has been previously used in the forwards simulations of CO2(Shim et al., 2011; Cogan et al., 2012;Chen et al., 2013) and inversion studies (Feng et al., 2009;Nassar et al., 2011; Deng et al., 2014). The GEOS-Chem CO2simulation is developed by Suntharalingam et al.(2004), and further undated by Nassar et al. (2010). In this study, the CO2is transported as a tracer with the prior CO2fluxes from fossil fuel combustion and cement production,biomass burning,biofuel burning,ocean exchanges,terrestrial exchanges, shipping, aviation and chemical productions from the oxidation of carbon monoxide, as well as methane and non-methane volatile organic compounds.
2.1.2. Numerical experiments
The following CO2simulations from 2004 to 2012 are conducted to identify the contributions of variations in emissions and meteorological parameters to the seasonal and inter-annual variations of CO2in East Asia. As suggested by Nassar et al. (2010), our model simulations are initialized on January 1st, 2003, with a globally uniform CO2field of 373.71 × 10⁻⁶that based on the monthly mean sea surface CO2concentration at Mauna Loa Observatory in Hawaii from NOAA-ESRL. After one year spin-up simulation from this initialized state, a more realistic initial distribution of atmospheric CO2in January 2004 is derived and used to drive all the simulations.
VAll is the control simulation with variations in meteorological parameters, fossil fuel emissions, biomass burning emissions, terrestrial fluxes, and ocean fluxes from 2004 to 2012. Boundary conditions for CO2are updated from the coupled global VAll simulations performed at the horizontal resolution of 2°latitude × 2.5° longitude. VMet is the simulation with changes in meteorological parameters during 2004-2012, while fossil fuel emissions, biomass burning emissions, terrestrial fluxes and ocean fluxes are fixed at the 2004 level. Boundary conditions for this nested sensitivity simulations are taken from the coupled global VMET simulations performed at the horizontal resolution 2°latitude×2.5°longitude.VTer is the simulation with changes in terrestrial fluxes during 2004-2012 over East Asia, while meteorological parameters, fossil fuel emissions, biomass burning emissions and ocean fluxes are fixed at the 2004 level.VFF is the simulation with changes in fossil fuel emissions during 2004-2012 over East Asia, while meteorological parameters, biomass burning emissions, terrestrial fluxes and ocean fluxes are fixed at the 2004 level.VBB is the simulation with changes in biomass burning emission during 2004-2012 over East Asia, while meteorological parameters, fossil fuel emission, terrestrial flux and ocean flux are fixed at the 2004 level. The boundary conditions for the nested sensitivity simulations of VTer,VFF and VBB are taken from the coupled global VAll simulations performed at the horizontal resolution 2°latitude × 2.5°longitude for 2004. It should be noted that the inter-annual variations in meteorological parameters can influence the CO2concentration in two ways.First,CO2fluxes vary with meteorological parameters. Second, variations of meteorological parameters can influence the CO2transport.The sensitivity simulation VMet is performed to examine the sensitivity of CO2to inter-annual variations of transport that induced by changes in meteorological parameters.The effects of climate-driven changes in the CO2sources and sinks (e.g.,terrestrial fluxes, oceanic fluxes, biomass burning) are included in those priori flux data.
2.1.3. Analysis method
To analyze the inter-annual variations of CO2, we quantify the impact of variations in CO2emissions and meteorological parameters on inter-annual variations of the atmospheric CO2concentration near surface by using the mean absolute deviation (MAD) and absolute percent departure from the mean(APDM), respectively, representing the absolute inter-annual variation of the CO2concentration (Fu and Liao, 2012; Mu and Liao, 2014).
2.2. Data
2.2.1. Emissions
The global emissions of CO2used in GEOS-Chem model are listed in Table 1, including fossil fuel emissions, biomass burning emissions, biofuel burning emissions of CO2from heating, cooking and removal of agriculture waste, terrestrialflux, ocean flux, the global CO2emissions from shipping,aviation emissions,and the chemical source of CO2based on CO loss rate. To account for the inter-annual variation of terrestrial fluxes, we update the terrestrial exchanges in the model with the optimized estimations of the terrestrial fluxes at the time resolution 3-hourly and the horizontal resolution of 1°latitude × 1°longitude from the CarbonTracker 2015(CT2015)(http://carbontracker.noaa.gov;Peters et al.,2007).

Table 1 Summary of emission inventories used in GEOS-Chem simulations.
2.2.2. Satellite observations
The data from version 7.3 of the GOSAT/ACOS XCO2Level 2(GOSAT/ACOS_L2_Lite_FP.7.3)from April 2009 to December 2012 is used, which is processed by using the Atmospheric CO2Observations from Space (ACOS) algorithms developed by the Orbiting Carbon Observatory(OCO)team (Osterman et al., 2017). XCO2is expressed as the number of gas molecules in a column above a unit surface area. GOSAT XCO2retrievals have previously been evaluated by the comparison with ground-based measurements of XCO2from the Total Carbon Column Observing Network(TCCON) stations (Wunch et al., 2011a; Lindqvist et al.,2015; Kulawik et al., 2016). The validations against TCCON sites data have shown that the mean bias between ACOS and TCCON data is less than 1.5 × 10⁻⁶(Wunch et al., 2011b). Compared with GOSAT XCO2retrievals, the simulated CO2volume mixing ratios are converted toat the corresponding time and locations of the observations following the method of Connor et al. (2008) as follows.

2.2.3. Observed ground-based CO2concentrations
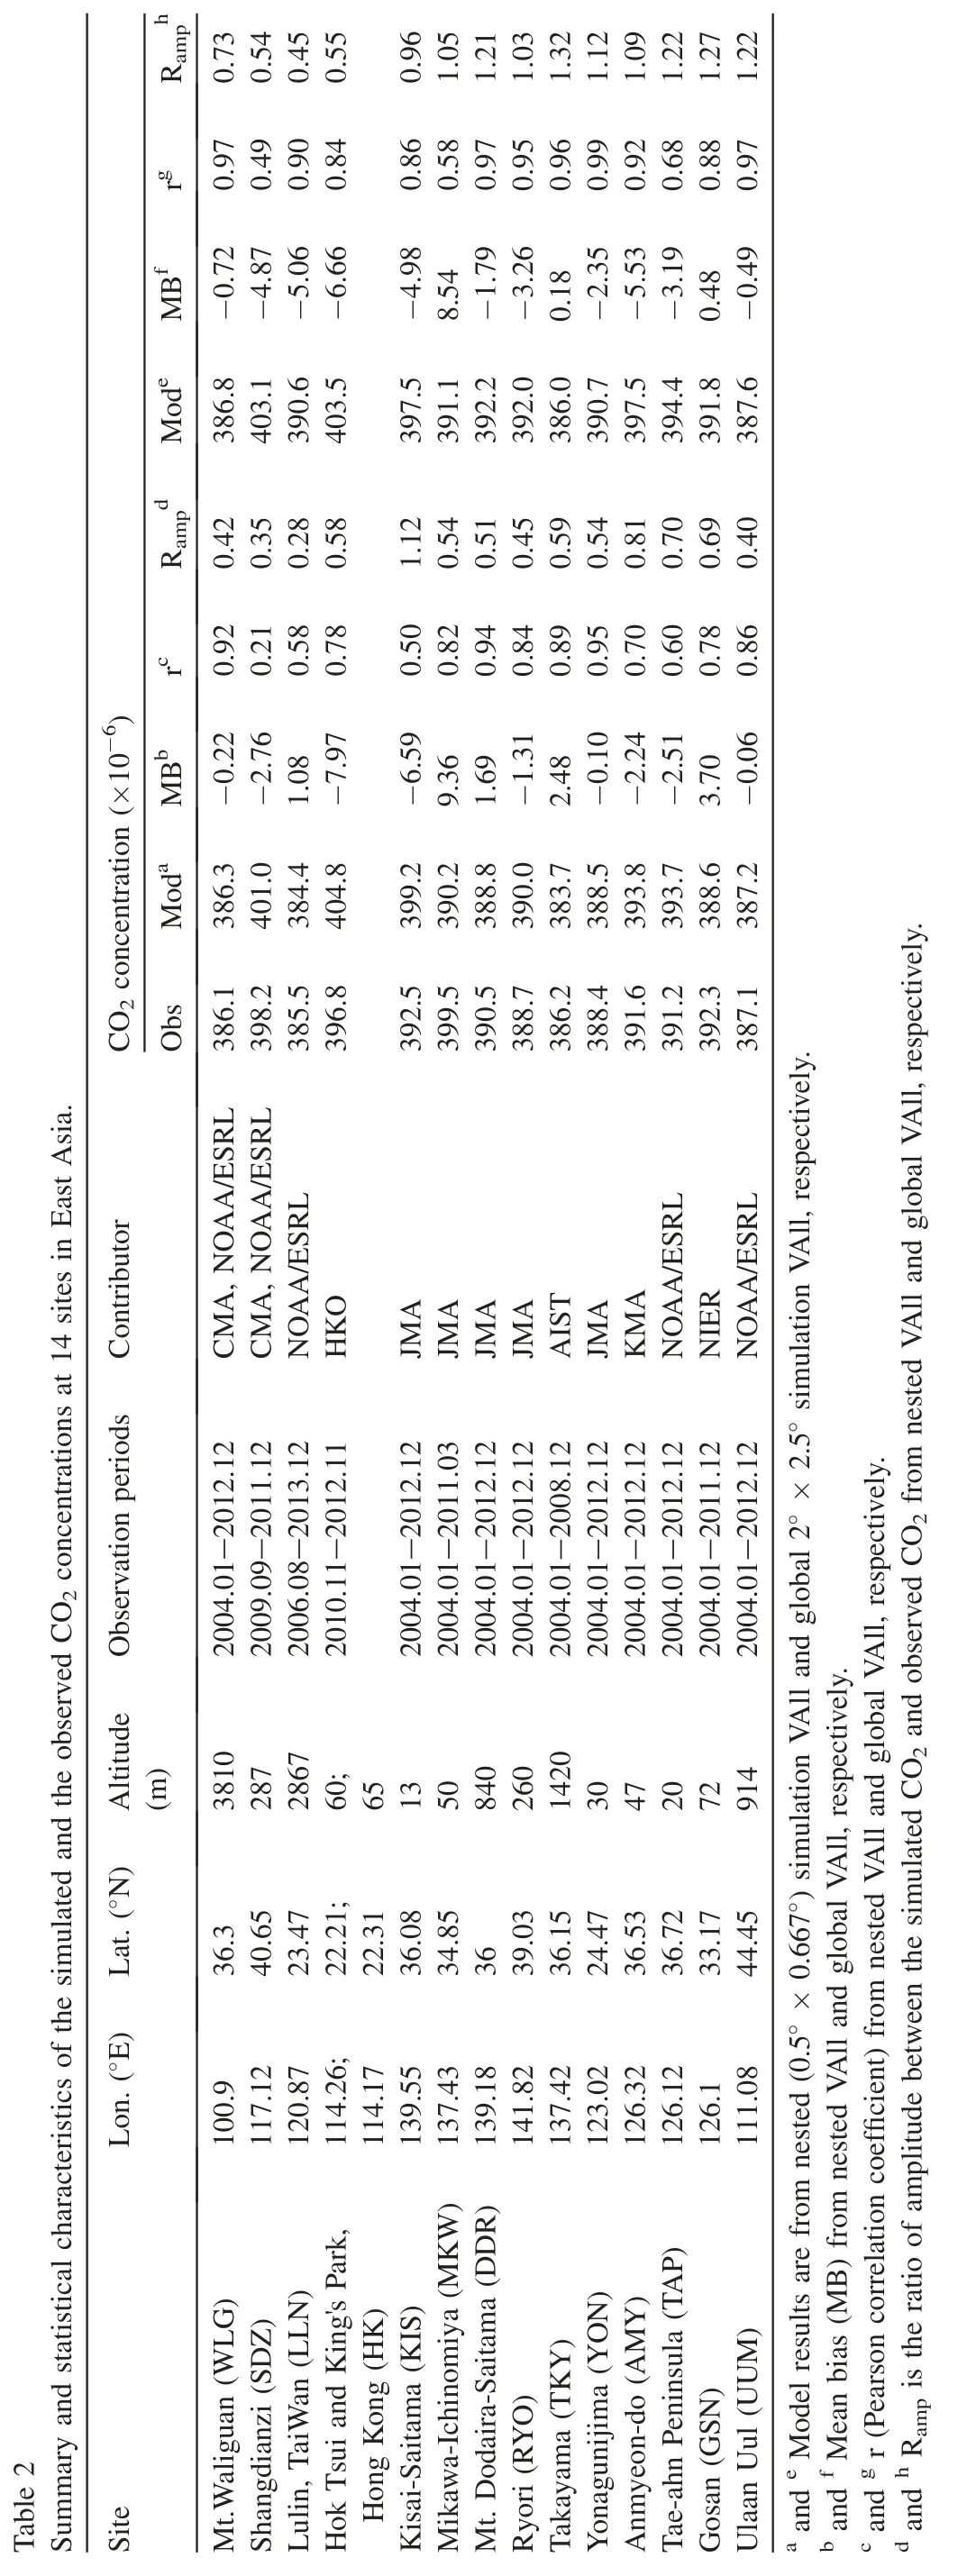
We also collected the atmospheric CO2observations at 14 sites in East Asia from NOAA Earth System Research Laboratory (ESRL, http://www.esrl.noaa.gov/gmd/ccgg/)and World Data Center for Greenhouse Gases (WDCGG,http://ds.data.jma.go.jp/gmd/wdcgg/), for which measurements are available from 2004 to 2012. A summary of the Asian surface sites used is shown in Table 2, and the geophysical location of those sites and the study domain are shown in Fig. 1.
3. Model evaluation
3.1. Evaluation of terrestrial flux
?

Fig. 1. Geophysical locations of the 14 sites (red triangle) and the regions,including Northeast China (NE), North China (NC), Southeast China (SE),Central China(CC),South China(SC),Southwest China(SW),and Northwest China (NW).
Here we firstly assessed the spatial and temporal variations in CO2sources and sinks for better understanding the model performance in simulating CO2concentration. As shown in Fig. 2a, the terrestrial fluxes are positive across most of East Asia in winter,indicating the carbon is released from the terrestrial ecosystem to the atmosphere due to the relative weak photosynthesis and strong respiration of vegetation under the cold temperature.While the terrestrial fluxes in summer are negative across East Asia, resulting from the enhanced temperature and radiation. The seasonal distribution pattern of terrestrial fluxes is quite consistent with previous findings (Yu et al., 2013). The annual terrestrial flux shows larger inter-annual variations than fossil fuel emissions, and the biosphere land sink in East Asia increases by 0.11 Pg C per year between 2004-2007 and 2008-2012.This increasing trend of the land sink in East Asia has also been identified in Thompson et al. (2016). For 2004-2012,the mean terrestrial flux of CT2015 in East Asia (China) is-0.62 Pg C per year(-0.53 Pg C per year),which is close to the upper limit of Jiang et al. (2016) (Table 3). Overall, the net CO2flux over East Asia shows an increasing trend in 2004-2012 (Fig. 2b).

Fig. 2. Horizontal distributions of seasonal mean terrestrial fluxes in winter (December-February, DJF), spring (March-May, MAM), summer (June-August,JJA), and autumn (September-November, SON) of 2004 over East Asia (a); annual CO2 emissions of fossil fuel, biomass burning and terrestrial ecosystem for 2004-2012 in East Asia and China (b).
3.2. Comparisons with satellite XCO2 data
The simulated GEOS-Chem XCO2is compared with the observed GOSAT XCO2retrievals from April 2009 to December 2012 (Fig. 3). The spatial distributions of the difference between GEOS-Chem XCO2and GOSAT XCO2vary seasonally.In DJF and spring(March-May,MAM),the simulated XCO2concentrations exhibit low biases of-1.0 × 10⁻⁶to -4.0 × 10⁻⁶ in North China, North and South Korea, and parts of Japan, but higher biases in some places of South China and Southeast China, which is consistent with the results by Lei et al. (2014). While in summer (JJA) and autumn (September-November, SON),the simulated XCO2concentrations are generally overestimated in most of East Asia, with the largest high bias up to (4.0-6.0) × 10-6relative to GOSAT observations in Northeast China. The biases can be mostly attributed to the large uncertainties of the terrestrial flux estimation. The comparison between the terrestrial flux from CT2015 and the observations from eight sites in the Chinese Terrestrial Ecosystem Flux Observation and Research Network (ChinaFLUX) (Yu et al., 2006a, 2006b, 2008, 2013) shows that the terrestrial fluxes of CT2015 fail to reproduce the peak or valley values of the observed terrestrial flux around summer,suggesting that CT2015 might underestimate the CO2exchanges between terrestrial ecosystems and the atmosphere.It may represent a CO2source and CO2sink, depending on the regions. For example, the simulated concentrations are lower than the observations in Southwest China in summer(e.g.Xishuangbanna),and this discrepancy could result from the underestimated terrestrial CO2source there. While in Northeast China (e.g. Changbaishan Mountain), the highbiases in simulated CO2concentrations are likely to occur for the underestimated terrestrial CO2sink there (not shown). Previous studies have indicated that the CO2exchange between the upper troposphere and lower stratosphere (UTLS) in high latitude and the middle and upper troposphere in subtropical and mid-latitude could impact the CO2distribution in DJF and MAM, but the model tends to underestimate CO2in the tropical and subtropical upper troposphere and overestimate CO2in the extratropical lower stratosphere as the model can't correctly capture the effects of the stratospheric intrusion (Miyazaki et al., 2008; Deng et al., 2015). Hence the discrepancies of CO2in the UTLS may partly account for the latitude-dependent biases between the simulated and observed XCO2. Moreover, the discrepancies between simulated and observed XCO2are probably due to the overestimated GOSAT XCO2retrievals over East Asia, which is suggested by Li et al. (2017).Overall, the mean point-by-point biases in DJF, MAM, JJA and SON over the study domain are (0.82 ± 1.79) × 10-6,(0.39 ± 1.50) × 10-6, (2.50 ± 2.43) × 10-6and(1.72 ± 1.65) × 10-6(mean bias ± standard deviation),respectively.

Table 3 The terrestrial carbon flux used in this study and that in previous studies.
Note that the spatial resolution of the CO2fluxes used is lower than the nested model resolution (0.5°latitude × 0.667°longitude). The observed XCO2is also compared with the simulated XCO2from global VAll simulations with the model resolution of 2°latitude × 2.5°longitude additionally for assessing the potential impact of the model resolution. As shown in Fig. 3, the spatial distributions of biases between simulations and observations are similar in both high- and low-resolution simulation, but the biases from low-resolution simulations are smaller than those from high-resolution simulations. The differences between the 2°latitude × 2.5°longitude and 0.5°latitude × 0.667°longitude simulations indicates that the biases between the simulated and the observed XCO2might partly be caused by the downscaling impact of the spatial resolution in the simulation.
3.3. Comparisons with ground-based measurements

Fig.3.Biases in the simulated XCO2 (column-averaged dry air mole fraction of CO2)when model results from 0.5° latitude×0.667° longitude simulations(left);and from 2.0°latitude × 2.5°longitude simulations (right) are compared with those from GOSAT during Apr. 2009-Dec. 2012, respectively (minus).
The ability of the GEOS-Chem model to capture the seasonal and inter-annual variations of surface CO2is assessed by using the ground-based observations at 14 sites in East Asia from WDCGG.The model exhibits similar inter-annual trends in all the 14 sites. The scatterplots for the simulated and the observed seasonal-mean CO2concentrations at 14 stations during 2004-2012 are displayed in Fig.4.The mean biases of CO2concentrations are less than 4.0 × 10⁻⁶in most of the stations except those sites near the urban regions,e.g.HK,KIS and MKW. The relative low correlations (0.21-0.50) at sites of SDZ and KIS as well as the large biases in these sites indicate a difficulty for the model to reproduce the influence of local sources and sinks,especially in the regions of big cities.At the other remote sites, the simulated CO2concentrations are consistent with the corresponding observations, with the correlation coefficients between the simulated and observed CO2concentrations ranging from 0.58 (LLN) to 0.95 (YON)(Table 2). The simulated CO2concentrations generally show positive biases at most sites (except MKW) in JJA, whereas CO2concentrations show a high or low bias in other seasons(Fig. 4). The averaged summertime simulated CO2concentration at all sites is 4.1×10⁻⁶higher than the observations.It can be inferred that the uncertainties in terrestrial fluxes in JJA may strongly affect the simulated CO2concentrations at the locations where the terrestrial biosphere dominates the seasonal cycle.The shape and phasing of the seasonal cycle in the model is overall consistent with those in observations. However, the simulated peaks-to-troughs amplitude of the CO2seasonal cycle is smaller than the observed amplitude at most sites, indicating that the GEOS-Chem tends to underestimate the amplitude of the seasonal cycle over East Asia(as inferred from the mean amplitude difference between the simulation and the observation).The mean value of the ratio between the simulated and observed peaks-to-troughs amplitude show that the simulated amplitude of surface CO2concentrations is roughly a half of the observed amplitude. The poorest consistency between the simulated and the observed amplitude appears at LLN and SDZ, where the simulated amplitude could be one third of the observed amplitude (Table 2). The substantially negative biases between the simulated and the observed amplitudes of the CO2seasonal cycle are also noted in previous studies in the Northern Hemisphere (e.g. Nevison et al., 2008). These biases are probably caused by the uncertainties in the prescribed carbon fluxes as discussed above.Also listed in Table 3 are the statistical characteristics of the simulated CO2concentrations from the 2°latitude × 2.5°longitude simulation and the observed one. In general, the evaluations of model results indicate that the GEOS-Chem model reasonably captures the spatial distributions and temporal variations of the CO2concentration in East Asia despite the biases in the simulated concentration.

Fig. 4. Comparisons of the simulated seasonal mean surface CO2 concentrations with the observations at 14 sites for 2004-2012. The 1:1 line is also shown(dashed).
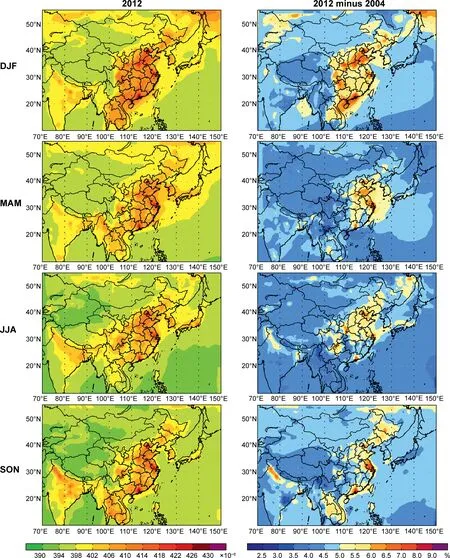
Fig.5.Horizontal distributions of the simulated surface CO2 concentration in DJF,MAM,JJA and SON over East Asia for 2012(left);the percentage changes in the simulated seasonal mean surface CO2 concentrations in East Asia between 2012 and 2004 (right).
4. Simulated changes of CO2 concentration
4.1. Seasonal mean of CO2 concentration

Fig. 6. Mean absolute deviation (MAD) of the simulated surface-layer CO2 concentrations (shaded) obtained from simulations of VAll during 2004-2012; the MAD values of surface CO2 concentrations at the observation sites (colored circles).
The distributions of the simulated seasonal-mean CO2concentrations in East Asia for 2012 are shown in Fig. 5. The distributions of the CO2concentration are similar in all seasons,and the areas with high CO2concentration are consistent with the areas with high anthropogenic CO2emissions. High CO2concentrations are simulated in East China, with the highest ones in the fairly economically developed areas, such as the Beijing-Tianjin-Hebei regions, the Yangtze River Delta and the Pearl River Delta megacity clusters. The lowest CO2concentrations exhibit in Northwest China.The simulated CO2concentration is the highest in DJF, with the maximum CO2concentration exceeding 426 × 10-6in the Pearl River Delta and the minimum CO2concentration below 390 × 10-6in western China. The CO2concentrations in JJA are smaller than the CO2concentrations in DJF, which are within the range of(406-420)×10-6over East China,Korea and Japan.It is mainly because the terrestrial ecosystems show a higher photosynthesis rate in JJA, and CO2is largely absorbed by vegetation during the growing season(Fig.2a).Also shown in Fig.5 are the percentage differences of the simulated seasonalmean surface CO2concentrations between 2012 and 2004.We find that the large difference is located in the North China Plain and the Pearl River Delta, with the large increase by~9% in DJF, which also reflect the increase of CO2emissions in those regions during 2004-2012.
4.2. Inter-annual variations of CO2 concentration
Over 2004-2012, the near-surface annual mean CO2concentration in East Asia shows an overall increasing trend((2.0-3.0) × 10-6per year). The interannual variations in surface CO2over East Asia are shown by MAD values for DJF,MAM,JJA,and SON(Fig.6).The MAD(APDM)values of the surface CO2concentration are also examined based on the measurements in East Asia. It is found that the MAD values of observations vary within the range of(2.4-8.1) × 10-6in all seasons. Comparisons between the simulated and observed MAD values in East Asia show a good agreement,especially during DJF and SON.In some places in East China where the CO2concentration is the highest(e.g.the North China Plain, the Yangtze River Delta, and the Pearl River Delta), the MAD/APDM values obtained from simulation VAll are within (6.0-9.0) × 10-6/(1.8%-2.2%) in all seasons. While the MAD/APDM values over Central China,Northeast China, Northwest China, and Southwest China are within (4.0-6.0) × 10-6/(1.1%-1.8%). The inter-annual variations of the seasonal- and annual-mean surface CO2concentrations averaged over different regions in East Asia are summarized in Fig. 7a. The MAD/APDM value of surface CO2concentration in simulation VAll is 4.6 × 10⁻⁶/(~1.2%)for annual mean over East Asia.
5. Contribution of the CO2 fluxes to CO2 concentration

Fig.7.The MAD values of seasonal and annual CO2 concentrations from the simulation VAll(a);the MAD percentage contributions of annual and seasonal CO2 concentration resulting from the variations of meteorological parameters alone (VMet), fossil fuel emissions alone (VFF), terrestrial fluxes alone (VTer) and biomass burning emissions alone (VBB) in each region of China (b-f).
To understand the inter-annual variations of the surfacelayer CO2concentration over East Asia, we further analyze the MAD values of seasonal- and annual-mean surface CO2concentrations caused by changes in meteorological parameters alone (VMet), variation in terrestrial CO2fluxes alone(VTer), variations in fossil fuel emissions alone (VFF), and variations in biomass burning emission alone (VBB),respectively. It is found that the simulated surface CO2concentrations in VAll and VMet show similar variations,indicating that variations in meteorological parameters play a significant role in shaping the inter-annual variation of surface CO2concentration. The calculation shows that variations in meteorological parameters contribute 60%-85% to the inter-annual variation of the surface CO2concentration in different regions (Fig. 7b-f). And the contribution of terrestrial CO2fluxes is larger than the contribution of fossil fuel emissions to the inter-annual variations of the CO2concentration in North China, Northeast China, Northwest China and parts of southern China(e.g.,Southwest China).In South China, the contribution of terrestrial CO2fluxes and the contribution of fossil fuel emissions to the CO2concentration are generally comparable in DJF, MAM and SON,while the variation of terrestrial CO2flux shows a larger contribution to the summertime CO2concentration than the variation of fossil fuel emissions. In general, variations in terrestrial fluxes and fossil fuel emissions may contribute up to 28%to the inter-annual variation of the CO2concentration in South China. The inter-annual variations of the CO2concentration due to variations of biomass burning emissions alone are generally smaller than those due to variations of terrestrial fluxes alone. However, the changes in biomass burning emissions might contribute as much as 7% to the inter-annual variation of the summertime CO2concentration in North China.

Fig.8.The MAD(a)and the APDM(b)values of seasonal amplitudes of CO2 concentrations from the simulation VAll,VTer,VMet,VFF and VBB averaged over studied domains.
The inter-annual variations of the peaks-to-troughs amplitude are estimated as well. Fig. 8 presents the MAD and APDM values of the seasonal amplitude of the CO2concentration in VAll, VMet, VTer, VFF and VBB over different regions. Over 2004-2012, the APDM values of the seasonal amplitude for different regions in East Asia are within 11%-27% in VAll, with the largest inter-annual variation in the southern China (e.g. South China and Southwest China). The corresponding MAD values are within (0.4-2.2)×10-6.The APDM of the CO2seasonal amplitude in VTer resembles that in VMet,reflecting that the effects of terrestrial flux variations alone on shaping the CO2amplitude could be comparable to the effects of meteorological parameters variations alone in most of studies regions.The influences of fossil fuel emissions are also found to be a significant contributor to forming the amplitude variation over the eastern China (e.g., North China and South China) where fossil fuel emissions are quite high.The APDM of the seasonal amplitude is about 11% owing to the inter-annual variations of fossil fuel emissions alone in South China and North China. The effects of the inter-annual variation in biomass burning could be more remarkable in local regions. For instance, in North China and Southwest China,the inter-annual variation of biomass burning emissions alone leads to a variation of ~6%-8%in the amplitude,while the variations of the seasonal amplitude in other regions are relatively insensitive to the variations of biomass burning emissions.
6. Conclusions and discussion
The spatiotemporal variations of surface CO2concentrations and the contributions of CO2sources and sinks on atmospheric CO2concentration in East Asia are investigated using the nested grid version of the global chemical transport model (GEOS-Chem) for the period of 2004-2012.
The comparisons of the model simulations with observations show that the model is reasonably skilled at reproducing the spatio-temporal (seasonal and annual) variations of atmospheric surface CO2concentrations in East Asia, but with an obvious overestimation of the summertime CO2concentration,which might be attributed to the higher uncertainties in terrestrial fluxes over East Asia. The model has poor performance at reproducing the observed peaks-to-troughs amplitude of atmospheric CO2. The average seasonal amplitudes derived from simulations are roughly 50%or more lower than those from observations. The simulated surface CO2concentrations are generally increasing over East Asia during 2004-2012, with the overall trend of (2.0-3.0) × 10-6per year.The inter-annual variations of the simulated surface CO2concentration averaged over East Asia are 4.6 × 10⁻⁶for MAD and 1.2% for APDM. With meteorological parameters and prescribed CO2fluxes (fossil fuel emissions, biomass burning, terrestrial fluxes and oceanic fluxes) varying over 2004-2012, the inter-annual variation in the seasonal amplitude of the CO2concentration is about 15% for the APDM over East Asia.
The results indicate that variations in meteorological parameters play a crucial role in driving the inter-annual variations of the surface CO2concentration. However, the variations of the terrestrial fluxes alone and the variations of fossil fuel emissions alone also account for up to ~14% and~17% of the inter-annual variation of the surface CO2concentration in local regions, respectively. The influences of biomass burning emissions contribute to ~7% of the interannual variation of the summertime CO2concentration in North China, while the influences in other regions are relatively small. It is found that the inter-annual variations of the seasonal amplitude of the CO2concentration are dependent on variations in both meteorological parameters and terrestrial fluxes. The inter-annual effects of fossil fuel emission variations on the seasonal amplitude are significant over South China and North China.
Nevertheless, many uncertainties remain in the spatial distribution of the terrestrial sources and sinks, particularly their temporal variations. Though the terrestrial fluxes from Carbon Tracker have been assessed with observations in some regions (e.g., North America), the uncertainties of terrestrial biosphere fluxes in East Asia still pose a challenge to the complete understanding of its impact on the inter-annual variations of CO2concentration over these regions. Moreover, besides the changes in vegetation growth and the corresponding CO2release and uptake, previous studies have suggested that the land-use activities such as deforestation and the intense agriculture may release carbon to the atmosphere, which could affect the variations of the CO2seasonal amplitude in the past several decades (IPCC,2013; Zeng et al., 2014). Recently, it is reported that the current aerosol loading over China may affect the terrestrial carbon fluxes as well as the atmospheric CO2concentrations by diffuse radiation fertilization effect and hydrometeorological feedbacks (Xie et al., 2020), but these effects are not considered here. The large difference in the seasonal amplitude between simulation and observations also indicate that reducing the uncertainties in both model simulations and observations is challenging and needs further investigations.
Conflict of interest
The authors declare no conflict of interest.
Acknowledgments
This work was supported by the National Key Research and Development Program of China (2016YFA0600203), the National Natural Science Foundation of China (41977191 and 41405138), and the Major Programs of High-Resolution Earth Observation System (32-Y2-0A17-9001-15/17). We acknowledge Carbon Tracker product provided by NOAA ESRL, Boulder, Colorado, USA (http://carbontracker.noaa.gov). We express deep gratitude to all the research teams and providers for contributing their observation data to WDCGG(http://www.esa-ghg-cci.org/).We also acknowledge the research team for providing the CO2flux measurements on the ChinaFlux (http://www.chinaflux.org/index.aspx). We are very grateful to the NASA and the ACOS/OCO-2 project for the availability of GOSAT observations.
 Advances in Climate Change Research2019年4期
- Advances in Climate Change Research的其它文章
- Assessments of the Arctic amplification and the changes in the Arctic sea surface
- Regional differences in global glacier retreat from 1980 to 2015
- Impact of environmental change on runoff in a transitional basin:Tao River Basin from the Tibetan Plateau to the Loess Plateau, China
- Impacts of degrading permafrost on streamflow in the source area of Yellow River on the Qinghai-Tibet Plateau, China
- China's long-term low carbon transition pathway under the urbanization process