
Porosity and permeability variations of a dam curtain during dissolution
2019-07-24 07:35JixingHuoFuhengXioleiJi
Water Science and Engineering 2019年2期
Ji-xing Huo *, Fu-heng M Xio-lei Ji
a State Key Laboratory of Hydrology-Water Resources and Hydraulic Engineering, Nanjing Hydraulic Research Institute, Nanjing 210029, China
b College of Construction Engineering, Jiangsu Open University, Nanjing 210019, China
Abstract During reservoir operation, the erosion effects of groundwater change the porosity and permeability of the dam curtain,causing changes to the seepage field. To understand where the changes take place and to what degree the porosity and permeability change,a multi-field coupling model was built and solved.The model takes into account seepage, solution concentration, and solid structure. The model was validated using uplift pressure monitoring data. Then, the variations in curtain porosity, seepage flow, and loss quantity of Ca(OH)2 were calculated. The key time nodes were obtained through curve fitting of the variation of seepage flow with the BiDoseResp function.The results showed that the model could reflect the attenuation trend of curtain performance well.The process and position of the erosion were not homogeneous.Although erosion mainly occurred at the top and bottom of the curtain, it was most developed at the top. The erosion effects developed slowly during the early stage,much fast during the middle and late stages,and culminated in complete dissolution.The model results and the daily monitoring data can provide a scientific basis for the safe operation and management of reservoirs.
Keywords: Dam curtain; Permeability; Multi-field coupling model; Porosity; Erosion; Solute transport; Seepage flow
1. Introduction
The curtain is an important component of the seepage control system at a dam foundation. After a reservoir is put into operation, the soluble components (mainly Ca(OH)2and hydrated calcium silicate)in the curtain are dissolved by longterm interaction with groundwater, and are subsequently removed by the groundwater. The mineral dissolution causes variations in porosity and permeability, further accelerating the dissolution process. Existing research on seepage control by the curtain mainly focuses on (1) the influences of curtain parameters on seepage flow(Mahtabi and Taran,2019),which include the depth, thickness, and position of the dam curtain;and(2)the evaluation of the permeability and durability of the curtain using factors such as seepage flow, uplift pressure,water chemistry index, and temperature (Huo et al., 2015; Li et al., 2019; Bernstone et al., 2009).
Dissolution and precipitation processes take place due to the water-rock interaction.The processes change porous media by modifying the pore space geometry. The associated hydraulic and chemical properties, such as permeability,porosity, capillary pressure curves, pore size distribution, and reactive surface area,are also changed.It is important to know how they evolve with time(R¨otting et al.,2015).The reactive transport model is an essential tool for the analysis of coupled physical, chemical, and biological processes. The model can describe the interactions at a range of spatial and time scales,and hence is critical to connecting material characterization with the macroscopic behavior of fluid flow (Steefel et al.,2005). Many reactive transport codes have been developed for subsurface environmental simulations, including PHREEQC, HPx, PHT3D, OpenGeoSys (OGS), HYTEC,ORCHESTRA, TOUGHREACT, eSTOMP, HYDROGEOCHEM, CrunchFlow, MIN3P, and PFLOTRAN (Steefel et al., 2015; Parkhurst and Appelo, 2013; Appelo and Rolle,2010; Kolditz et al., 2012; Meeussen, 2003; Xu et al., 2011;Tsai et al., 2013; Lichtner et al., 2015). The model has been applied to many research fields.Zhao et al.(2010)used both a theoretical analysis method and a computational simulation method to investigate the effects of mineral dissolution ratios on different aspects of chemical-dissolution front instability problems. To study different limestone dissolution regimes due to CO2-rich brine, Luquot et al. (2014) carried out four flow-through experiments to characterize transport and structural parameter changes during CO2-rich brine injection.Nogues et al. (2013) developed a reactive transport model to simulate reaction of carbonates within a pore network for the high-pressure CO2-acidified conditions. Kang et al. (2014)used a reactive transport lattice Boltzmann model to study the permeability-porosity relationship of two porous media at the pore scale based on wide ranges of Peclet and Damkohler numbers. Gouze and Luquot (2011) investigated the relationships between the porosity and permeability through X-ray microtomography. Maheshwari et al. (2013) presented threedimensional simulations of wormhole formation in carbonate rocks and computed the structure of the wormhole under various conditions.
There have been relatively few studies on the mechanism of curtain permeability change during the operation of reservoirs(Ruiz-Agudo et al., 2013). In particular, the chemical kinetic model has not yet been used to reflect the dissolution of the dam curtain. Based on the related theories of groundwater dynamics,solute transport,and chemical kinetics,a multi-field coupling model for solution of seepage flow, aqueous component concentration, and porosity variation was developed in this study. In this model, Ca(OH)2, the main component of the curtain,was used as the target mineral.The model was validated using uplift pressure monitoring data. In addition, the variations in curtain porosity, seepage flow, and Ca(OH)2loss were calculated. Some crucial time nodes were obtained through curve fitting with the BiDoseResp function,and used to divide the life cycle of the curtain.
2. Methods
2.1. Model development
A multi-field coupling model was built to simulate the changes in curtain porosity and permeability at a dam foundation. The model was composed of a flow module that reflects the seepage state, a solute transport module that reflects the aqueous composition,and a porosity variation module that reflects the change in curtain porosity.
2.1.1. Flow module
The two-dimensional equation for groundwater flow at a dam foundation can be expressed as
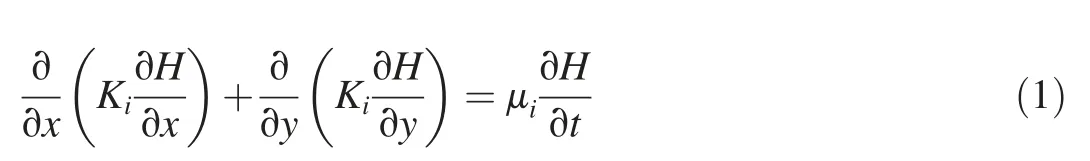
where μ is the storage coefficient defined for head; H is the head; t is time; K is the hydraulic conductivity; and i = 1, 2,representing the bedrock and curtain, respectively.
When the influences of the solution concentration and temperature on the viscosity coefficient are not considered,the hydraulic conductivity is only related to the intrinsic permeability of the porous medium, and affected by the microstructure of the solid phase medium. According to Kozeny-Carman's law, the relationship between permeability and porosity is given by the following equation (Cochepin et al.,2008):

where k0and θ0are the permeability and porosity, respectively, in the initial state, while ksand θ are the permeability and porosity, respectively, at different reaction times.
2.1.2. Solute transport module
The solute transport module describes the migration of the aqueous component in solution, and its concentration change caused by the chemical reaction is as follows:

where c is the total concentration of the target component in the groundwater; uxand uyare the horizontal and vertical velocities of the groundwater,respectively;DTand DLare the transverse and longitudinal dispersion coefficients, respectively; and R is a source/sink term, which represents the dissolution of the soluble component of the curtain.
2.1.3. Porosity variation module
The soluble components in the curtain mainly consist of Ca(OH)2, hydrated calcium silicate, and other minerals, accounting for 20%, 70%, and 10% of the curtain volume,respectively. In the interaction with groundwater, Ca(OH)2dissolves first, and decalcification occurs after all the soluble components are dissolved. Because of the complexity of the latter two soluble components, the main consideration here is the dissolution of Ca(OH)2.With the continuous dissolution of Ca(OH)2, the porosity of the curtain body continuously increases. Its growth rate is related to the dissolution rate and molar volume of Ca(OH)2. The mathematical expression is(Catherine et al., 2004)

where Msolidis the molar volume of Ca(OH)2; and Rsolidis the dissolution rate of Ca(OH)2, which is related to the concentration of Ca2+in the solution. Previous studies have shown that the dissolution rate of minerals is a function of the corresponding saturation. Therefore, the relationship between the dissolution rate of Ca(OH)2and the Ca2+concentration can be described as follows (Hummer and Heaney, 2015):
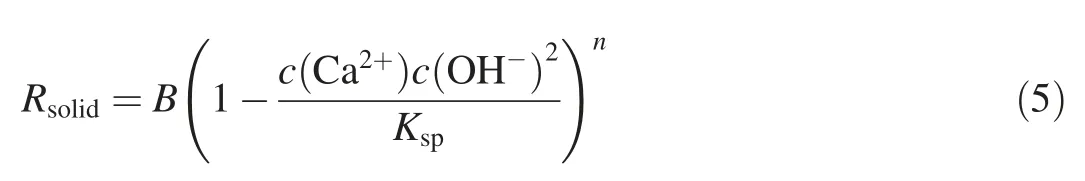
where B is the kinetic reaction constant, n is a kinetic index,c(Ca2+) is the molar concentration of Ca2+in solution,c(OH-) is the molar concentration of OH-in solution, and Kspis the solubility product constant of Ca(OH)2.It should be noted that the dissolution rate of Ca(OH)2is numerically equal to the rate of increase of Ca2+in solution.
2.2. General framework
To study the influence of Ca(OH)2dissolution on the porosity and permeability of a dam curtain, the framework in Fig. 1 was used:
First, based on the existing geological and engineering design data, appropriate parameters were selected to establish a multi-field coupling model of the dam foundation.Then,the model was solved and the calculated data such as uplift pressure and seepage flow were compared with the existing monitoring data. If the correlation between the calculated results and monitoring data was poor, the model parameters were adjusted until a good fit was obtained. When the correlation was good, curve fitting of the variation of seepage flow could be performed to obtain the time node of the curtain evolution. These methods enabled a better understanding of different stages in the curtain's work status and its life cycle.
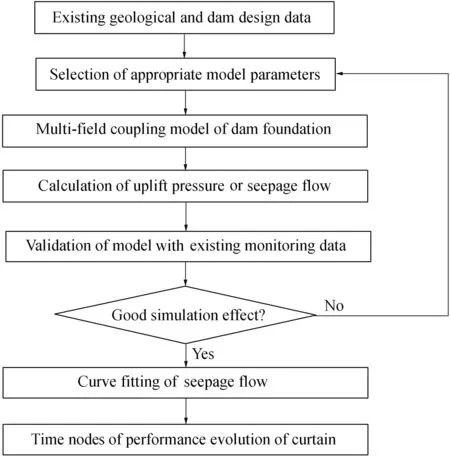
Fig. 1. General framework of modeling curtain performance evolution.
3. Application
3.1. Engineering introduction
The Shimantan Reservoir,with a roller-compacted concrete(RCC) gravity dam, in Wugang City, Henan Province, China,was used as an example. The normal water level is 107.00 m,and the total storage capacity is 1.2 × 10⁸m3. Its main functions are flood control, industrial water supply, irrigation,tourism, and aquaculture.The dam crest elevation is 112.5 m,the length at the crest is 645 m, and the maximum height is 40.5 m. It consists of a non-overflow dam section on the right side, an overflow dam section in the middle, and a nonoverflow dam section on the left side.
According to the results of water pressure tests carried out during the design stage, the permeability of the dam foundation is generally high.Between the surface and 60 m below the surface (with an elevation of 15 m), the basement rock has a permeability greater than 10 Lu and reaches a maximum value of 92.9 Lu. The permeability is greater than 2 Lu at depths of greater than 60 m from the surface. The dam uses hanging curtains with a depth of 20 m and a bottom elevation of generally 53 m. The structure utilizes a single row of cement grouting holes. The spacing between the holes is 2 m. The grouting quality inspection standard of the permeability is 3 Lu.
3.2. Model and parameters
The dam of the Shimantan Reservoir has 19 sections in total, referred to as sections 1 through 19. Section 4 was used as a typical section for case study.The profile of this section is shown in Fig. 2.
It can be seen from Fig.2 that the dam foundation is mainly composed of three parts: a grouting curtain area (area 1), a high-permeability area (area 2) above the elevation of 15 m,and a low-permeability area (area 3) below the elevation of 15 m. The relevant parameters for each area are shown in Table 1, and the model boundary conditions were as follows:the upstream and downstream heads were 106.5 and 84.8 m,respectively, and c(Ca2+) and c(OH-) were 1 × 10⁻³and 1 × 10⁻⁷mol/L, respectively.
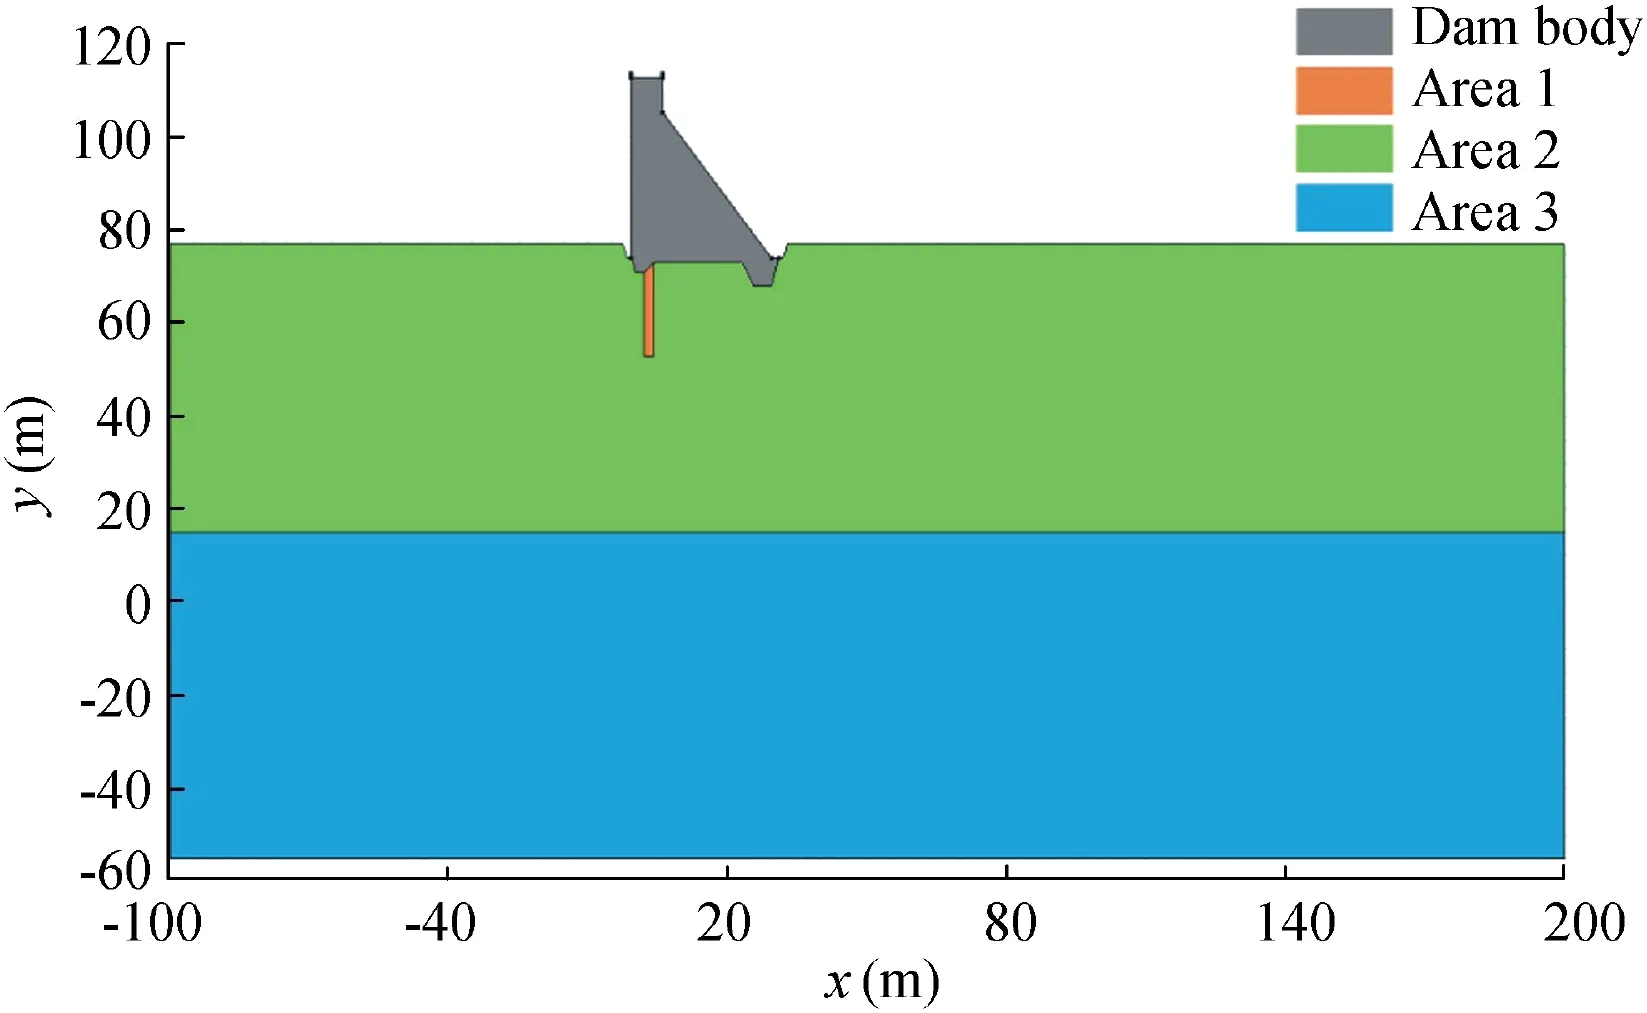
Fig. 2. Schematic model of dam and foundation of typical section.
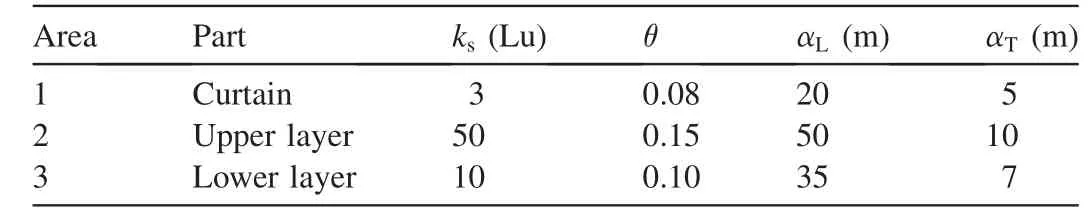
Table 1Parameters for each dam foundation area.
Drainage holes were considered conductive pipes with strong permeability in a permeable medium (Wang et al.,2001). The equivalent permeability coefficient of the drainage holes was determined based on the equivalence principle for water head and flow quantity.
3.3. Validation
When the model was solved in COMSOL, the mesh generator partitioned the study domains into mesh elements:the number of elements depended on the maximum element size when they were uniformly sub-divided.First,a segregated approach was adopted. To solve the non-linear equations in both the original model and the decoupled one, the damped Newton method (DNM) was adopted. The relative tolerance was set as 1.0 ×10⁻⁶and the maximum number of iterations was set as 25.
For the typical section(shown in Fig.2),two uplift pressure monitoring points, P1(x = 3.0 m, y = 72.5 m) and P6(x = 18.5 m, y = 72.9 m), were selected because of their relatively complete measurement sequences. The reduction factors of uplift pressure at the two monitoring points were calculated for the period from 2003 to 2015 at the time when the upstream water level was closest to the model design water level (106.5 m). The reduction factors of uplift pressure were calculated using the following equation:

where ajis the uplift pressure reduction factor at point j;H1is the upstream level; H2is the downstream level, which can be replaced by the bedrock elevation when the bedrock elevation at a given point is higher than the downstream level;and Hjis the measured water level at point j.
The Shimantan Reservoir was completed and put into operation in January 1998 and had been in operation for five years by 2003. Therefore, the simulation period selected for the model was 5-17 years from the initial commissioning(corresponding to 2003 to 2015).The measured and calculated reduction factors of uplift pressure are shown in Fig. 3.
Fig. 3(b) shows that the calculated values were less than zero because the drainage holes were considered in the simulation. The measured reduction factors for the two points gradually increased during this period, while the calculated results also followed this trend. The correlation coefficients between measured and calculated values for P1and P6were 0.749 and 0.857, respectively. This indicates that the model can reflect the attenuation of curtain performance and the change in the seepage field.

Fig. 3. Reduction factors of uplift pressure.
3.4. Long-term behavior
The results described above prove that the model can satisfactorily reflect the change in the seepage field at the dam foundation under long-term operating conditions. The model was also used to simulate the degree of erosion and the change in seepage of the curtain over a long period. A simulation period of 80 years was selected. The variation in curtain porosity for area 1 in Fig. 1 during this period is shown in Fig. 4.

Fig.4.Curtain porosity for initial state,and for 10,20,25,30,35,40,and 45 years later (from left to right).
It can be seen from Fig. 4 that with the continuous dissolution of Ca(OH)2in the curtain and removal by groundwater,the porosity of the curtain increases continuously. However,the variation is heterogeneous in time and space. In the early stage, the porosity change was basically the same throughout the region. The porosity was a little greater than it was in the initial state, but the amplitude was relatively small. After 25 years of operation, the degree of erosion varied in different parts of the curtain.The erosion mainly occurred at the top and bottom of the curtain. This difference became increasingly significant with time. During this period, the change in porosity at the top of the curtain showed that the top part of the curtain was dominated by erosion from upstream to downstream. The erosion area in the top part was larger than in the lower part, while the change in porosity at the bottom of the curtain reflected dissolution from the surface to inner areas.After 35 years of operation, the dissolution rate had clearly increased. This was especially evident when the porosity increase at the top of the curtain extended to the lower reaches,forming a leakage channel. Then, the dissolution range and rate rapidly increased,and Ca(OH)2in the curtain was rapidly removed by erosion.
The increase in curtain porosity caused by the loss of Ca(OH)2will inevitably increase the permeability of the curtain,especially after the formation of a leakage channel at the top of the curtain.The degree of change of curtain permeability can be quantified by calculating the amount of seepage flow through the dam foundation.Taking the centerline of the curtain passing through the dam foundationasatypicalsection,thesingle-widthseepageflow through the section during the simulation period and its rate of change were calculated,as shown in Fig.5.
During the first 25 years of operation,seepage flow through the dam foundation was relatively stable with a slowly increasing trend. The single-width seepage flow increased from 8.195×10⁻⁵m2/s initially to 18.913×10⁻⁵m2/s at the end of this period, while the annual rate of increase rose from 1.31 × 10⁻⁶m2/(s·year) to 10.36 × 10⁻⁶m2/(s·year).
After the first 25 years, the increase in seepage flow began to accelerate. From 30 years to 50 years, it increased from 2.690 × 10⁻⁴m2/s to 1.030 × 10⁻³m2/s. The seepage flow increased by 228.25% and 1156.86% after 30 and 50 years of operation,respectively,compared with that of the initial stage.The annual rate of increase reached its maximum at 37 years(about 5.702×10⁻⁵m2/(s·year)).The annual rate of increase then declined and dropped rapidly to zero in just three years after 47 years.
After 50 years of operation, the seepage flow no longer increased,remaining at a relatively large magnitude of 1.030×10⁻³m2/s, with an annual rate of increase of zero. This indicates that after a long period of erosion, all Ca(OH)2in the curtain was removed and the permeability no longer increased.
Because the chemical interactions between other ions in the aqueous solution were not considered,the variation in the loss of Ca(OH)2with time could be obtained by integrating the dissolution rate of Ca(OH)2in the curtain area.The percentage of annual loss was calculated, as shown in Fig. 6.
In a similar pattern to the change in seepage flow, the loss of Ca(OH)2increased in the first 50 years. Then it no longer increased because of the complete dissolution of Ca(OH)2in the curtain. The annual loss percentage was used to illustrate this trend. It should be pointed out that at the physical dam site, curtain grouting was present only in the bedrock fractures, while the whole area was regarded as cement in the simulation.The calculated loss should therefore be larger than the actual loss.
From the annual loss percentage, it can be seen that the proportion of annual dissolution in the first 10 years was less than 1% and then increased continuously to reach the maximum at 44 years, accounting for 4.12% of the total loss.After that, the ratio dropped rapidly.

Fig. 5. Simulated variation of seepage flow and its rate of increase with time.
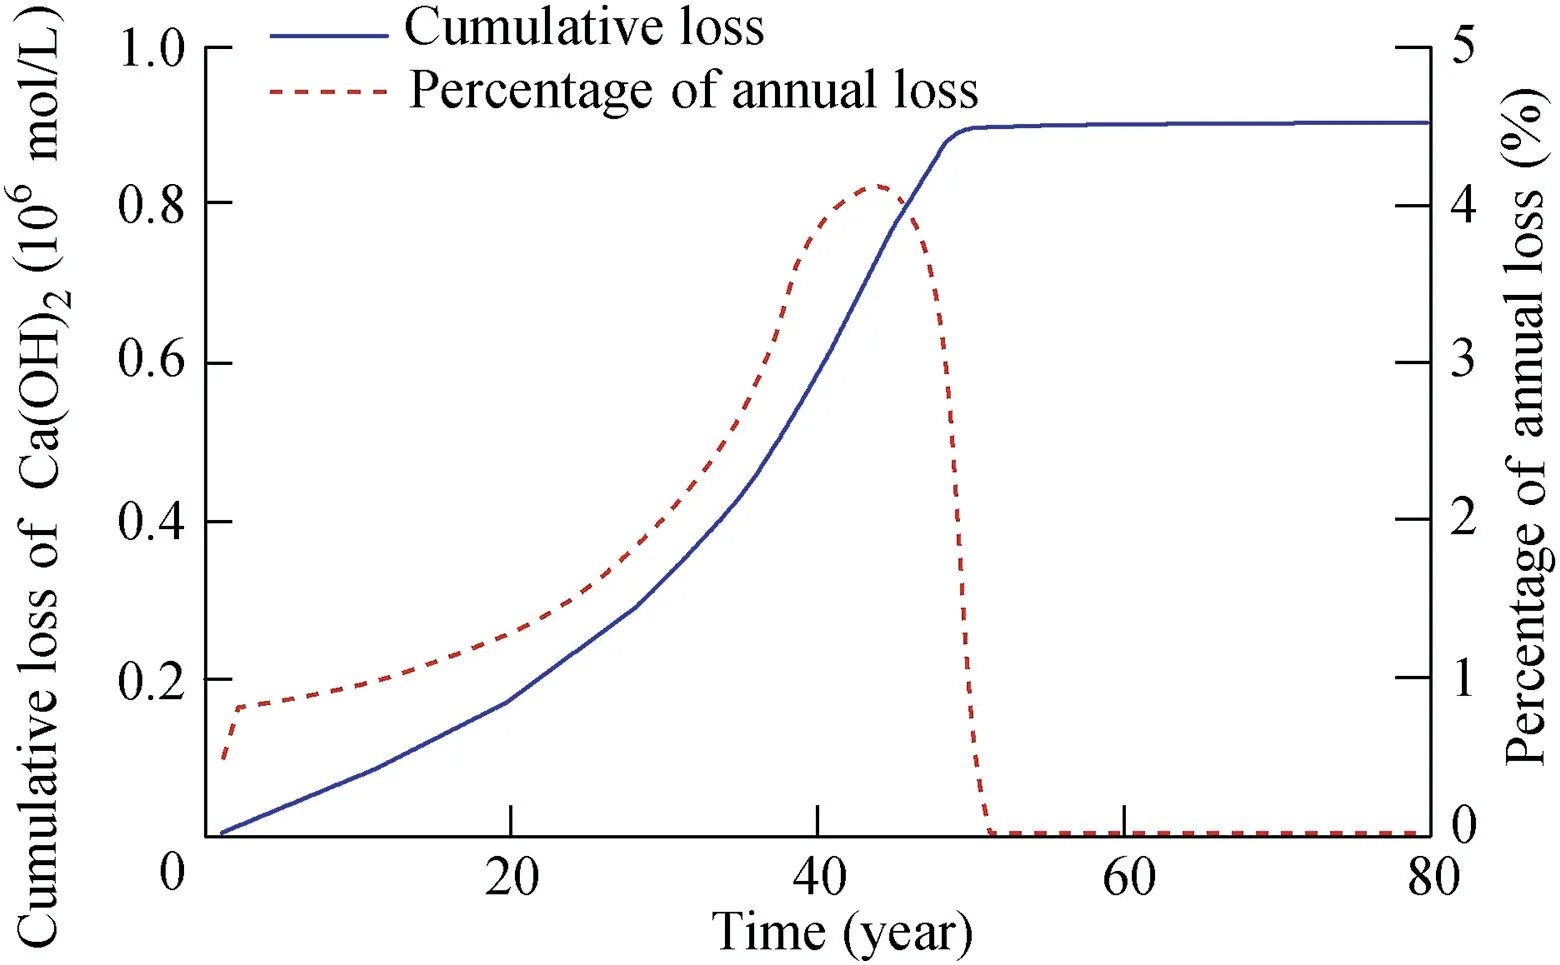
Fig. 6. Simulated variation of Ca(OH)2 loss from curtain.
3.5. Long-term time nodes
From the analysis above, it can be concluded that the change of seepage flow through the dam foundation is generally reflected by an S-shaped curve. The annual growth rate was different in the early and late stages. The seepage flow curve in Fig. 5 can be fitted by the BiDoseResp curve, a growth/sigmoidal type function.The curve can be divided into two segments according to its growth rate. The formula of seepage flow is as follows:
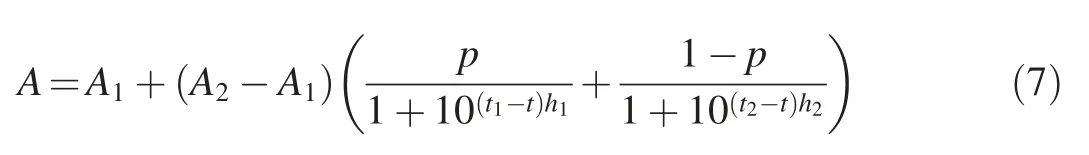
where A1and A2are the asymptotic values at the bottom and top of the curve, respectively, with A1= 8.195 × 10⁻⁵m2/s and A2=1.03×10⁻³m2/s,according to Fig.5;p is the ratio of the two segments; h1and h2are the slopes of the first and second segments,respectively;and t1and t2correspond to the characteristic times of the two segments, respectively.
Curve fitting with Eq. (7) shows the following results:
(1) The determination coefficient R2was 0.9992, which meant that the BiDoseResp curve fitting provided a good match between the fitted values and simulated ones in Fig. 5.
(2) The ratio p = 0.208, which indicated that the value at the boundary of the two segments was closer to the initial value A1, and the amplitude of the front segment in the curve was relatively small while the amplitude of the latter one was relatively large.
(3)The growth rate of the first segment was relatively slow,with h1= 0.0735; the characteristic time of the first segment was achieved, with the value of 24.98 years. The growth rate of the latter segment was much higher, with h2= 0.1254; the characteristic time of the latter segment was achieved,with the value of 39.06 years, which was only 14 years from t1.
Based on the fitting results, combined with the curves of single-width seepage flow and its annual rate of increase in Fig. 5, the life cycle of the curtain can be divided into the following four stages:
(1) The robustness and stability stage. This extends from the initial moment to the characteristic time of the first segment. During this stage, seepage through the dam foundation was generally small, and showed an extremely slow growth trend.
(2) The rapid dissolution stage. This extends from the characteristic time of the first segment to the characteristic time of the second segment. During this stage, the dissolution rate clearly increased. The average annual growth rate of seepage flow rose from 4.38 × 10⁻⁶m2/(s·year) in the previous stage to 3.20 × 10⁻⁵m2/(s·year) in this stage, or 7.3 times that of the previous stage.
(3) The near failure stage. This extends from the characteristic time of the second segment to the moment when the seepage discharge no longer increased(at 50 years).Although the annual growth rate of seepage flow was still high in this stage, it had begun to decrease year by year.
(4)The complete failure stage.Ca(OH)2in the curtain was completely dissolved (after 50 years) in this stage. The porosity of the curtain and the seepage flow through the dam foundation remained constant.
In the analysis described above, the curtain life cycle ran from the beginning of operation to its complete failure.For the Shimantan Reservoir, the life cycle is about 50 years, and the robustness and stability stage (about 25 years) accounts for 50% of the whole cycle. The rapid dissolution stage is about 28% of the life cycle (about 14 years), while the near failure stage accounts for 22% (about 11 years).
4. Conclusions
The present work described the changes of curtain porosity and permeability caused by the dissolution of Ca(OH)2by water erosion of the dam foundation. Using the Shimantan Reservoir as an example,numerical simulation was carried out to determine the process of erosion in the curtain. The time nodes of each stage in the curtain life cycle were predicted.The main conclusions are as follows:
(1) The increasing trend of curtain porosity exhibited heterogeneity both in time and in space. The porosity changed slowly in the early stage and increased rapidly in the middle and late stages. Although erosion mainly occurred at the top and bottom of the curtain, it was most developed at the top.
(2)The increase in curtain permeability leads to an increase in seepage flow through the dam foundation. The change in seepage flow was characterized by an S-shaped curve. The slope of the curve increased slowly at first and then increased sharply until Ca(OH)2was completely dissolved. The S-shaped curve was well fitted by a BiDoseResp curve, and the curve parameters can be used to predict the flow range and characteristic time.
(3)The life cycle of the curtain ran from the beginning of its operation to its complete failure when Ca(OH)2was totally dissolved. The life cycle involves the following four stages: robustness and stability, rapid dissolution, near failure, and complete failure. The time nodes for the life cycle were obtained through curve fitting of the seepage parameters.
(4) The loss of Ca(OH)2was calculated using integral calculations. The calculations showed that the annual loss of Ca(OH)2was initially relatively small, less than 1%. At later times the loss was relatively large, reaching a maximum annual loss of 4.12% of the total, and then Ca(OH)2in the curtain was completely dissolved in a short time.
 Water Science and Engineering2019年2期
- Water Science and Engineering的其它文章
- Using multi-satellite microwave remote sensing observations for retrieval of daily surface soil moisture across China
- Impacts of rainfall and catchment characteristics on bioretention cell performance
- Numerical simulation of wind-driven circulation and pollutant transport in Taihu Lake based on a quadtree grid
- Correlations between silt density index, turbidity and oxidation-reduction potential parameters in seawater reverse osmosis desalination
- Submerged flexible vegetation impact on open channel flow velocity distribution: An analytical modelling study on drag and friction
- River bank protection from ship-induced waves and river flow