
Artificial intelligence based real-time microcirculation analysis system for laparoscopic colorectal surgery
2021-01-13 07:45SangHoParkHeeMinParkKwangRyulBaekHongMinAhnInYoungLeeGyungMoSon
World Journal of Gastroenterology 2020年44期
Sang-Ho Park, Hee-Min Park, Kwang-Ryul Baek, Hong-Min Ahn, In Young Lee, Gyung Mo Son
Abstract
Key Words: Indocyanine green; Laparoscopic; Artificial intelligent; Anastomotic complications; Colorectal surgery; Microcirculation analysis
INTRODUCTION
Colon cancer is the third most common cancer worldwide. Although surgical techniques and postoperative care have improved, anastomotic complications still occur by a variety of causes. Although surgical techniques and postoperative care have improved, anastomotic complications still occur by a variety of causes such as advanced stage, male patient, preoperative concurrent chemoradiation therapy (CCRT), anastomosis level close to anus, smoking, diabetes mellitus (DM), steroids,etc.One of reasons for anastomotic complications is able to explain with poor perfusion in the anastomosis site[1-5]. It is known that about 10% of the population has poorly developed collateral circulation branches around the splenic flexure of the colon[6-9]. Due to the differences in vascular structure, the resection and anastomosis in the poorly perfused colonic area may lead to postoperative colonic hypoperfusion[10,11]. Acute hypoperfusion at the anastomosis can lead to anastomotic leakage or colonic necrosis which may followed by sepsis or multiple organ failure[2].
Colonic perfusion status was evaluated through the bowel serosal color, palpable pulsation, peristaltic movement, Doppler velocimetry (blood flow in colonic anastomosis, Chunget al[12]), and indocyanine green (ICG) angiography. Bowel color change by surgeons’ bare eyes could be unreliable by inexperienced surgeon due to its subjectivity and lack of objective criteria, as well as the difficulty in detecting minute changes in the microcirculation of the colon wall[13-15]. The ultrasonic Doppler velocimetry is appropriate only for accessing large blood vessels. Recently, fluorescence laparoscopic system can be easily used in the surgical field for intraoperative angiography using ICG. ICG binds to plasma proteins and stays in the blood vessel to form an angiography image by illumination with near infrared (NIR) light. This property can easily visualize the tissue microcirculation by using ICG fluorescent camera[16-18]. Previous studies have attempted to quantify microcirculation perfusion status using quantitative parameters[19-23]. However, each patient has different ICG curve patterns indicating the various perfusion status due to the individual vascular structures and diverse blood flow pathways in the collateral circulation. The ICG images are also affected by the NIR illumination intensity, camera exposure time, shooting distance, and other factors. Therefore, it is necessary to introduce artificial intelligence to analyze micro blood flow in real time by integrating various analysis factors.
Experienced surgeon can empirically assess the risk of complications by considering bowel color and peristalsis of the colon wall. However, it takes many years of practice to get enough experience. In contrast, artificial intelligence (AI) can classify what patterns are important on their own, without requiring a long period of learning if the data is sufficient. A well-trained AI can analyze the microcirculation status by considering multiple parameters and ICG curve patterns and predict the risk of hypoperfusion related anastomotic complications. The AI based microperfusion analysis system can assist surgeon by performing real-time analysis within seconds, and delivering analysis information in a color map for surgeon to understand intuitively.
This study aims to evaluate the clinical feasibility of AI-based real-time analysis of microcirculation (AIRAM) system using standardized ICG fluorescence video of laparoscopic colorectal cancer surgery.
MATERIALS AND METHODS
Patients
This study was performed on patients who underwent laparoscopic surgery for colorectal cancer from August 2018 to May 2019 at the Pusan National University Yangsan Hospital. The inclusion criteria were patients who were 19-80 years old, had sigmoid or rectal cancer, and who underwent anterior or low anterior resection (LAR) with primary anastomosis with or without diverting ileostomy. The exclusion criteria were hemodynamic instability, emergent surgery, and pregnancy. To reduce the risk of cross-reactivity, all patients participating in the study were found to have no history of allergies or adverse reactions to either the contrast agent for computed tomography (CT) or drugs containing iodine. Additionally, liver function tests of all patients to check ICG safety were within the normal range. This study was conducted after receiving the approval of the Institutional Review Board (IRB No. 05-2018-152) of the Pusan National University Yangsan Hospital and Ministry of Food and Drug Safety (201700512). Written informed consent was obtained from all patients included in this study.
ICG perfusion measurement
In laparoscopic colorectal surgery, the inferior mesenteric artery was ligated at a high level (high ligation) or a low level with left colic artery preservation (low ligation). Then, mobilization of the upper colon and transection of the proximal colon were prepared by mesenteric division. ICG angiography was performed with a fluorescence imaging system (1588 AIM, Stryker, Kalamazoo, United States). ICG (25 mg, Daiichi Sankyo, Tokyo, Japan) was diluted in 10 mL of distilled water, and a minimum dose of 0.2 mg/kg was slowly injected into the peripheral blood vessels for 10 s. Intravenous ICG then bound to intravascular globulin or albumin and remained in the vascular circulation. Then, a near infrared ray with a wavelength of 800 nm emitted from the laparoscopic camera, causing ICG in the blood vessel to emit a wavelength of 803 nm, and the fluorescence image was outputted to the monitor. Colonic blood perfusion was observed for 2 min after ICG injection. Most fluorescence images were obtained inside the abdominal cavity, under red inversion mode. When obtained image, the distance between the laparoscopic camera and the colon was 6-8 cm. In some cases, the colon was extracted from the abdominal cavity through the mini-laparostomy site, and the fluorescence image were obtained outside the abdominal cavity with turning the lights off.
Self-organizing map network clustering and training
The self-organizing map (SOM) network is an artificial neural network that models the learning process of the visual cortex among the cerebral cortex and performs clustering by unsupervised learning[24]. The SOM network trains by performing dimensionality reduction of the input training data set and mapping to a lowdimensional representation map. The training is performed through the process of updating the weights according to the distance between the training data and each neuron. After training, each training data is clustered to a discretized representation map, with similarities between adjacent clusters.
In this study, a two-dimensional discretized representation map was used. The SOM network training process was unsupervised learning, so it was easier to collect the training data set than supervised learning because there was no need for labeling results in advance[25,26].
ICG curve pattern classification model
The ICG curve pattern classification model was AI-based, where the amount of data was directly related to the quality of the learning results due to the nature of machine learning. A training data set with sufficient data in the tens of thousands is required for the proper performance of the classification model, but it is difficult to obtain. Since different types of ICG curves can be obtained depending on the location even in one ICG video, sufficient training data can be collected by obtaining multiple ICG curves from one ICG video. In this study, the training data set was composed of 10000 ICG curves from 200 different locations in the ICG videos of 50 patients.
When extracting the ICG curves, distortion may occur due to background, light source reflection, camera shaking, and other reasons. The distortion of the ICG curve is a major cause of misjudgment in ICG curve microcirculation perfusion analysis. Therefore, it was essential to perform pre-processing to remove or mitigate the factors that cause distortion. First, the ICG fluorescent color extraction through hue, saturation, and value (HSV) color space conversion was performed to remove factors such as background and light source reflection[27-29]. ICG fluorescent emission synthesized on the image in different colors depending on the ICG camera manufacturer—green with Stryker equipment, cyan with Karl Storz, and cyan or blue with Olympus equipment. Therefore, a different threshold values applied to each fluorescent emission color to extract the ICG fluorescent color. In this process, the background and reflections of lights were removed because of the difference of color. Next, a region of interest (ROI) was set to obtain the ICG curve, and the ICG curve is obtained by the average ICG brightness inside the ROI to mitigate the effects of camera shaking and low-light noise. To alleviate this problem, the ROI is set up and the ICG curve is acquired with the average brightness inside the ROI. The appropriate size of the ROI is determined by the quality of the ICG video. If the ICG video is shaken and shot dark, the ROI should be increased. In the opposite case, the ROI needs to be small to increase the spatial resolution. Therefore, it was necessary to select ROIs with appropriate size. The size of the ROI used in this study is 5 by 5 pixels because ICG video has less shake.
In the study, 40 s ICG videos with 30 frames per second, totaling 1200 frames were used. The longer the video, the more ICG curve data samples were available, and the more accurate the classification. However, real-time performance deteriorates since the processing time becomes long. In most cases, the fluorescent emission process ended within 40 s, justifying the ICG curve data samples of 1200 frames.
The output layer of the SOM network was set to 5 × 5, 25 in two dimensions. The ICG curve input sample had 1200 elements representing a graph of fluorescent intensity over time. The training was performed using the neural net clustering in MATLAB 2019 (MathWorks, Natick, MA, United States). The training data set was 10,000 samples and 1200 elements. Clustering resulted in 25 patterns shown in Figure 1. Each pattern had a high similarity to the upper, lower, left, and right adjacent patterns, and a low similarity to more distant patterns.

Figure 1 Classified indocyanine green curve patterns as the results of self-organizing map clustering. The input training data set of selforganizing map network is 10000 samples and 1200 elements. The output layer is set to 5 × 5, 25 in 2 dimensions. Training was performed using the neural net clustering in MATLAB 2019. SOM: Self-organizing map.
The artificial neural network learned the ICG curve pattern classification model through the process described above. Since the classification model sorts the input into the most similar pattern among the 25 Learned patterns, the data needs the same characteristics as the training data set. Therefore, the test ICG curves went through the same pre-processing as the training data set.
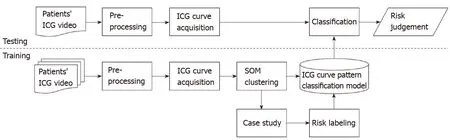
Figure 2 Block diagram of indocyanine green curve pattern classification model. Overview of processing algorithm including training process, indocyanine green (ICG) curve pattern classification process and risk evaluation process. Training data set is acquired through pre-processing from ICG videos of 50 patients and it consists of 10000 ICG curves. To obtain a learned self-organizing map network, the input data set is classified into 25 patterns, and risk labeling is performed on each classified pattern. When a new ICG curve comes in, the learned network classifies it into the most similar pattern and evaluates risk. ICG: Indocyanine green; SOM: Self-organizing map.
Figure 2 shows a block diagram of the training process, ICG curve pattern classification process, and risk evaluation process of the ICG curve pattern classification model. The training data set was acquired through pre-processing from ICG videos of 50 patients consisting of 10000 ICG curves. The SOM network training was performed using this data set, and as a result, 25 clustered patterns and an artificial neural network with learning completion was obtained. Subsequently, risk evaluation was performed for each of the 25 ICG curve patterns using a simplified colorectal vessel model and colonic circulation simulator. The ICG curve pattern classification model was completed by labeling risk on the artificial neural network after learning. For testing, additional ICG curves were obtained from ICG videos of 15 patients different from the 50 patients used for training. Using the ICG curve pattern classification model, the test ICG curves were classified into the most similar patterns among the 25 patterns learned in advance, and the risk was judged by the labeled risk information.
Risk evaluation by ICG curve pattern
Risks for the 25 ICG curve patterns classified through the SOM network were evaluated using the simulator and data on patient complications. The risk levels were classified as safe, intermediate, dangerous. Table 1 shows the risk evaluation results for the 25 ICG curve patterns. The ratio of analyzed as complication of theT1/2maxtime ratio (TR), rising slope (RS) values of each clustered ICG curve pattern and the ratio of complications based on patients’ data were also shown in Table 1. In the ratio of complications of the table, the left side of forward slash represents the number of ICG curves, which were extracted from patients with complications, and the right side represents the number of ICG curves classified in the corresponding pattern. The total sum on the left side is 1400, and the total sum on the right side is 10000, the number of the training data set. The risk of anastomosis complications of each pattern was evaluated using the ratio of complications. The patterns with more than 50% complications were evaluated as risk-dangerous, the patterns with more than 10% and less than 50% complications were evaluated as risk-intermediate, and the patterns with less than 10% complications were evaluated as risk-safe. There were several patterns in which the diagnostic results differ from the parameter-based method. The 10thpattern was difficult to analyze withT1/2maxparameter and it was unclear with RS parameter because of its large standard deviation. The 8th, 11st, 14th, 22nd, 23rd, and 24thpatterns were difficult to analyze some patients with complications using TR parameter.
Verification of AI-based microcirculation evaluation method
Typical parameters to compare areT1/2max, TR, and RS. The parameter descriptions are presented in Figure 3[19-23].Fmaxis the amount of change in ICG intensity by ICG injection, andTmaxis the time it takes for the ICG intensity change to becomeFmax·T1/2maxis the time it takes for the ICG intensity change to becomeFmax/2. The faster the blood flow velocity, the smaller theT1/2maxvalue. In this study, poor perfusion was defined byT1/2maxgreater than 18 s. The TR parameter representsT1/2max/Tmax. The TR value is large when the ICG curve pattern is concave, and the TR value is small when the ICG curve pattern is convex. Poor perfusion was defined by TR greater than 0.6. The RS parameter representsFmax/Tmax. The faster the blood flow velocity and the larger the intensity, the larger the RS value. Poor perfusion was defined as an RS less than 0.7.
To compare AIRAM with existing parameter-based methods, visualization by risk color mapping and statistical analysis of classification performance evaluation metrics were used. The risk color map marked safe, intermediate, and dangerous as red, green, and blue. The visualization of the colonic microcirculation evaluation results done by synthesizing the risk color map on a white light image. Verification of three representative ICG curve patterns and analysis for various types of patterns were confirmed. To quantify the AIRAM results, we have set the center ICG curve pattern as the patients’ unique pattern to analyze. With the training group of 50 patients, AIRAM results and typical parameters were compared with statistical tools such as receiver operating characteristic (ROC) curve and area under the curve (AUC).

Table 1 Characteristics of patients, n (%)

Or else 12 (24.0)5 (33.3)Transection line change 0.130 Yes 3 (6.0)3 (4.6)No 47 (94.0)12 (80.0)Anastomotic complications 0.566 Yes 4 (8.0)0 (0.0)No 46 (92.0)15 (100.0)BMI: Body mass index; ASA: American society of anesthesia; IMA: Inferior mesenteric artery.

Figure 3 Risk color map result of artificial intelligence based real-time analysis microperfusion on the indocyanine green video. A: Indocyanine green (ICG) fluorescence image and ICG curve graph at each position. Fmax is the amount of change in ICG fluorescence intensity. Tmax is the time it takes for the ICG fluorescence intensity change to become Fmax, T1/2max is the time it takes for the ICG fluorescence intensity change to become Fmax/2. Rising slope represents Fmax/Tmax. TR represents T1/2max/Tmax; B: Risk color map result of artificial intelligence method. Red region means risk-safe, green region means riskintermediate, and blue region means risk-dangerous. TR: Time ratio; RS: Rising slope; ICG: Indocyanine green; AI: Artificial intelligence.
In addition, verification of the classification performance was conducted with the test group of 15 patients to simulate the AI-based method. The criteria for selecting test data from the data were randomly selected. In AI learning, to prevent overfitting and validate meaningfully, we used a cross validation method that does not train all patient data. Patient data consists of a large number of normal patient data and a small number of complication risk patient data. Since patient data are not of the same distribution, some of the normal patient data were distributed to a test set and some of the complication risk patient data were distributed to a test set. The criteria for selecting test data from the data were randomly selected. The risk classification was divided into two levels where safe and intermediate risk levels were true and dangerous was false. True performance (TP), false positive (FP), false negative (FN), true negative (TN), accuracy [(TP + TN)/(TP + FN + FP + TN)], recall [TP/(TP + FN)], and precision [TP/(TP + FP)] were the classification performance evaluation metrics.
Statistical analysis
To acknowledge the characteristics on both training group and test group, clinical factors such as age, gender, smoking history, body mass index (BMI), American society of anesthesiologists (ASA) score, albumin, hypertension, diabetes, character of cancer (location, stage, and obstruction), surgical methods (operation name, initial diverting ileostomy, artery ligation level, and transection line change) and anastomotic complications were compared. Mann-Whitney test, Chi-square test and Fisher exact test were used as analyzing tools for these clinical factors. To compare AI-based method from conventional method of usingT1/2max, TR and RS parameters, ROC curve and AUC were calculated. For evaluating the classification performance of AI-based method and conventional way, classification evaluation metrics consisting of accuracy, recall, precision, and F1 score were used. IBM SPSS Statistics 26.0 (IBM SPSS, Armonk, IBM Corp, NY, United States) and was used for statistical analysis, and the significance level wasPvalue less than 0.05.
RESULTS
Characteristics of patients
In the training group, four patients (4/50, 8%) had anastomosis complications including three leakages and one stricture. Three patient (3/50, 6%) had transection line change after perfusion test during the surgery, and no one among them had occurred the anastomotic complications. In testing group, there was no anastomotic complication, but three patients had changed the transection line before separating the colon from the distal margin. Statistically, there were no significant differences in clinical characteristics between training and test group (Table 2).
Verification using visualization by risk color map
ICG curve in fluorescence image had different at each position (Figure 3). The red color of the region represented low-risk (labeled risk-safe), green indicated intermediate-risk (labeled risk-intermediate), and blue indicated high-risk (labeled risk-dangerous).
The classified risk for microperfusion status were compared AIRAM and the conventional quantitative parameters includingT1/2max, TR, and RS. When colonic perfusion was favorable as steep increasing ICG curve pattern, the classification results of conventional quantitative parameters and AIRAM were consistent (Figure 4). When the ICG graph pattern showed stepped rise, the accuracy of conventional quantitative parameters decreased, but the AIRAM classification remained excellent (Figure 5).
Statistical performance verification using classification performance evaluation metrics
The ROC curves for conventional parameters and AI-based method were compared to figure out the usefulness of the parameters for predicting the anastomoticcomplication risks (Figure 6). Among the conventional parameters, TR andT1/2maxcould be considered as useful tools to evaluate the complication risk (P= 0.006 andP= 0.034, respectively). AI-based method also had shown usefulness (P< 0.001). By comparing the AUC, AI-based method resulted more effective than conventional parameters (0.842vs0.734, 0.750, and 0.677, respectively).

Table 2 Comparison of anastomotic complication risk assessment between artificial intelligence analysis of various indocyanine green curve patterns and quantitative parameter of indocyanine green curve
By applying the AI-method to the test group of 15 patients, statistical performance verification using classification performance evaluation metrics were calculated (Figure 7). Since we had tested with such a small sampled size, the accuracy was not a suitable evaluation metrics. By calculating the recall, the AI and RS analysis were evaluated as the most accurate parameter (both resulted as 100%). On the other hand, precision with TR was evaluated as the most accurate one (67%). As the F1 score represents a harmonized average of recall and precision, AI analysis was evaluated as the most accurate parameter (75%vs44%, 67%, and 67%, respectively) to predict the risk of anastomotic complications.

Figure 4 Results of good perfusion patient with small Tmax, large Fmax, and steep indocyanine green curve. A: White light image; B: Indocyanine green (ICG) fluorescence image, very well observed; C: Color map result of artificial intelligence method; D: Color map result of T1/2max method; E: Color map result of time ratio method; F: Color map result of rising slope method; G: Average ICG curve. The results of all methods were the same as risk-safe. TR: Time ratio; RS: Rising slope; ICG: Indocyanine green; AI: Artificial intelligence.
DISCUSSION
The ICG angiography is a way of observing the tissue perfusion through ICG fluorescence using NIR camera after intravenous ICG injection. It allows more accurate evaluation of colonic perfusion than a surgeon’s subjective judgment. Favorable perfusion is considered when ICG fluorescent emission become brightly visible and poor perfusion is presumed when it is difficult to visualize. However, in some cases, it has been difficult to distinguish the microperfusion state by visually observing the subtle change in ICG fluorescence because colonic perfusion is still maintained properly with the unclear visualization of ICG fluorescent emission or vice versa. Delicate changes of ICG Fluorescence could be represented by various graph patterns, so the quantitative parameters were analyzed to classify the ICG graph pattern for evaluating the microperfusion state.

Figure 5 Results of moderate perfusion patient with large Tmax and Fmax, and stepped indocyanine green curve. A: White light image; B: Indocyanine green (ICG) fluorescence image; C: Color map result of artificial intelligence (AI) method; D: Color map result of T1/2max method; E: Color map result of time ratio (TR) method; F: Color map result of rising slope (RS) method; G: Average ICG curve. The result of AI method was analyzed as risk-intermediate in the middle and risk-dangerous in the outside. The result of T1/2max method was mixed up with risk-safe and risk-dangerous, and the result of TR was mixed up with all risk status. The result of RS method was analyzed as risk-safe in the middle and risk-dangerous in the outside. TR: Time ratio; RS: Rising slope; ICG: Indocyanine green; AI: Artificial intelligence.
Typical parameters areT1/2max, TR, and RS.T1/2maxand TR parameters are not affected byFmax, so that have the advantage of not being affected by the video shooting environmental factors. However, theT1/2maxand TR values are greatly disrupted by the noise of the ICG curve when the trembling of camera or shaky camera footage-like noise is compounded to the data. When the ICG curve pattern was stepped upward even in the acceptable perfusion status, theT1/2maxand TR values were delayed and reduced the accuracy of microperfusion classification. The RS parameter is resistant to ICG curve noise, but it can be affected byFmaxrelating various environmental factors[30,31].

Figure 6 Comparison on the receiver operating characteristic curves of artificial intelligence-based methods and conventional parameters determines the anastomotic complication risk by hypoperfusion. Artificial intelligence (AI) represents the AI-based method. T1/2max is the time it takes for the indocyanine green fluorescence intensity change to become Fmax/2. Rising slope represents Fmax/Tmax. Time ratio represents T1/2max/Tmax. Area under the curve stands for area under the curve. Statistically significant expresses as P value of less than 0.05. TR: Time ratio; RS: Rising slope; AI: Artificial intelligence; SE: Standard error; CI: Confidence interval; AUC: Area under the curve.

Figure 7 Statistical performance verification using classification performance evaluation metrics between artificial intelligence-based analysis and perfusion parameter of quantitative analysis. True positive (TP), false positive (FP), false negative (FN), true negative (TN), accuracy [(TP + TN)/(TP + FN + FP + TN)], recall [TP/(TP + FN)], and precision [TP/(TP + FP)] were the classification performance evaluation metrics. F1 score represents a harmonized average of recall and precision, artificial intelligence analysis was evaluated as the most accurate parameter to predict the risk of anastomotic complications. TR: Time ratio; RS: Rising slope; AI: Artificial intelligence.
We conducted a development of AI-based microperfusion analysis program to compensate the shortcomings of parameter-based methods, which are analyzed differently according to the ICG curve patterns. The ICG curve pattern depends on the microcirculation state, and well-trained AI can classify the ICG curve patterns. It is also suitable for real-time processing because it can classify a large number of ICG curves in a short amount of time. We have named this method as AIRAM system.
This study was limited to patients with sigmoid or rectal cancer. Actually, our research team is conducting another study in patients with right colonic carcinoma about optimal protocol of ICG fluorescence. When right hemicolectomy is performed, the left branch of the middle colic artery is usually preserved, so favorable perfusion conditions are maintained in most patients. And especially in Korea, the anastomotic complication is only about 1%. Therefore, right hemicolectomy was excluded from this study. However, hypoperfusion evaluation using ICG angiography could be also usefully applied to the right colon to evaluate perfusion status. After ligation of inferior mesenteric artery in left sided colons such as sigmoid or rectal cancer, collateral blood flow decreases and hypoperfusion of anastomotic sites may occur in about 10%-20% of patients. This perfusion properties are considered to be one of the reasons for the higher anastomotic complication in anterior resection than in right hemicolectomy.
As a training group, ICG fluorescence images were obtained from 50 patients using a standardized protocol. Then, 200 ROIs were set in each patient’s fluorescence image, and ICG curves were generated for each ROI. So, a total of ten thousand ICG graphs were collected from 50 patients as training group, considering that the ICG curve pattern can be differ from depending on the location in the ICG video of one patient. To apply the supervised learning algorithm, it is necessary to label perfusion results for ICG curves. However, perfusion status varies from patient to patient and it was difficult to accurately label the perfusion state using quantitative parameters or surgeon’s subjective diagnosis, researcher used SOM clustering which is an unsupervised learning algorithm to autonomously train an artificial neural network. As a result, we performed clustering that could be summarized in 25 patterns of ICG curve. Therefore, it was possible to design an ICG curve pattern classification model by labeling the perfusion status for only 25 different kinds of ICG curve patterns. The perfusion status was labeled by comprehensively considering patient complications and parameters.
In this study, we could have discriminated the colonic hypoperfusion phenomenon into two types; type 1 as segmental hypoperfusion and type 2 as collateral hypoperfusion (Figure 8). Type 1 hypoperfusion refers to the segmental hypoperfusion around the planed transection line after division of colonic mesentery. Precise assessment of segmental perfusion status plays an important role in the determination of the transection line with favorable perfusion segment. AIRAM analyzes the ICG graph pattern around the transection and the colonic perfusion status displayed by the color map line in real-time, so that could help an inexperienced surgeon to easily identify the boundary of good perfusion. To refer perfusion color map for determining the transection line in the surgical field, colonic microcirculation analysis should be performed in real-time. AIRAM can be performed real-time processing suitable for busy operation room. It took only 48.03 s to perform the preprocessing from a highdefinition (HD) ICG video of 720 × 480 quality, obtain the ICG curves, perform the ICG curve pattern classification, and display the result with a color map using MATLAB 2019 on I7-8700k Intel central processing unit (CPU) PC.
Type 2 hypoperfusion indicates the insufficient collateral circulation of colonic mesentery. If the collateral circulation of the marginal artery is deficient in the mesentery of splenic flexure, high ligation of IMA could cause critical ischemia on the descending colon. The ICG graph pattern can easily distinguish the state of colonic blood flow depending on whether or not collateral circulation is present. However, in this study, various ICG graph patterns emerged in the sigmoid colon with favorable perfusion confirmed by back flow of marginal artery. Because the path of blood flow to the large intestine varies according to the various anatomical structures of the collateral circulation, it is expected that the change in the concentration of ICG reaching the sigmoid colon also appears in various patterns. Researcher have expected that AIRAM can estimate the colonic mesenteric collateral circulation structure by analyzing various type 2 perfusion status.
This study designed to overcome the discrepancy of each quantitative parameter from the ICG curve pattern. AI-based analysis could classify the ICG curve patterns consistently. In the classification performance evaluation metrics, performance verification was improved and the visualization verification was more accurate than the conventional parameter-based method. So, real-time analysis and intuitive visualization could be helpful for inexperienced surgeons to determine the microperfusion status[32]. Since intraoperative angiography has not been easy to date, surgeons could not easily access perfusion status of the anastomosis site using objective methods. The authors applied the NIR camera system to colorectal cancer surgery and experienced more than 300 intraoperative angiography. The anastomotic complications decreased from 10% to 2% at the period of applying intraoperative ICG angiography. However, it was never easy to visually detect the abnormality of the change pattern of the ICG angiography image in 10-20 s. Through quantitative analysis, the authors were able to understand the approximate change pattern of ICG fluorescence intensity and use it in the intraoperative decision process. Therefore, if AI could be applied in the real-time quantitative analysis process of perfusion status in the colorectal surgery, it is expected that the anastomotic complications will also decrease especially in the inexperienced surgeon’s operations. In order to prove an effectiveness of AIRAM, a well-designed prospective multicenter study is urgently needed in the near future.

Figure 8 Various indocyanine green curve pattern by collateral circulatory structure of colonic mesentery after inferior mesenteric artery ligation during colorectal surgery. A: High ligation of inferior mesenteric artery (IMA) with intact collateral circulation of marginal artery; B: High ligation of IMA with insufficient collateral circulation by weak marginal artery connection in the splenic flexure mesentery; C: Intermesenteric artery connected between left colic artery and middle colic artery with intact collateral circulation; D: Low ligation of IMA with intact left colic arterial flow from IMA. IMA: Inferior mesenteric artery.
There are several limitations. First, this study included only a small number of patients from a single cohort. Since the number of patients in the training group was small sized, the process was hard enough to indicate perfusion with the high reliability. Thus, it is difficult to prove the effectiveness of AIRAM considering the multifactorial nature of colonic perfusion state and anastomotic complications. Especially, there are many causes of anastomotic complications. Even if the blood perfusion is good, complications such as leakage and stricture still occur, and these data adversely affect AI learning. Therefore, this study suggests the future research directions of the microcirculation analysis using AI-based system. Especially, clinical trials and large-scale multi-center studies should follow for composing standard applications. Second, there are many factors that influence the ICG fluorescence intensity and that could modify ICG curve. The ICG curve is not only determined by patient’s perfusion status, but also influenced by camera trembling, distance from the subject to camera, surrounding background, intestinal muscle movement, ICG injection amount, operating room light, fluorescence light source, and other factors. In this study, standardized ICG video protocol were used for training group and ICG dose, distance, light source and camera system were controlled and camera trembling was minimized by fixing the camera on the operation table, but there might still be other factors that were beyond control. Finally, ICG is metabolized in the liver, so it may be safe not to use it during surgery in patients with poor liver function such as liver cirrhosis. In this study, all patients were evaluated using laboratory liver function test panel before surgery, and liver function was normal in all patients. In particular, since the removal rate of serum ICG could be decrease in patients with cirrhosis, ICG washout may be delayed in the venous phase during fluorescence perfusion analysis, and there is a high possibility that quantitative analysis of ICG perfusion may be incorrect. Therefore, it is expected that the operator must be careful for application of ICG fluorescence perfusion test in patients with cirrhosis.
CONCLUSION
In conclusion, AI-based real-time microcirculation analysis had more accurate and consistent performance than the conventional parameter-based method. In addition, real-time analysis and intuitive color map of perfusion status allow AI-based analysis system to be available during the laparoscopic or robotic colorectal surgery. Finally, our results are able to suggest the future studies and clinical trials with using AI-based real-time microcirculation analysis system to reduce the ischemic complications after laparoscopic colorectal surgery.
ARTICLE HIGHLIGHTS

such as background, light source reflection, and camera shaking. AI learning and evaluation were performed by dividing into a training patient group (n= 50) and a test patient group (n= 15). Training ICG curve data sets were classified and machine learned into 25 ICG curve patterns using a self-organizing map (SOM) network. The predictive reliability of anastomotic complications in a trained SOM network is verified using test set.
Research results
AI-based risk and the conventional quantitative parameters includingT1/2max, time ratio (TR), and rising slope (RS) were consistent when colonic perfusion was favorable as steep increasing ICG curve pattern. When the ICG graph pattern showed stepped rise, the accuracy of conventional quantitative parameters decreased, but the AI-based classification maintained accuracy consistently. The receiver operating characteristic curves for conventional parameters and AI-based classification were comparable for predicting the anastomotic complication risks. Statistical performance verifications were improved in the AI-based analysis. AI analysis was evaluated as the most accurate parameter to predict the risk of anastomotic complications. The F1 score of the AI-based method increased by 31% forT1/2max, 8% for TR, and 8% for RS. The processing time of AIRAM was measured as 48.03 s, which was suitable for real-time processing.
Research conclusions
AI-based real-time microcirculation analysis had more accurate and consistent performance than the conventional parameter-based method. In addition, real-time analysis and intuitive color map of perfusion status allow AI-based analysis system to be available during the laparoscopic or robotic colorectal surgery.
Research perspectives
Real-time analysis of perfusion during surgery may reduce the probability of postlaparoscopic colorectal anastomotic complications. This study additionally requires clinical trials.
 World Journal of Gastroenterology2020年44期
- World Journal of Gastroenterology的其它文章
- Prognostic value of changes in serum carcinoembryonic antigen levels for preoperative chemoradiotherapy response in locally advanced rectal cancer
- Development and validation of a three-long noncoding RNA signature for predicting prognosis of patients with gastric cancer
- Use of the alkaline phosphatase to prealbumin ratio as an independent predictive factor for the prognosis of gastric cancer
- Active tuberculosis in inflammatory bowel disease patients under treatment from an endemic area in Latin America
- Prevalence and predictors of nonalcoholic fatty liver disease in South Asian women with polycystic ovary syndrome
- Associations between serum uric acid and hepatobiliary-pancreatic cancer: A cohort study