
Differential Splicing of Skipped Exons Predicts Drug Response in Cancer Cell Lines
2021-08-04 11:35EdwardSimpsonStevenChenJillReiterYunlongLiu
Edward Simpson ,Steven Chen ,Jill L.Reiter ,Yunlong Liu,*
1Center for Computational Biology and Bioinformatics,Indiana University School of Medicine,Indianapolis,IN 46202,USA
2Department of BioHealth Informatics,School of Informatics and Computing,Indiana University-Purdue University Indianapolis,Indianapolis,IN 46202,USA
3Department of Medical and Molecular Genetics,Indiana University School of Medicine,Indianapolis,IN 46202,USA
Abstract Alternative splicing of pre-mRNA transcripts is an important regulatory mechanism that increases the diversity of gene products in eukaryotes.Various studies have linked specific transcript isoforms to altered drug response in cancer;however,few algorithms have incorporated splicing information into drug response prediction.In this study,we evaluated whether basal-level splicing information could be used to predict drug sensitivity by constructing doxorubicin-sensitivity classification models with splicing and expression data.We detailed splicing differences between sensitive and resistant cell lines by implementing quasi-binomial generalized linear modeling (QBGLM) and found altered inclusion of 277 skipped exons.We additionally conducted RNA-binding protein (RBP) binding motif enrichment and differential expression analysis to characterize cis-and trans-acting elements that potentially influence doxorubicin response-mediating splicing alterations.Our results showed that a classification model built with skipped exon data exhibited strong predictive power.We discovered an association between differentially spliced events and epithelial-mesenchymal transition(EMT)and observed motif enrichment,as well as differential expression of RBFOX and ELAVL RBP family members.Our work demonstrates the potential of incorporating splicing data into drug response algorithms and the utility of a QBGLM approach for fast,scalable identification of relevant splicing differences between large groups of samples.
KEYWORDS Alternative splicing;Transcript isoform;Splicing regulation;Drug sensitivity;Precision medicine
Introduction
The splicing of pre-mRNA transcripts is an important regulatory control mechanism that significantly increases the diversity of protein isoforms in a cell [1].Alternative splicing plays a major role in the differentiation and maintenance of cellular identity,and as much as 95%of multiexon genes may be alternatively spliced [2,3].Alternative splicing is also known to contribute to cancer development and progression,and has been linked to every major signature of cancer transformation [4].Furthermore,splicing variants can help cells evade cancer therapies,and investigators have already started to explore splicing-focused therapeutic options [5–10].Additionally,certain gene isoforms have been found to alter cancer drug response through altered kinase signaling [11,12].Therefore,it is likely that alternatively-spliced isoforms play large roles in drug response,and that additional research in this area could have a major impact on the development of targeted therapeutics and drug response modeling.
Precision medicine,or tailoring treatment strategies to the patient,is dependent on clinical and molecular profiling[13].Currently,precision medicine primarily relies on limited genetic screening of well-characterized high-impact genes,such asHER2andKRAS[14].However,complex predictive models built with machine learning techniques are expected to revolutionize precision medicine in the years to come [15,16].Nevertheless,the use of complex predictive algorithms has yet to be widely accepted in clinical settings [15].While early models lacked sufficient study sizes or could not be validated,a major concern of current models is the failure to account for the complexity of tumor transcriptomes[17].Many predictive models have been trained solely on gene expression data or a combination of expression data and limited sequence variant information,such as single nucleotide polymorphisms(SNPs),copy number variants (CNVs),and small nucleotide insertions or deletions (indels) [18].Previous studies,however,have concluded that algorithms capable of integrating knowledge from various experimental techniques need to be developed in order for predictive modeling to progress [18–20].As such,a variety of experimental data,including mRNA-splicing data,must be considered in order to build more realistic and comprehensive models.
Although long-read isoform sequencing technologies exist,they are often prohibitively expensive for large-scale studies.Consequently,short-read data are commonly used to infer isoform-specific information;the drawback being that the true identities of mRNA isoforms remain unknown.This uncertainty must be accounted for in quantitative techniques[21].There are two main approaches to quantify isoform outcomes in short-read RNA-sequencing data:isoform-and exon-centric quantification[22].Isoform-centric techniques measure the expression of whole isoforms by integrating read data across multiple exons,whereas exon-centric techniques measure the relative expression of individual exons.While both isoform-and exon-centric techniques are susceptible to short-read sequencing limitations,gene complexity and the heavy reliance on mathematical modeling to address combinatorial possibilities across exons often make isoform-centric approaches less attractive[23].
To date,few studies have incorporated splicing information into predictive modeling techniques.One such study produced the SURVIV pipeline,a system for discovering mRNA isoforms associated with patient survival[24].These authors used exon-centric quantification and a binomial generalized linear model (GLM) with length normalization function on invasive ductal carcinoma data.They found that splicing information not only predicted patient survival but it also consistently outperformed expression-based models.Additionally,the authors found that combining clinical,expression,and splicing profiles produced the best performance.In another study,isoformcentric biomarker expression and drug response in cancer cell lines were investigated using a linear model to select an isoform for each response-mediating gene that showed the strongest correlation with drug sensitivity [25].A small number of these biomarkers were validated in breast cancer cell lines and significantly associated with four anti-cancer therapeutics.Together,these two studies established a connection between mRNA splicing and drug response,demonstrating the potential utility of splicing data in tumor biology.However,a drug response classification model has not yet been established,and the relationship between individual exons and cancer drug response is still largely unexplored.
Therefore,to limit the noise introduced from short-read data and avoid the use of complicated probabilistic models,we proposed an exon-centric approach to investigate the relationship between alternative splicing data and cancer drug response.Our study was defined by three primary goals:1)establish if splicing data predict drug response to a specific anti-cancer drug;2) evaluate the pretreatment differences in splicing between cell lines that are sensitive or resistant to the drug;and 3)identifycis-acting elements that help explain the observed splicing differences.To address these challenges,we merged RNA-seq data from the Cancer Cell Line Encyclopedia (CCLE) with drug response data from the Cancer Therapeutic Response Portal (CTRP)[26,27].We first applied a machine learning-based approach to determine whether basal splicing profiles predicted doxorubicin sensitivity.Then,we systematically evaluated the pretreatment differences in splicing patterns using quasibinomial generalized linear modeling(QBGLM),which allowed us to account for the uncertainty in splicing quantification and minimize the computational resources required to perform splicing analysis.Additionally,taking an exoncentric approach for quantification allowed the use of sequence information around the differentially spliced exons to identify enrichment ofcis-acting motifs and their corresponding RNA-binding proteins (RBPs),thereby providing insight into the regulation of differentially spliced exons.
Results
Dataset,drug,and model selection
We integrated RNA-seq data for 975 cell lines from CCLE with drug response data for 860 cell lines from CTRP[26,27].After intersecting cell lines in CCLE and CTRP,we observed the number of cell lines with both data types differed by drug.Per-drug area under the concentrationresponse curve(AUC)values from the CTRP were plotted(Figure S1).A higher AUC value,a surrogate for cell growth under increasing concentrations of a designated drug,corresponds to superior drug resistance.We chose doxorubicin to investigate further because it is a widely active chemotherapeutic used to treat a variety of malignancies,and it affects cells through multiple mechanisms,including DNA damage by intercalation and inhibition of topoisomerase II [28,29].Additionally,we reasoned that doxorubicin would be a right drug for proof-of-principal testing because the alternatively spliced exons we identified would likely be relevant to a variety of cancer types.In contrast,spliced exons associated with targeted therapeutics might be relevant only to cancers containing specific genomic alterations.Furthermore,doxorubicin has been used in many drug modeling studies,and therefore,our results would be expected to have greater context and build upon an existing body of knowledge.
Following drug selection,we labeled cell lines according to their AUC values:cell lines at or below the 33rd percentile of the AUC distribution were considered doxorubicin sensitive and cell lines at or above the 66th percentile as resistant (Figure 1).This provided a total of 755 cell lines with intersected RNA-seq and doxorubicin response data;253 were classified as sensitive and 258 as resistant.

Figure 1 CTRP cell line response to doxorubicin
Splicing and expression data individually predict drug sensitivity class
We postulated that alternative splicing profiles from untreatedcancer cell lines would hold predictive power for doxorubicin drug response.Hence,we built a machine learning model with elastic net logistic regression and exoncentric splicing data.Skipped exon event annotation,percent-spliced-in(PSI)calculation,and uncertainty estimation were done with the Mixture of Isoforms (MISO) software package [21].For the splicing-based model,we required skipped exon events (model features) to be present in a minimum of 35%of cell lines and to exhibit PSI values with confidence intervals (CIs) between 0.01 and 0.2.We observed that PSI values with CIs outside of this range tended to be either calculated on low read counts or exhibited unrealistically precise distributions;these PSI values were filtered because small non-consequential changes in PSI would have been incorrectly considered highly significant.Skipped exon events were then limited to only those with the highest (top 5%) PSI standard deviation,thereby targeting events with higher variance and selecting for greater model impact.From a total of 40,178 pre-filtered skipped exon events,805 remained.Cell line data were then randomly split into 7:3 (training set,n=354;testing set,n=157);each set consisted of approximately 50%sensitive and resistant cell lines.The predictive model was fit using elastic net logistic regression.The final splicing model contained a total of 42 non-zero weight events (Table S1).Model performance was assessed on the testing data,and performance metrics are provided inTable 1.
To assess whether splicing information would provide additional predictive power compared to an expressionbased approach,we constructed an expression-only model.We first used featureCounts to quantify reads mapped to gene expression features [30].To reduce the number of sparse genes,we filtered gene features with less than 10 reads in ≥35% of RNA-seq data.Using the same training set as the splicing-based model,we conducted differential expression analysis with edgeR to reduce the number of features[31].We retained genes with Benjamini-Hochberg false discovery rate (FDR) <0.05 and log2fold change >1.74 (top 5%) [32].Read counts were then transformed to log10counts per million.Out of 57,905 pre-filtered gene expression features,only 1103 remained.After running the elastic net,we obtained an expression-only model comprised of 67 non-zero weight features (Table S2).The performance of the expression-based approach was also strong(Table 1).In comparison with the splicing-based model,the sensitivity was lower (0.68vs.0.75),but the specificity(0.96vs.0.88)and area under the receiver operating characteristic curve (AUROC;0.90vs.0.85) were both higher.These metrics indicated that while splicing predicted more doxorubicin-sensitive cell lines correctly,it also predicted more false positives;on the other hand,expression-only modeling was more specific.

Table 1 Performance metrics
An integrated modeling approach outperforms standalone models
Based on our findings that splicing-and expression-based models showed strengths in sensitivity and specificity,respectively,we asked whether integrating the information from both models would lead to increased model performance.An integrated model was fit by merging the 805 events obtained after applying the splicing filter with the 1103 gene expression features remaining after applying the differential expression filter.From this combined feature set,elastic net selected 95 splicing and 216 gene expression features(Table S3).Receiver operating characteristic curve(ROC)plots for all three models are shown inFigure 2.The integrated model showed the highest accuracy and AUROC(Table 1).From this outcome,we concluded that splicing information enhanced the expression-based model and that splicing and expression data contributed improvements to sensitivity and specificity,respectively,to build a more balanced model.Bootstrapping the model building process revealed that although the combined model consistently showed a slight increase in specificity,the overall performance of the combined and expression-based models was largely the same (Figure S2).

Figure 2 Comparison of model prediction of cell line response to doxorubicin
Finally,we asked whether splicing data contribute unique information to the final model or if the skipped exons selected by elastic net are also reflected by the gene expression features.We found that skipped exon features in the splicing-only model were not located in genes in the expression-only model.Similarly,no overlapping expression and skipped exon features were observed in the combined model.These findings indicate that the information contributed by splicing data to our models was unique.
QBGLM identifies differentially spliced events
Next,we evaluated the alterations in splicing between sensitive and resistant groups that contribute to drug response differences.For this part of our study,we performed differential splicing analysis.During modeling,feature selection was not considered because machine learning algorithms tend to choose a limited number of features with the strongest predictive value,somewhat arbitrarily,rather than capture the full set of biologically relevant features.Genome-wide annotation for skipped exons resulted in a total of 38,108 events that were then filtered to retain only those with reads supporting inclusion and exclusion for a minimum of 35%of cell lines in the sensitive and resistant groups.This filter significantly decreased the event space and left 18,409 events for analysis.QBGLM was then performed in R[33].In the quasi-binomial distribution,the dispersion parameter provides for the fitting of increased variance;this property is especially useful for biological data,where the variability between samples is expected.Additionally,fitting variance by QBGLM helped account for the uncertainty introduced when using short-read data in splicing analysis and situations where a low number of reads inaccurately represent the probability of inclusion in some samples.Our procedure was also unique for splicing data normalization in that no consideration was made for exon or read length.As such,QBGLM modeled uncertainty without assuming an equal probability of reads aligning to every position in the event.WaldPvalues,corresponding to the weight on the class of the cell line,were FDR-adjusted using the Benjamini-Hochberg procedure and filtered for significance less than 0.01[32].Events were again filtered after QBGLM by requiring a difference in mean inclusion-to-total read counts of 0.1 between sensitive and resistant groups.This filter reduced falsepositive identifications by selecting events that were more likely to exert meaningful biological consequences.In total,277 significant alternatively spliced events were identified:180 with higher(Table S4)and 97 with lower(Table S5)exon frequency in resistant cells.A volcano plot of the results and examples of raw data for two significant events are presented inFigure 3.

Figure 3 Differentially spliced events analyzed by QBGLM
Over-representation analysis reveals enrichment for epithelial-mesenchymal transition
Gene ontology(GO)term enrichment was performed on gene symbols from significant alternatively spliced events to assess their relevance.Over-representation analysis with clusterProfiler revealed significant enrichment(FDR ≤0.05)for several biological processes including cell junction organization,regulation of cytoskeleton organization,and positive regulation of GTPase activity(Figure 4)[34,35].Alterations in these processes have been previously implicated in uncontrolled cellular proliferation,epithelial-mesenchymal transition(EMT),and drug resistance [36–40].Noteworthy,genes affected by splicing alterations includedSCRIB,ADAM15,MACF1,NUMB,VEGFA,andFOXM1.While the majority of splicing consequences were in-frame alternatively included or excluded exons with unknown significance,an exon identified inNUMB(exon 11,chr14:73,745,989?73,746,132)contained an alternative translational start site,and another inSCRIB(exon 16,chr8:144,889,722?144,889,784)included a portion of a PKC phosphorylation site.NUMBis a key protein in cell fate determination,and increased expression has been found to inhibit the propagation of chronic myelogenous leukemia cells[41,42].Additionally,NUMBmRNA processing is regulated by a variety of splicing factors,including RBM6,and alternativeNUMBisoforms are consistently found in cancer[43,44].SCRIBexon 16 has been reported to be associated with misregulation of EMT in specific cell types[45].
RBP binding motif enrichment and regulatory splicing factors
To elucidate a regulatory mechanism for the splicing differences between sensitive and resistant groups,we searched for RBP binding motifs corresponding to potential splicing factors.Motif analysis was conducted on seven sequence regions for each skipped exon.These regions consisted of the entire skipped exon sequence,the 300-bp sequences from the 5′and 3′ends of both flanking introns,the 150-bp sequence from the 3′end of the upstream exon,and the 150-bp sequence from the 5′ ends of the downstream exon (Figure 5A).Sequences from these regions were extracted from the hg19 reference genome and scanned for motifs using FIMO [46].All annotated skipped exons across the genome were scanned,and null distributions of counts for each motif were made from bootstrapped events to determine enrichment for identified motifs.RBP binding motifs for seven RBPs (SNRPA,PPRC1,RBM6,PCBP3,RBFOX1,EIF2S1,and ELAVL1) were identified.Locations and enrichmentPvalues of the identified RBP binding motifs are shown in Figure 5A andTable 2.Fisher’s exact test was used to determine association with higher or lower exon frequency.Splicing outcome,Fisher’sPvalues,and descriptions of the identified RBPs are shown in Table 2.Finally,we asked whether any of these enriched RBPs are differentially expressed between sensitive and resistant cell lines.Differential expression analysis was conducted using edgeR on featureCount data from the two groups(Table S6) [31,53].Significantly differential expression patterns were only observed for RBFOX and ELAVL family proteins (Figure 5B).This finding was particularly interesting as RBFOX and ELAVL family members have previously been linked to EMT and other cancer-related processes (Table 2) [45,54,55].Notably,Blencowe et al.[56] previously found that PPRC1 increased splicing ofNUMBexon 5 in CGR8 mouse embryonic stem cells compared to differentiated N2A neuroblastoma cells[56].In our work,NUMBexon 10 was differentially spliced.However,we did not see differential expression ofPPRC1as it was filtered before edgeR analysis due to low read count.In contrast,RBFOX,ELAVL,and PPRC1 were not selected as predictive features in the expression-based predictive model.Based on these findings,we conclude that additional biological information gained from splicing analysis could not be found using expression-based analysis alone.
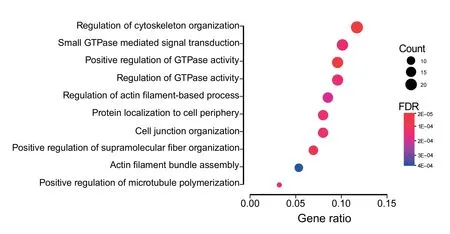
Figure 4 Enrichment of biological processes identified in differentially spliced events

Figure 5 RBP binding motifs identified in differentially spliced events
Discussion
The major conclusions of the work herein are that skipped exon splicing data independently predict drug response and,when integrated with gene expression data,can increase the power of predictive drug response algorithms.These conclusions are supported by the following experimental evidence.First,we demonstrated the strong performance of the splicing-only elastic net GLM and determined that the most balanced model was obtained by combining splicing and expression data.Second,we showed that splicing-only and expression-only models had no genes in common,which indicates that each data type contributed unique information.Additionally,we demonstrated that an exon-centric approach positively impacts downstream analysis by identifyingcis-acting RBP regulatory motifs,allowing researchers to find associations between regulatory elements of differentially spliced exons with essential biological processes.When employing RBP binding motif enrichment,we identified several candidate splicing factors,including RBFOX and ELAVL family members,which were differentially expressed between drug response groups.Moreover,we identified signatures of EMT,which affect cellular plasticity and stemness in tumor subpopulations and are thought to contribute to mechanisms behind cancer drug resistance [57–61].Collectively,our results indicate that incorporating splicing information into predictive models improves performance and provides new biological insights.
Following our analysis,we assessed the cell line origin of the classified dataset to investigate if differences in the proportions of cell lineages could help explain the enriched biological processes we observed (Figure S3).The distribution of cell lineages,specifically the proportion of hematopoietic and lymphoid cells,differed greatly across sensitive and resistant groups:hematopoietic and lymphoid cells made up 44%of sensitive cell lines compared to only 1% of resistant cell lines.Hematopoietic cell types exhibit enhanced cytotoxicity to doxorubicin treatment,a consequence of treating highly proliferative cells with a topoisomerase inhibitor [62].These cells,being more stemlike in nature compared to solid tumor tissue,are also expected to display signatures of EMT as stemness and EMT are related [63].Our over-representation analysis of differentially spliced events identified a number of biological processes,including EMT,proliferation,and drug resistance.Among other biological processes,we identified an exon inSCRIBpreviously described by Shapiro et al.[45]to be alternatively spliced and associated with an EMT signature.It is possible that the machine learning models picked up signatures related to proliferative and stem-like differences in the underlying cell types.However,we applied our modeling approach to the other 500 drugs in CTRP and observed strong performance for the vast majority(Figure S4;Table S7);many of these other drugs did not exhibit a large difference in cell type proportion(Figure S5).Further,the accuracy of our splicing-only model(82%)and accuracy of our combined model (83%) exceeded the proportion of hematopoietic and lymphoid cells in the testing set.This indicated that cell lines from other lineages are also discriminated by our classifiers according to their splicing profiles.
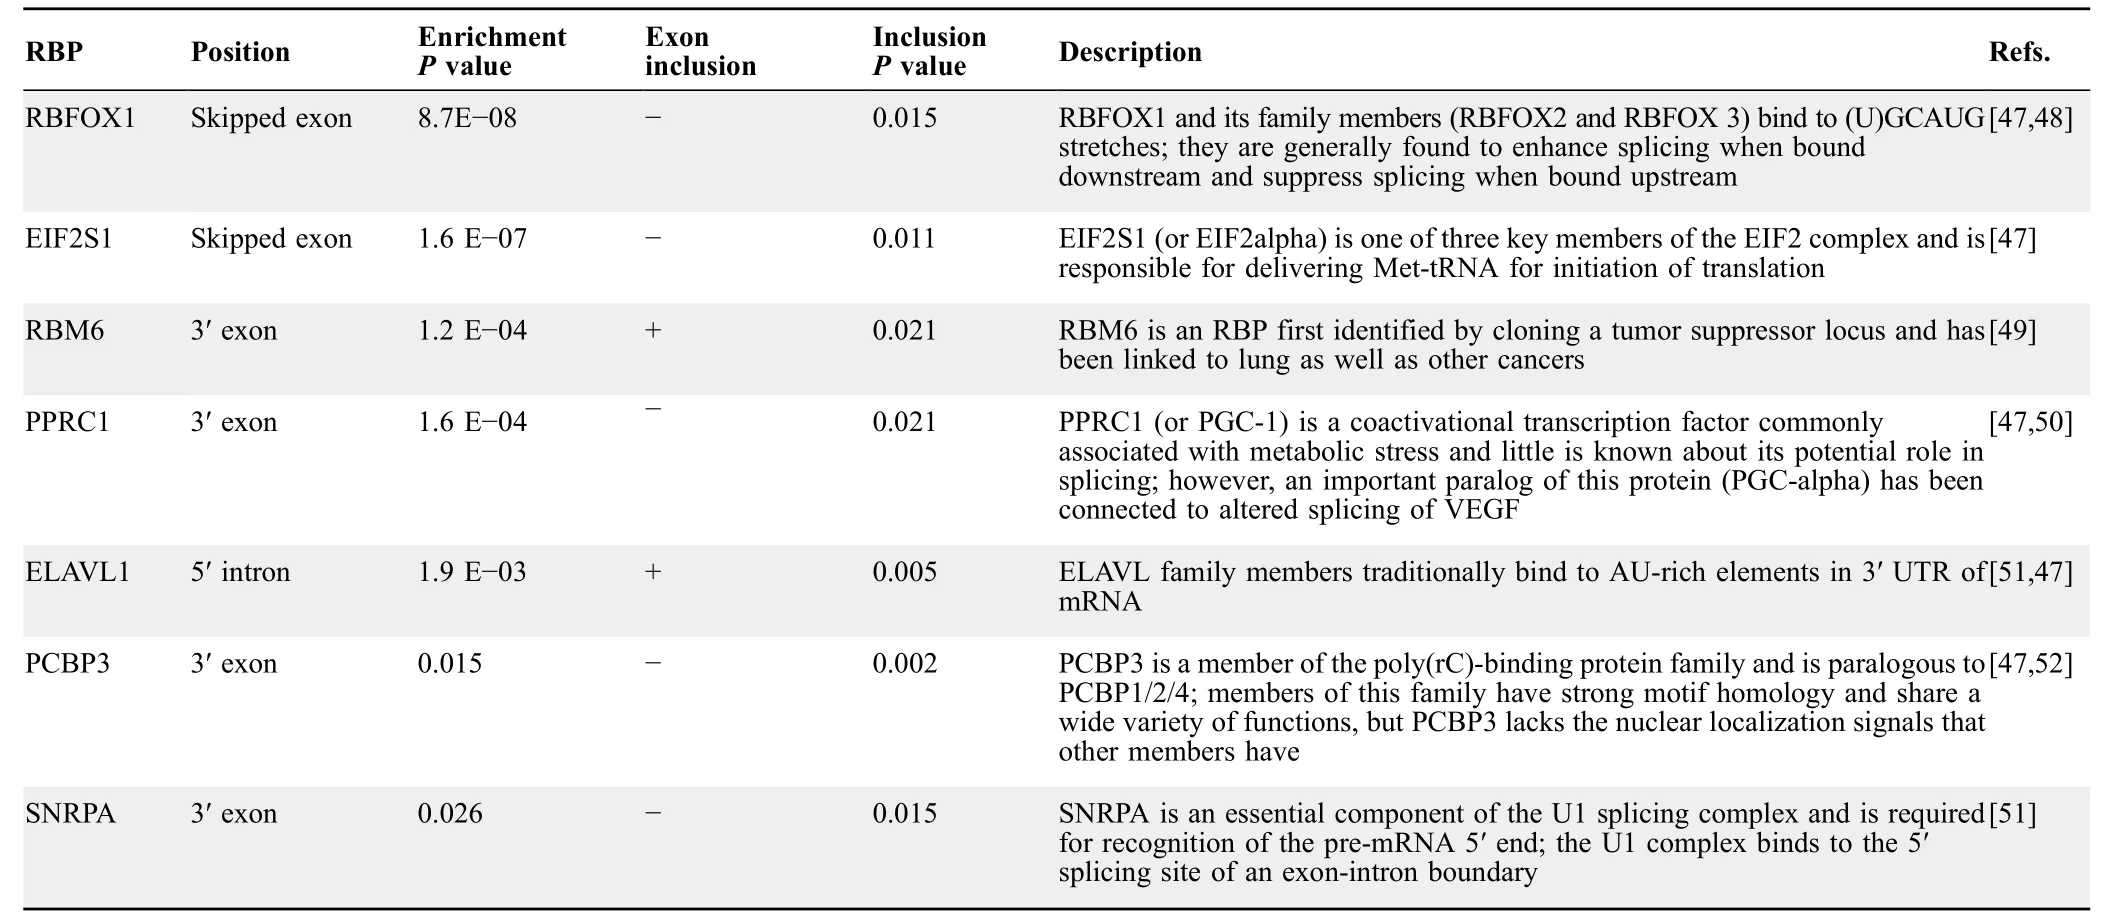
Table 2 Enriched RBPs identified by motifs in significant events from QBGLM
To determine the potential influence that cell type distribution might have had on the QBGLM results,we performed QBGLM in a tissue-specific manner on hematopoietic and lymphoid tissue and lung tissue.We then overlapped the differentially spliced events from all tissues as well as hematopoietic and lymphoid tissue and lung tissue,and found that hematopoietic and lymphoid tissue and lung tissue had many events in common (Figure S6).The vast majority of events found to overlap between the specific tissues and all tissues were present in both hematopoietic and lymphoid tissue and lung tissue.Additionally,we did not observe an imbalance in the number of events from the overlaps between all tissues and specific tissues.These findings support the conclusion that QBGLM also identified events from other tissue types besides hematopoietic and lymphoid and that many events found in hematopoietic and lymphoid cells are recapitulated by other cell types.Lastly,we did not consider predictive features from modeling during follow-up analysis because machine learning techniques arbitrarily select the most predictive features without regard for biological significance.Instead,we used only those events identified by QBGLM to explore relevant genes,pathways,and RBP binding motifs.Analyzing events from QBGLM allowed us to capture a more comprehensive list of differentially spliced events that are more likely to be relevant to the other cell types in the dataset.
To accurately assess the contribution of differential splicing to predictive drug modeling,we sought to identify a comprehensive and well-characterized dataset with drug response measurements and paired RNA-seq data.Although the widespread availability of high-throughput datasets offered a number of options for computational modeling,the majority of large-scale studies were done before RNA-seq became the predominant expression quantification method,and most of the pharmacological profiling experiments were paired with array-based expression data,making splicing analysis impossible.We searched for datasets with large numbers of samples to increase the power of our machine learning-based approach and to avoid overfitting.We also targeted diverse datasets to investigate predictive features with broad applicability,corresponding to multiple drugs and cell types.These criteria led us to integrate two large independent datasets rather than use a single resource with limited transcriptomic or pharmacological data.
While some investigators have challenged the integration of drug response datasets,the integration of these resources by others has shown reasonable consistency [64,65].Additionally,other investigators have argued that isolated testing of individual cancer cell lines is an incomplete representation of tumors and that databases containing large collections of cells better represent the heterogeneity andtissue-level characteristics of cancer[66].Because our goal was to specifically target global splicing patterns,we sought to use large datasets to reduce the impact of individual differences across databases.Therefore,we feel that our approach accurately reflected the transcriptomic and drug response measures of various cancer types,that the number and composition of cell lines in it reduced the possible influence of lineage inconsistency,and that our dataset is a reliable source of information for investigating global trends in transcript splicing or expression.
When performing machine learning,we elected to build a classification model rather than a continuous model as the CCLE and Genomics of Drug Sensitivity in Cancer(GDSC)consortia recommended dividing cell lines into sensitive and resistant groups when analyzing drug response data across datasets[67].This recommendation was based on the observation that using all cell lines in a database tended to introduce noise due to increased drug response variance from cell lines that did not have influential genetic differences [67].We analyzed performance consistency by bootstrapping the model building procedure and found that combined and expression-based models were almost equivalent (Figure S2).While we did not find splicingbased model to outperform expression-based model as previous researchers have [24,25],our approach differed from these earlier models as it was designed to determine the importance of alternative splicing in doxorubicin drug response using a minimalistic procedure rather than generating the best possible classifier.Nevertheless,while our work provides evidence that adding splicing information to expression-based models in a more controlled manner produces a better classifier,there remains room for improvement in the model building process.
Finally,we noted that differential splicing analysis with QBGLM could be achieved in minutes.Even for groups containing hundreds of samples,the analysis time is negligible if inclusion and exclusion reads are counted beforehand as part of a standard pipeline.While our analysis works well for large groups of samples,it struggles with smaller sets;however,we expect the model’s ability to handle large groups of samples to be a key strength,as the volume of sequencing data and the number of samples included in studies continue to rise.
The experimental evidence from this study strongly supports the overall hypothesis that alternative splicing data can be used to predict doxorubicin drug response,and that splicing data can contribute to valuable insights into drug response mechanisms.Resistance to doxorubicin has long been a major challenge and facilitates the resurgence of disease as well as increased patient mortality [28,68].Nevertheless,doxorubicin remains a widely prescribed antineoplastic agent and is extremely important in breast cancer treatment[68].Recently,discoveries in targeted drug delivery have expanded the variety of cancers that can be treated with doxorubicin,and there is now a greater focus on combating doxorubicin resistance [69–71].Our findings suggest that splicing information could uncover new avenues for improving the effectiveness of doxorubicin treatment.Additionally,our findings indicate that there is much more to learn about the influence of splicing on cancer drug response.Ultimately,splicing information may have a major impact on how,or under what circumstances,doxorubicin and other cancer therapeutics are used.
Materials and methods
Datasets
975 RNA-seq files corresponding to pretreatment cancer cell lines were downloaded from the CCLE and matched to post QC AUC values for 860 cancer cell lines from the CTRP v2 using the cell line name [26,27].While integrating data from two separate sources is not ideal,this approach was chosen because it provided the largest available overlap between RNA-seq and drug profiling data.Intersecting these data sets for cell lines profiled with doxorubicin yielded 755 cell lines with drug response and RNA-seq data.Cell lines were split into three groups using the tertiles of the AUC distribution.The low AUC group was labeled“sensitive”(n=253),the high group was“resistant”(n=258),and the middle group was omitted from the analysis.
MISO splicing analysis
Splicing analysis for predictive modeling was done with MISO [21].RNA-seq files belonging to sensitive and resistant groups were analyzed using exon-centric version 2 annotations for hg19 and the standard pipeline from the MISO documentation website,http://miso.readthedocs.io/en/fastmiso/.Data corresponding to 40,178 skipped exon events was obtained.
Gene expression quantification and differential expression analysis
Read counts for predictive modeling with expression data and for differential expression analysis were calculated with featureCounts [30].A genomic feature was defined as any record with a valid gene_id and was counted at the metafeature level.RNA-seq files were processed for 57,095 genomic features that were annotated in the GRCH37(v87)GTF file downloaded from ftp.ensembl.org,using a minimum read length overlap of 2 bp.Differential expression analysis was performed on featureCount data from the training dataset using edgeR[31].Only features with more than 10 reads in more than 35% of training cell lines were evaluated,leaving 22,201 features before differential expression and downstream filtering.Log10counts per million were used as feature values.The same annotation set of quantified genomic features as those used for predictive modeling (57,095) were again used for assessing differential expression of genes coding for RBPs.In this case,filtering to include features with at least 10 reads in more than 20% of cell lines reduced the number to 28,110 before differential expression analysis.In edgeR,a negative binomial generalized log-linear model with quasi-likelihood F-test (glmQLFit) was used.Differentially expressed features with an FDR ≤0.05 and a log2fold change ≥1.5 were considered significant,producing a final number of 2943 differentially expressed gene features.
Predictive modeling
Using the glmnet and caret packages in the R language,elastic net logistic regression was used to fit all predictive models [72,73].Following splicing and expression analyses,feature selection was performed to restrict the parameters of the models.Splicing features were defined as skipped exon events identified by MISO and were required to have PSI values with CIs between 0.01 and 0.2 for a minimum of 35%of cell lines.This requirement reduced the number of potential splicing features from 40,178 to 15,007.We also filtered events having a PSI standard deviation less than 0.14,based on the top 5% of the remaining skipped exon events,which reduced the number of splicing features to 805.Any missing values were then imputed randomly from all samples with data for a particular event.Gene expression features were filtered by requiring a minimum of 10 reads in more than 35% cell lines.This lowered the number of potential features from 57,905 to 22,201.Cell lines were divided into training (70%) and testing (30%)sets.This produced 354 training cell lines(177 sensitive and 177 resistant)and 157 testing cell lines(76 sensitive and 81 resistant).Individual and combined models were trained on the same training cell lines.Expression features were further restricted after training and testing set separation by conducting differential expression analysis on the training set and applying the cutoffs:FDR <0.05 and log2fold change >1.74 (top 5%).Expression-and splicing-only models were then trained using their respective filtered feature sets,while the combined model was trained by merging the two filtered feature sets and allowing the elastic net to choose freely between the whole.
A 10-fold cross-validation approach with grid search(to scan for the highest performing alpha and lambda values)was used to train the models.The models were then assessed with the testing cell line data.Sensitivity,specificity,accuracy,and precision were calculated.The AUROC,F1 score,andPvalue (corresponding to accuracy against the no-information rate) were also produced.Lastly,when building models to assess the generalizability with the remaining 500 drugs in CTRP,all event types including skipped exon,mutually exclusive exon,retained intron,alternative 5′ splice site,and alternative 3′ splice site were used for modeling.
Differential splicing analysis by QBGLM
Exon-centric splicing is usually characterized by an inclusion ratio or PSI value[74].This PSI value ranges from 0 to 1,describes the inferred percentage of transcripts containing the exon,and is heavily dependent on sequence information spanning exon–exon boundaries.Reads supporting inclusion are those reads overlapping the upstream and skipped exon junction,skipped and downstream exon junction,or all three exons including both junction boundaries.Reads supporting exclusion are those reads overlapping the upstream and downstream exon junction boundaries but not the skipped exon.The PSI value effectively compresses information from a distribution of mapped reads,where reads may correspond to multiple isoforms,into a single number.PSI has been treated as a point estimate with a margin of error rather than a definitive ratio [21].Techniques for calculating this metric can vary;however,the more popular methods rely on length-normalized read density and may include counts for non-junction reads,as well as iterative procedures for establishing a CI.
Splicing analysis by the QBGLM was done using raw read counts.A total of 38,108 skipped exon events were extracted from isoforms annotated in the GRCH37(v87)GTF file downloaded from ftp.ensembl.org.Uniquely mapped and properly paired junction reads with a minimum exon overlap of 1 bp supporting the inclusion or exclusion of skipped exons were counted for each skipped exon event.After counting,events were filtered,retaining only those with at least 1 inclusion and 1 exclusion read in 35% of classified cell lines.A total of 18,409 events passed the filter.A QBGLM was fit using the glm package in R [33].The inclusion read percentage for a given event was modeled as the probability of success.The cell line label (sensitive or resistant) was set as the dependent variable.
Events were filtered for significance by requiring a Benjamini-Hochberg adjustedPvalue ≤0.01 on the group weight (Beta1).A total of 4309 events passed the filter.Events were further separated for relevance using the difference (Δ) in mean inclusion-to-total read counts (inclusion/inclusion+exclusion)in each group.A minimum of 0.1 difference in mean inclusion-to-total read counts between sensitive and resistant groups was required to maximize biological relevance;only 277 events met this threshold.
GO over-representation analysis
Significant skipped exon events identified from QBGLM were annotated for gene symbols by the genomic positions of the skipped exons using the biomaRt package [75,76].Gene symbols for the entire set of significant events were then analyzed with the clusterProfiler packa-ge [35].Results from biological process enrichment based on the GO database were then exported and assessed for relevance.
Motif enrichment
Significant skipped exon events were analyzed for enrichment of RBP binding motifs in three stages:1) motif matches were counted for significant events in a region of interest;2) the total count for the set of significant events was compared to a background of randomly drawn events;3)significantly enriched motifs found were then filtered and sorted based on their associated splicing outcome.Seven regions surrounding each exon of interest(Figure 5A)were extracted from hg19(GRCh37).These regions were:150 bp maximum or the full length of the 5′upstream exon,300 bp of its 3′ flanking intron,300 bp in the 5′ upstream intron flanking the skipped exon,the entire length of the skipped exon,300 bp in the 3′ downstream flanking intron,300 bp in the 5′intron flanking the 3′downstream exon,and 150 bp maximum or the full length of the 3′ downstream exon.Sequences for each region were scanned using FIMO and the CISBP-RNAv0.6 RNA-binding motif database[46,77].Using aPvalue threshold for motif matches of 6.7E–4,as compared to the default 1E–4,it was necessary to find small splicing factor motifs in short extracted sequence lengths.Counts across significant events for a given motif were then compared to the genomic background in context by bootstrapping the same number of skipped exon events(without replacement) from all annotated events in the genome,repeating the procedure 10,000 times.Pvalues for significant event motif counts were then calculated using this random distribution and adjusted using the Benjamini-Hochberg method.This is referred to as the enrichmentPvalue in Table 2.Fisher’s exact test was then used on enriched motifs to identify those associated with preferential increased or decreased exon inclusions.Pvalues from Fisher’s exact test are referred to as the inclusionPvalue in Table 2.In both enrichment and preferential inclusion analyses,a minimumPvalue of 0.05 was required.
Data availability
All data used in this study are publicly available through the CCLE (https://sites.broadinstitute.org/ccle) and CTRP(https://portals.broadinstitute.org/ctrp.v2).The code used for processing and analyzing the data is available on request.
CRediT author statement
Edward Simpson:Methodology,Software,Data curation,Formal analysis,Validation,Visualization,Writing-original draft.Steven Chen:Methodology.Jill L.Reiter:Writingreview &editing.Yunlong Liu:Conceptualization,Supervision.All authors read and approved the final manuscript.
Competing interests
The authors have declared no competing interests.
Acknowledgments
This work was supported by the National Institutes of Health,USA (Grant No.R01CA213466) awarded to YL.This work was also supports by the Precision Health Initiative at Indiana University.
Supplementary material
Supplementary data to this article can be found online at https://doi.org/10.1016/j.gpb.2021.12.002.
ORCID
0000-0001-9015-9864 (Edward Simpson)
0000-0003-3463-5824 (Steven Chen)
0000-0001-5460-2355 (Jill L.Reiter)
0000-0002-2699-626X (Yunlong Liu)
 Genomics,Proteomics & Bioinformatics2021年6期
- Genomics,Proteomics & Bioinformatics的其它文章
- TSUNAMI:Translational Bioinformatics Tool Suite for Network Analysis and Mining
- Identifying Novel Drug Targets by iDTPnd:A Case Study of Kinase Inhibitors
- QAUST:Protein Function Prediction Using Structure Similarity,Protein Interaction,and Functional Motifs
- Computational Assessment of Protein–protein Binding Affinity by Reversely Engineering the Energetics in Protein Complexes
- eTumorMetastasis:A Network-based Algorithm Predicts Clinical Outcomes Using Whole-exome Sequencing Data of Cancer Patients
- BrcaSeg:A Deep Learning Approach for Tissue Quantification and Genomic Correlations of Histopathological Images