
Hybrid intelligence approach for multi-load level reactive power planning using VAR compensator in power transmission network
2021-08-24 05:06NiharKarmakarandBiplabBhattacharyya
Nihar Karmakarand Biplab Bhattacharyya
Abstract This paper formulates and solves a techno-economic planning problem of reactive power(VAR)in power transmission systems under loadings.The objective of the proposed research work is to minimize the combination of installation cost of reactive power sources,power losses and operational cost while satisfying technical constraints.Initially,the positions for the placement of reactive power sources are determined technically.Different cost components such as VAR generation cost,line charging cost etc.are then added in the total operating cost in a most economical way.Finally,the optimal parameter setting subjected to reactive power planning(RPP)is obtained by taking advantages of hybrid soft computing techniques.For the justification of the efficiency and efficacy of the proposed approach the entire work is simulated on two inter-regional transmission networks.To validate the robustness and ease of the soft computing techniques in RPP the responses of benchmark functions and statistical proof are provided simultaneously.
Keywords:Active power loss,Reactive power planning,Hybrid algorithm,Line charging,Operating cost
1 Introduction
Electric power transmission operators and planners have had immense concern on the importance of reactive power in operation and planning problems.This concern originates from ever-increasing load demands, uncertainty in voltage stability and economic benefits by obeying the operational limits.Thus, reactive power has a considerable influence on economic as well as technical aspects of a power network.
Electric power systems require to be operated in a reliable and efficient manner considering reactive power control and voltage stability management.Reactive power margins are related to voltage stability and thus, reactive power planning(RPP)is one of the most challenging tasks and complex problems for power system researchers.RPP is divided into two categories viz.planning of VAR equipment installation and planning for system operation[1].The objective of installation planning is to determine the location, size and type of reactive power compensators.On the other hand,the settings of voltage control devices such as capacitor banks, static compensators,synchronous compensators and open loop tap setting(OLTC)transformers are determined by system operation planning.Such preventive planning provides a stable, secure,reliable and economic power network[2].
In RPP there are many regular events such as demand,capacity and availability of power generating units and transmission limitations that extensively influence the system operating variables.In general these variables include active and reactive power flow through transmission lines, production of VAR in generators, tap positions of OLTC and the number of VAR sources to be installed in appropriate sizes.
1.1 Literature review
In general, solutions for RPP problems are categorized into three groups as analytical approaches [3, 4], approaches by arithmetic programming and optimization techniques by meta-heuristic evolutionary optimizers.In the past few years, researchers have been addressing the RPP problems with the help of optimization techniques such as differential evolutionary (DE) algorithm [5],Genetic algorithm (GA) [6] etc.During RPP on a connected power network, an improved-particle swarm optimization (IPSO) after the basic particle swarm optimization (PSO) is implemented in [7] to lower the deficiency in searching space for the initial particles including boundary oscillations.In [8],a PSO based hybrid approach is presented to resist severe contingencies by effective reactive power reserve without perturbing system security.A meta-heuristic optimization algorithm viz.grey wolf optimization (GWO) is proposed in [9] to solve RPP problems in the IEEE test system.
Several classical approaches for RPP have also been reported.An integrated methodology is proposed in[2]for reactive power source expansion planning,while reference[10]uses successive LP(linear programing)to establish a satisfactory operation of power networks through loss minimization and lowering investment cost.Principles of Hamiltonian and Pontryagins as well as Benders’ decomposition methods are implemented in [11] for optimal long-term RPP, while a cross-decomposition-algorithm (CDA) approach for RPP in multi-area large-scale power networks is reported in [12].Mixed-integer Linear Programming(MILP)is applied in[13]for both RPP and transmission network expansion planning,and a deterministic non-linear model is adopted in [1] for long-term RPP.
Along with the aforementioned research, the operation of India’s real power networks has been reported.To improve the voltage stability margin in an 82-node system in Indian, a non-linear least squares optimization approach is presented in[14].This helps to lower the overall value of (L-indices)2in the case of vulnerable buses.A fuzzy rule based model is applied in an Indian power network to determine effective controllers and their movement directions with step size for the enhancement of system voltage profile [15].In [16], voltage-collapse proximity based OPF as well as LP techniques are adopted for the improvement of bus voltages.A mathematical model of the Indian power system for the establishment of bidding protocol is proposed in [17], and in [18], conventional methods are presented to reduce congestion in the Indian power transmission system along with the transfer capability of the network.References [19, 20] reported different types of constraints such as security and environmental constraints etc.in the economic load dispatch (ELD) problem.Artificial intelligence (AI) techniques such as PSO are also used to determine the optimal VAR supporter size prior to the optimal power flow in [21,22].
1.2 Aims and contributions
Energy policy in India focuses on sustainable and rapid economic growth of the power sectors.To achieve this objective, the usage of energy at an affordable price along with the ancillary economic growth is of primary concern.However,low frequency(48–49 Hz)and low voltage(0.7–0.8 p.u) due to active-reactive power imbalance are some of the frequently occurring problems in Indian power networks [23].In the existing literature,the system operating cost has not been considered for RPP in Indian power networks.These networks are also very prone to voltage instability and system collapse compared to other developed nations.In [14], only one method is adopted for assessing the voltage instability, while, proper measurement of voltage instability is very important prior to reactive power compensation.This paper presents a unique technoeconomic planning strategy for Indian power sectors to provide significant economic and sustainable benefits.
The proposed approach makes the following contributions:-
1.3 Paper organization
This paper describes the mathematical outline of problem formulation and a brief explanation of the proposed methodology in Section II and III respectively.Results and details of the practical networks are illustrated in Section IV, while Section V address the statistical analysis of the optimized outcomes to measure the robustness of the proposed approach.Finally, an overall conclusion is given in Section VI.
2 Mathematical problem formulation
In reactive power planning, power networks are treated as a set of equality and inequality constraints and better strategies are practiced to control the flow of active and reactive power.RPP is categorized as a non-linear complex problem, and the equation formulations of RPP in this paper are based on power loss minimization along with minimum system operating cost,OCtotalas:
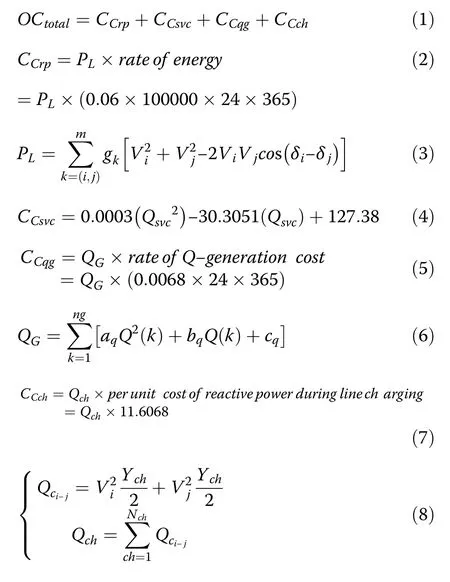
Minimize,

This paper aims to optimize the different reactive power sources such as transformer tap settings, generator reactive power output, capacitor bank etc.in a way that the system voltage profile is maintained within its limit at optimum operating conditions.Therefore, the supply of adequate reactive power is very important for maintaining the desired voltage stability.Generators are the main sources of reactive power.Reactive power pricing for generators is done using the triangle method[24] in this work, while the cost (CCqg) in (5) will encourage the reactive power producers to invest and provide more reactive power for system reliability.Total VAR generation (QG) by synchronous generators is calculated in (6).
According to the study [25] the VAR cost during line charging by line charging reactance also makes up an essential part of the planning problem.So,CCchis included as another VAR source in (7).Eq.(9) shows its additive nature; it can be considered as a split objective function in place of a multi-objective one.A better perception of the objective function can be obtained from Table 1.
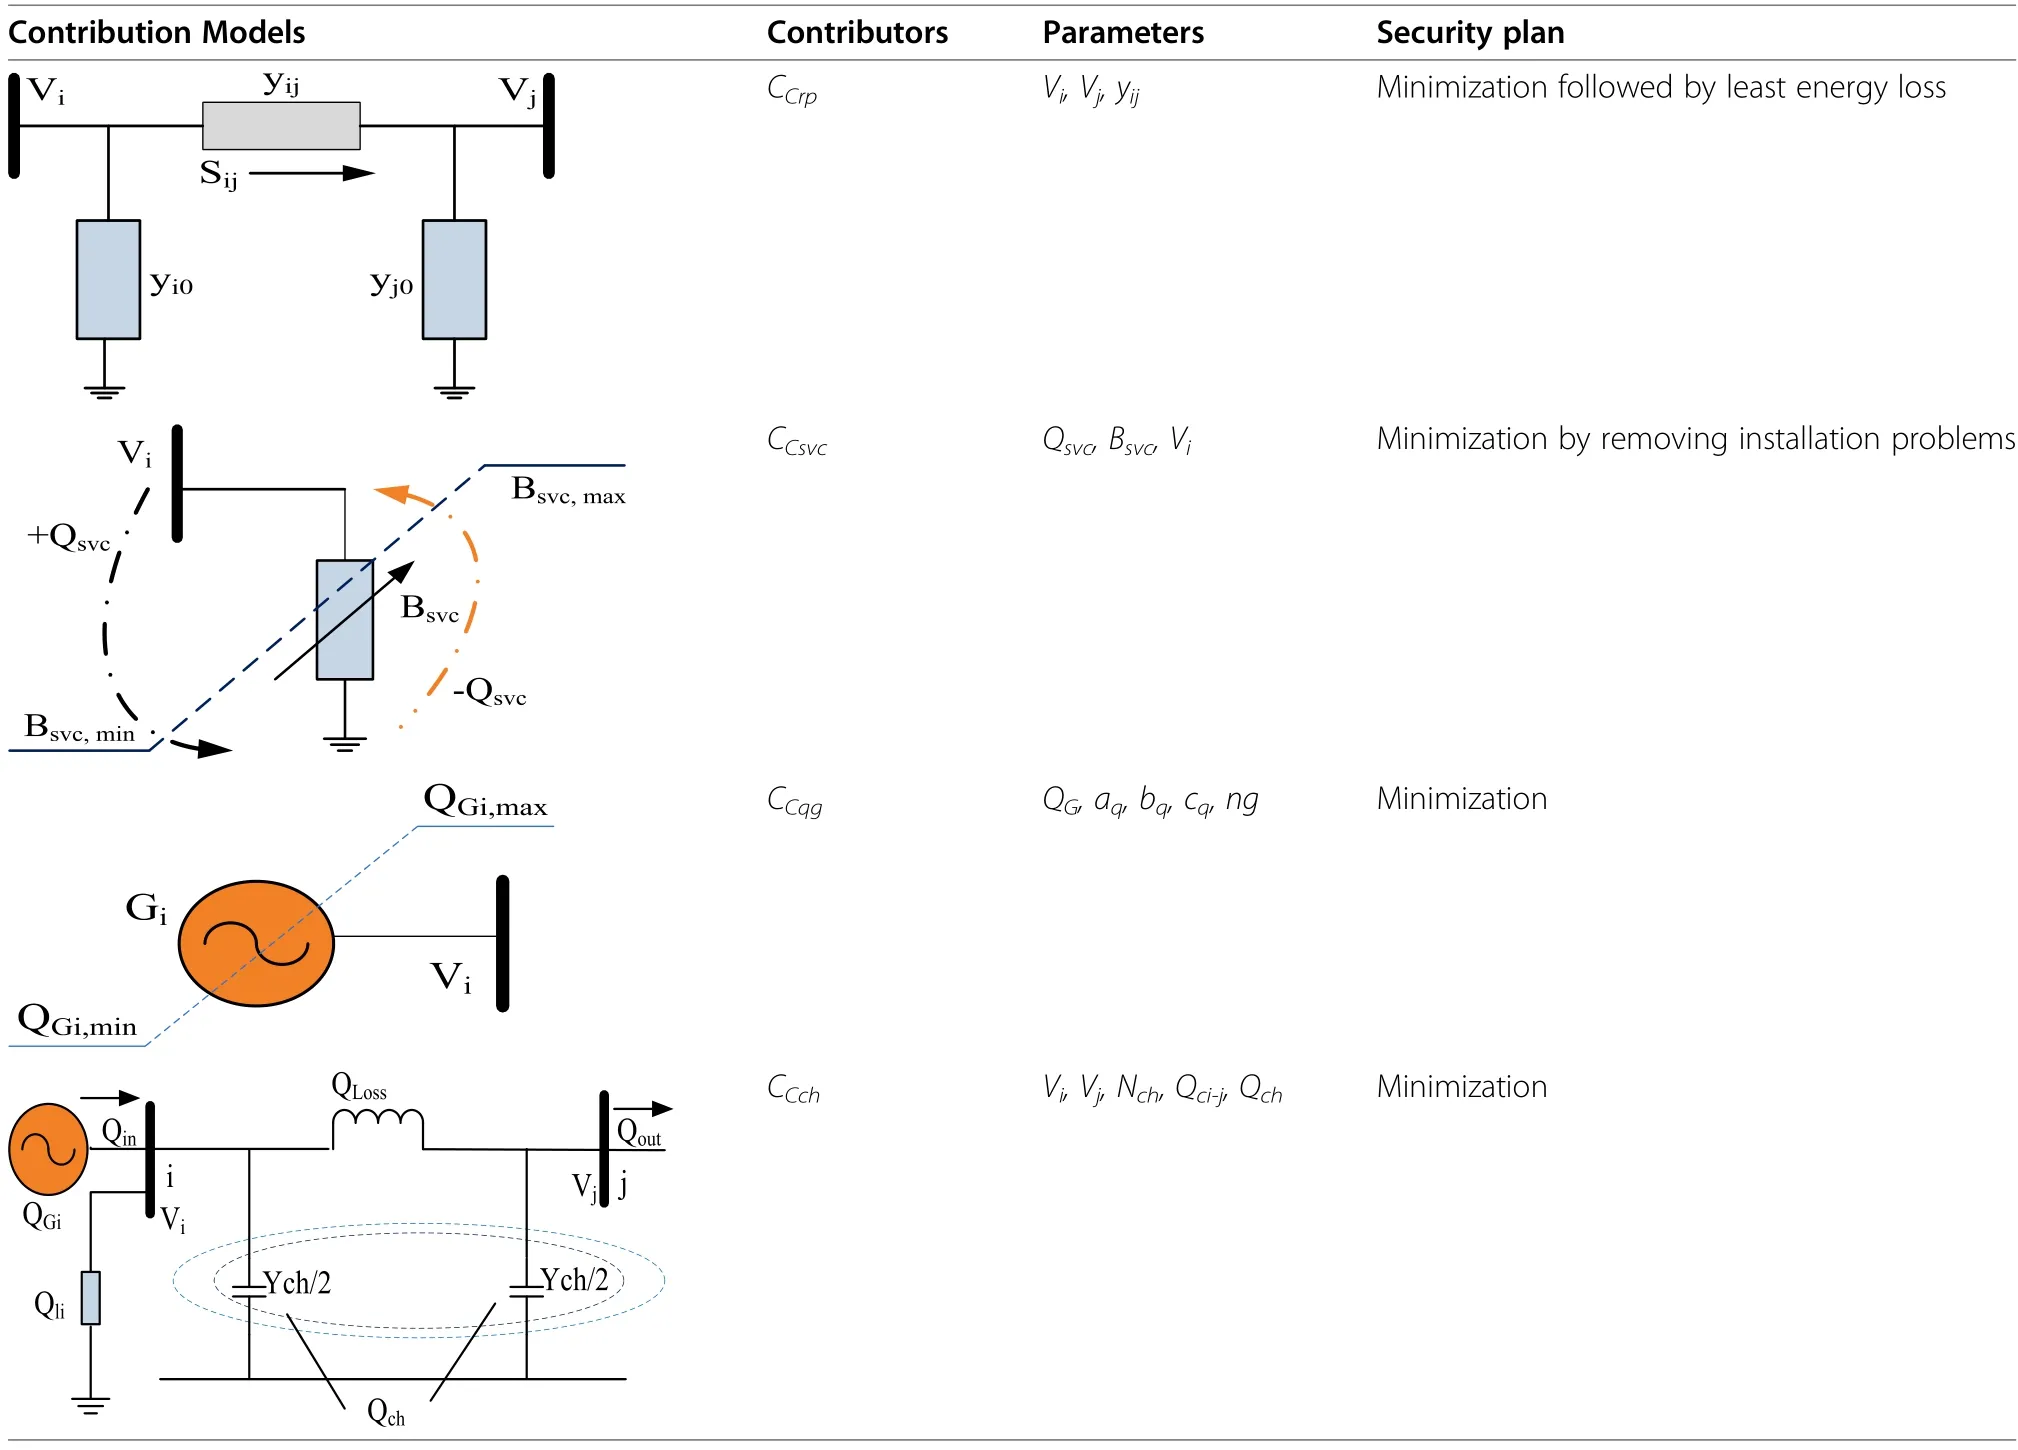
Table 1 Comprehensive representation of cost amalgamated split objective function
Usually the load flow balances in(10)and(11)are represented as the equality constraints.The inequality constraint (12) represents the upper-lower limits of voltage magnitude in all buses, while constraints (13) and (14)show the limits of VAR generation of generators and compensators respectively.The transformer tap-setting constraint is shown in(15).

3 Proposed methodology
From previous sections it is evident that RPP is difficult to solve directly.Also the problem formulation is a mixture of non-linear equations for which global optimized set of controlling parameters cannot be achieved by only implementing a conventional optimization approach.Thus, the solution of RPP is obtained by the following sub-strategies.
3.1 Detection of weak nodes
Optimal placement of VAR compensators is an important task for power system planners, both for operational and economic aspects.So this paper initially detects the weak positions for the placement of shunt compensators prior to the sizing of the devices.Three effective methods viz.loss sensitivity analysis (LSA) [26], power flow analysis (PFA) [27] and modal analysis (MA) [28]are applied for the detection of weak nodes.
3.2 Modeling of static VAR compensator (SVC)
SVC is a combination of thyristor controlled reactors and fixed capacitor banks.When connected parallel inline, the reactive current is drawn from the source and the thyristor valves add or remove shunt connected reactors and capacitors.SVC injects VAR to a bus as: Qsvci=Bsvcwhere Viis the voltage magnitude and Bsvcis the suceptance of the SVC connected at the ithbus.In this work, SVC is installed in this manner:

where nsvc and svc_value are the number of SVC units and p.u susceptance value of the SVC unit respectively.After incorporating SVC units, the bus admittance matrix (Ybus), used for load flow analysis,is reformed as:

3.3 Loadability enhancement
Since the extent of RPP is wide, in a practical situation,the power networks face different echelons of load, and several transition states may occur under different loading conditions [29].So, the aim of multi-load level RPP is to maintain a profile of minimum operating cost at minimum transmission loss without any violations of bus voltages.In this paper, loadability is formulated in terms of a single-valued scalar parameter λ, whose value is varied towards the maximum point, while the base load condition is identified when λ=1.Thereafter when the load is increased rather than for λ to increase, the generator and load bus power (active and reactive) are updated as:
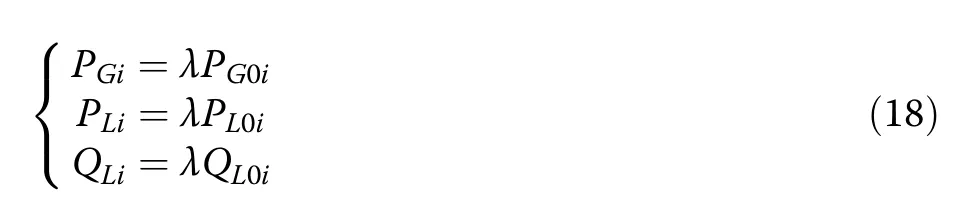
where PG0i, PL0iand QL0iare the initial (λ=1) active and reactive power at the ithbus, and their corresponding modified values are PGi, PLiand QLi.
3.4 Application of evolutionary algorithms
After addressing the technical aspects, some wellestablished evolutionary algorithms such as PSO,DE,CSA are used to search an optimal set of controlling parameters prior to solving the previously stated objective function.In this work the hybrid optimization method is adopted for the RPP problem.A unique hybridization between the crow search algorithm (CSA) and DE is simulated on a standard power system for RPP purpose.Some other algorithms are also applied to determine the optimized set of controlling parameters.In a later section,the hybridization is described briefly along with CSA and DE.
3.4.1 Reasons for designing hybridization using DE and CSA
It is known from [30] that, no single optimizer exists which is able to determine a consistent solution to all global optimization problems.Based on this concept several attempts have been made on hybridization with core algorithms (e.g., PSO, DE, GA, CSA etc.) to handle the complexity in different engineering models.In many cases it is seen that the core algorithms fail to solve the non-linear complex problems after certain limitations.Thus, it is a good practice to adapt hybrid algorithms for an optimal result.In the hybridization method exploration and exploitation characteristics can be more effective when separate algorithms work simultaneously.It has already been shown in the previous discussions that RPP is a non-linear complex problem with different constraints and thus hybridization between CSA and DE is adopted to enhance the diversification and intensification of the controlling parameters for reactive power planning purposes.The adaptability of hybridization methods in power systems in recent years is listed in Table 2.

Table 2 Different hybridization methods

Table 3 Details of benchmark-test-functions [39]
3.4.2 Traditional DE [37]
DE is technically a stochastic population based evolutionary algorithm.It uses three evolutionary operators viz.mutation, crossover and selection in a cycle towards the vicinity of an optimum individual solution from the randomly generated initial population.At initialization,a target vector(parents) Xi=(x1i, x2i,…xdi), i=1,2,..,NP is randomly generated within user-defined limits of d variables.
In Mutation, for each individual Xi, a mutate vector,Ui(t+1)=(u1i(t+1), u2i(t+1),…, udi(t+1)) is generated as:

In Crossover, DE performs a crossover operation on parent and mutate vectors and thereafter a new trial vector (offspring) Vji(t+1)is obtained as:

In Selection, the generated trial vector Vi(t+1) will be compared with the parent vector Xi(t) based on better fitness value, as:-

3.4.3 Crow search algorithm [38]


In accordance with some of the possibilities,the next position and hidden place(memory)of crow i is determined by:
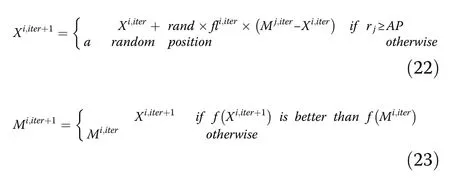
3.4.4 Hybrid DECSA
It is seen from (19) and (20) that CR and F have a great impact on DE.In other words,crossover and mutation are the dominant operators,and thus,CR and F can be varied over a certain range in searching space.Also in CSA,memories of hidden food places play an important role for new search spaces.In hybrid DECSA, after mutation and crossover of the initial population a swarm set is generated using (19), (20) and (21).This elicited swarm is used as the best memory of crows to determine the next position of the crows using(22)in a cyclic process.A pseudo code of DECSA is given in algorithm 1.The population vector of the controlling parameters related to RPP used in this paper is presented in Fig.1.


Fig.1 String representation of population vector
The numerical efficiency of DECSA is explored by solving classical benchmark functions.The details of these functions are given in Table 3 and the results of the comparison of different optimization techniques correspond to benchmark functions are shown in Table 4.A complete flow is shown in Fig.2 in section IV.

Table 4 Comparison of optimization results obtained for the benchmark functions

Fig.2 Flow chart of proposed strategy for VAR Planning
It can be concluded from the convergence graphs of benchmark functions; in Figs.3 and 4 that DECSA converges faster than DE and CSA.Also, it is an effort to measure the stability of hybrid DECSA to minimize the optimization problems.

Fig.3 Convergence characteristics of Uni-modal functions
4 Results and discussion
The proposed work is tested using MATLAB_2013a on a PC with a 3 GHz processor.The weak nodes/buses are shown in Table 4.The weak nodes/ buses for the two Indian power networks are shown in Table 5.
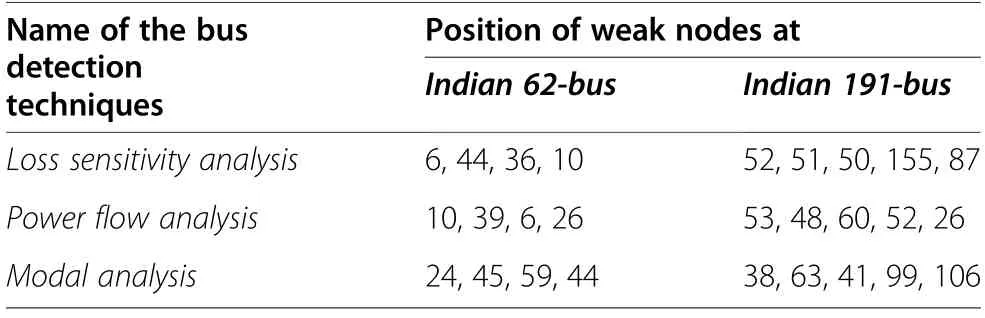
Table 5 Position of weak nodes/buses for practical power networks
4.1 System 1:Indian 62-bus network
This system is structured with 62 electrical buses, 89 lines, 18 generators and 11 OL TC.The Indian 62-bus network information obtained from the literature is shown in Table 6.

Table 6 Details of the practical test systems
Initially, PLand OCtotalare 77.62 MW and 4.0844×10⁷$without RPP.Table 7 displays the numerical values in terms of PLand OCtotalobtained from different evolutionary algorithms when the positions for SVC placement are determined by LSA, power flow analysis and MA, respectively.It is seen that hybrid DECSA and LSA co-operatively produce minimum PLand total operational cost (O.C) of 0.7057 p.u and 3.7080×10⁷$,respectively.

Table 7 Control of F and CR on DECSA for Indian 62 Bus practical system
The previous section has shown that the scaling factor F and cross-over ratio CR have a great impact on the DE algorithm.To comprehend the effect of controlling parameters, as tabulated in Table 7, on OCtotal30 individual runs are performed with 1000 iterations while these two parameters are varied from 0.1 to 0.9.From Table 7 it is seen that OCtotalreduces to 3.7080×10⁷ $ at CR=0.7 and F=0.6 while the population size is forty.
Table 8 shows the numerical values in terms of PLand OCtotalobtained from PSO, DE, DECSA etc.while buses for SVC placement are determined from previously mentioned analysis.It is observed that the minimum PLand total OC are 0.7057 p.u and 3.7080×10⁷$, respectively.From Table 9, the effect of load alteration on PLand O.C on the 62-bus system can be noted.System1 is able to transmit power up to 130% loading under the proposed arrangement.The reduction in PLis up to 9.58% and O.C 1.4916×10⁷with respect to no planning on the system.At 110%, 120% and 130% loading levels the power losses are minimized to 1.2209 p.u., 1.9605 p.u.and 3.1327 p.u respectively.After 130% loading the system collapses because of the violations of system constraints.

Table 8 Optimal performance for Indian 62-bus practical system of three different methods

Table 9 Effect of SVC allocation on Indian 62-bus system at multi-load levels

Fig.4 Convergence characteristics of Multi-modal functions
Figure 5 draws the convergence performance of the evolutionary algorithms while weak positions are decided according to LSA.From these characteristics it is seen that the objective function value converges more evenly for the DECSA based strategy than PSO, DE,CSA, PSODE and PSOCSA.

Fig.5 Convergence behavior of OC from respective algorithms
Previous studies have proved that SVC has a great impact on the transmission system.The bar graphs in Fig.6 show the relative contribution of VAR through SVC into System 1.According to the conditions of RPP, the bus voltage must lie within predefined voltage limits.Figure 7 validates the previous statement while weak bus voltages are within the dotted range.The optimal values of the controlling parameters, responsible for the RPP problem are tabulated in Table 10.It is also noteworthy, from the table that all the optimal controlling parameters are within permissible limits.

Fig.6 Amount of SVC contributions at Weak nodes
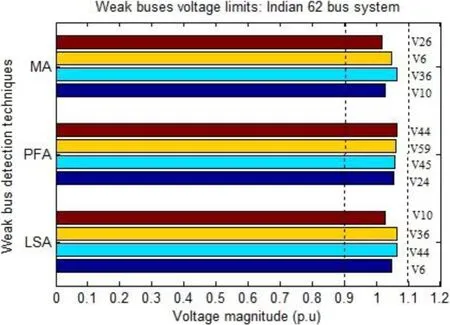
Fig.7 Weak bus voltages after RPP
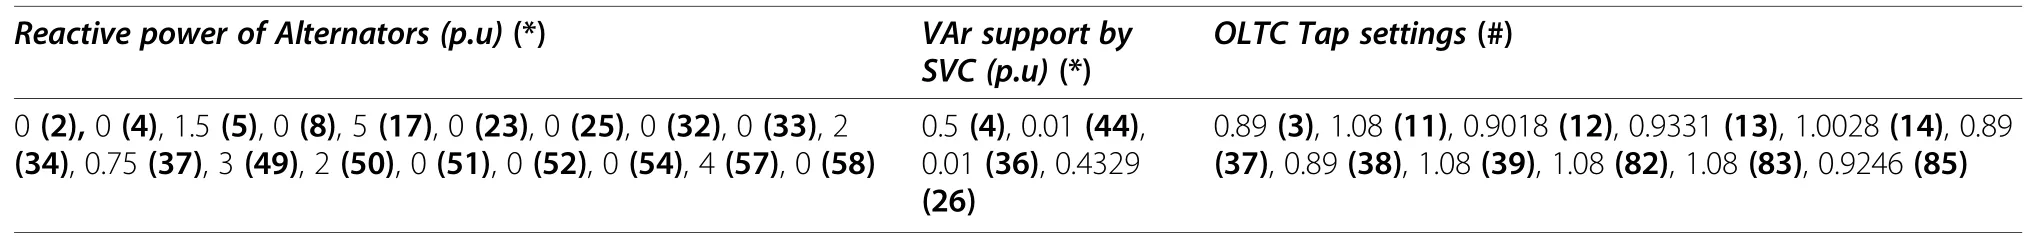
Table 10 Optimal system operating variables for System 1 with LSA and hybrid DECSA
Table 11 represents the frequency of attaining minimum loss within different ranges for System 1 from 30 independent trials.It can be seen that hybrid DECSA is the most robust of all the studied methods as it touches the minimum PL26 times out of the total 30.Figure 8 shows the bus voltages (V) after RPP at different load levels.This indicates that the voltages lie near to their permissible ranges except buses 19 and 18 (V19, V18) at 110% loading.

Table 11 Convergence recurrence of PL on Indian 62-bus system with 30 trials
4.2 System 2:Indian 191 bus network
The Indian 191-bus system is structured with 191 electrical buses, 255 lines, 19 generators, 55 OLTC,and the network information obtained from the literature is shown in Table 6.Initially, without RPP, PLand its operating cost are 93.70 MW and 4.9284×10⁷$, respectively.
Table 12 shows the influence of cross-over ratio as well as mutation factor on hybrid DECSA.It can be seen that the operating costs are changed accordingly by changing CR and F.It is found that the minimum operating is 4.673×10⁷$ at CR=0.8 and F=0.6.

Table 12 Control of F and CR on DECSA for the Indian 191-bus practical system
Methods of weak bus detection have a great impact directly on PLand system operating cost which is reflected in Table 13.Similar to System 1, loss sensitivity analysis method provides a relatively better solution than others in the case of System 2.A pictorial representation of the convergence curve of operating cost, obtained from every optimization techniques, is shown in Fig.9.The weak bus voltages shown in Fig.10 also indicate that they are all within the dotted range.

Fig.9 Convergence behavior of OC from respective algorithms in System 2
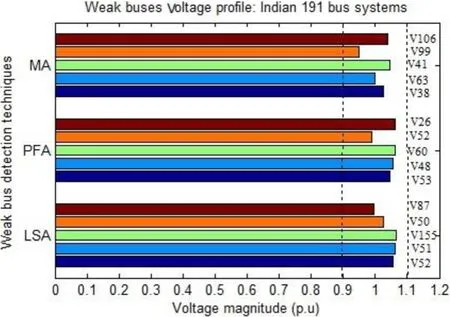
Fig.10 Weak bus voltages after RPP

Table 13 Optimal performance for Indian 191-bus practical system of three different methods
The performance of DECSA is judged over a number of trials.Table 14 shows the convergence recurrence of minimum active power loss in the case of system 2.Here different ranges of possible solutions are decided for all the algorithms.It can be seen that DECSA provides the minimum PL22 times in 30 trials.

Table 14 Convergence recurrence of PL on the Indian 191-bus system from 30 trials
Unlike System1,System 2 operates up to 110%loading in proposed planning strategy.When the load factor is increased to 110% the real power loss and O.C are 0.9603 p.u and 5.0512×10⁷$ respectively before RPP.Table 15 shows the effect of SVC positions on PLand O.C during load change.

Table 15 Comparison between SVC allocation and effects on System 2
From Fig.11, it is seen that the bus voltages are not in the pre-specified range under 110% loading.When the λ value is high the fluctuation of bus voltage is more prominent in System 2.So it can be concluded that system voltage stability is very affected by λ under this proposed approach.The list of symbols is given in appendix(7.1).

Fig.11 Bus voltage profile under different loading conditions
5 Statistical analysis of test results
To judge the robustness of the proposed algorithm subjected to RPP, the Wilcoxon signed rank test [44]is performed on a sample solution set.If probability(p-value) obtained is below 0.05, it is considered to be proper evidence against the null hypothesis.It is also well known that the robustness of any algorithm can be established if it can characterized with statistical significance by making sufficient proof against the null hypothesis.Along with maximum, minimum, average and standard deviation (std) values the p-values calculated using this test are tabulated in Table 16.

Table 16 Wilcoxon signed rank test for statistical analysis
In this paper, only the p-value of DECSA is given since it produces less operating cost with respect to the other six methods when subjected to RPP on practical networks.It is seen from Table 16 that the p-value in every system is less than the desired value of 0.05 which is in favor of statistical significance of the test results.Also, the standard deviation values for the test systems using the proposed algorithm are very low which indicates least deviation of the results in comparison to their mean values.Thus, it proves the robustness of the proposed algorithm in RPP.
Figures 12 and 13 represent the box plots of operating cost with different optimization techniques applied in the Indian 62-bus and 191-bus network respectively.These box-plots exhibit the distribution of quantitative data in a way that facilitates comparisons of OCtotalfrom PSO, DE,CSA,PSODE and PSOCSA.It can be seen that the chances of obtaining minimum operating cost is very high since the median from DECSA is closer to the lower quartile.
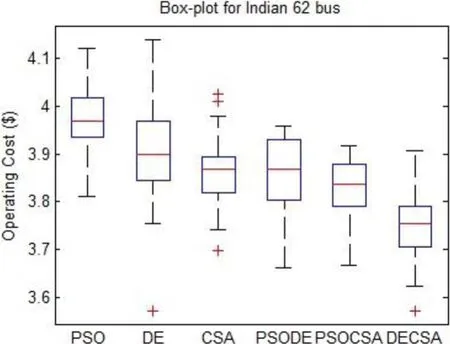
Fig.12 Box plot for the System 1

Fig.13 Box plot for the System 2
6 Conclusion
This paper proposed a multi-load level RPP on Indian power systems.On two different networks the proposed planning strategy is capable of finding the optimal solutions of the objective function.The characteristic curve of hybrid DECSA smoothly converges to the verge of the optimal front and provides a better solution of the objective function than the other five studied algorithms.The algorithm maintains the solutions in a stochastic way and prespecified ranges in the search space.All SVCs are suitably placed with the locations determined using the LSA method by removing technical and computational bottlenecks.It is also noted that the overall operating costs of both systems are significantly reduced by the proposed approach in comparison to the base case scenario.Hence, it can be concluded that the proposed approach is suited to economic power planning with technical operations.
When different loading conditions are introduced in load flow analysis for both test systems it is noted that for System1 the proposed approach yielded a significant solution for RPP whereas for System 2 it fails to provide a promising solution at higher load levels.Hence it is necessary to introduce an improved planning strategy for load adjustment.It may be solved by proper co-ordination of load flow parameters or by incorporating high performance VAR compensators to the system which may expand the horizon for future research in RPP.
7 Appendix
7.1 List of principal symbols

Load flow and cost related symbols Vi,Vj ith and jth bus voltages gk Line conductance δi ,δj ith and jth bus phase angles PGi; QGi Active and VAR generation at the ith bus PDi; QDi Active and VAR demand at the ith bus Bij,Gij Susceptance and transfer conductance Nch Line charging elements Ych Admittance of line charging Qch Total reactive power supplied during charging ng Number of PV buses nb Total number of buses p.u Per unit aq,bq,cq Generator reactive power cost co-efficient CCrp Cost due to real power loss CCsvc Cost associated with SVC CCqg VAR generation cost of alternators CCch Cost during line charging Constraints and Ybus related symbols VG Generator bus voltage VGmax Maximum limit of generator voltage VGmin Miniimum limit of generator voltage QG Generated reactive power QGmax High limit of generated reactive power QGmin Low limit of generated reactive power OLTC Open loop tap changing transformers tap Tap settings of OLTC tapmax Upper limit of tap setting tapmin Lower limit of tap settings m Number of lines ntap Number of transformers Yii Sending end admittance Yjj Receiving end admittance Vsec Transformer secondary voltage Isec Transformer secondary current Weak nodes and SVC related symbols Qsvc Total reactive power supplied by SVC Qsvcmax Maximumreactive power supplied by SVC Qsvcmin Minimum reactive power supplied by SVC nsvc Number of SVCs pop Population Bsvc Susceptance of SVCs Bsvc,max Maximum limit of Bsvc
List of principal symbols(Continued)

Bsvc,min Minimum limit of Bsvc ysvc Admittance of SVC Algorithm related symbols r1,r2 and r3 Randomly selected indices NP Number of population iter Iteration fl Flight length AP Awareness probability F Mutation constant CR Cross-over ratio
Acknowledgements
We are thankful to the Department of Electrical Engineering IIT (ISM)Dhanbad, India for providing the research facilities.
Authors’ contributions
Mr.Nihar Karmakar carried out basic design, simulation work and prepared draft paper.Dr.Biplab Bhattacharyya participated in checking simulation work, results & discussions, sequence of paper and helped to prepare the manuscript.All authors read and approved the final manuscript.
Funding
No funding to declare.
Availability of data and materials
The data that support the findings of this study are available from the corresponding author upon reasonable request.
Declarations
Competing interests
The authors declare that they have no known competing financial interests or personal relationships that could have appeared to influence the work reported in this paper.
 Protection and Control of Modern Power Systems2021年0期
- Protection and Control of Modern Power Systems的其它文章
- A comprehensive review of DC fault protection methods in HVDC transmission systems
- Application of a simplified Grey Wolf optimization technique for adaptive fuzzy PID controller design for frequency regulation of a distributed power generation system
- A critical review of the integration of renewable energy sources with various technologies
- Operational optimization of a building-level integrated energy system considering additional potential benefits of energy storage
- An integrated multi-energy flow calculation method for electricity-gas-thermal integrated energy systems
- Sliding mode controller design for frequency regulation in an interconnected power system