
High-energy x-ray diffraction study on phase transition asymmetry of plastic crystal neopentylglycol
2022-03-12 07:49ZheZhang張哲YanNaChen陳艷娜JiQi齊跡ZhaoZhang張召KojiOharaOsamiSakataZhiDongZhang張志東andBingLi李昺
Chinese Physics B 2022年3期
Zhe Zhang(張哲) Yan-Na Chen(陳艷娜) Ji Qi(齊跡) Zhao Zhang(張召)Koji Ohara Osami Sakata Zhi-Dong Zhang(張志東) and Bing Li(李昺)
1Shenyang National Laboratory(SYNL)for Materials Science,Institute of Metal Research,Chinese Academy of Sciences,Shenyang 110016,China
2School of Materials Science and Engineering,University of Science and Technology of China,Shenyang 110016,China
3Synchrotron X-ray Group,Research Center for Advanced Measurement and Characterization,National Institute for Materials Science(NIMS),Sayo,Japan
4SPring-8,Diffraction and Scattering Division,Center for Synchrotron Radiation Research Institute,Japan Synchrotron Radiation Research Institute,Sayo,Japan
Keywords: colossal barocaloric effect,plastic crystals,phase transition asymmetry
1. Introduction
Caloric materials are the systems that exhibit significant thermal effects at phase transitions induced by external fields like pressure, stress, magnetic fields,etc. They can be used as solid-state refrigeration through a designated cooling cycle. Current caloric effects refer to magnetocaloric effects in magnetic materials, electrocaloric effects in ferroelectric materials, elastocaloric materials in ferroelastic materials, and barocaloric effects (BCEs).[1-6]We emphasize that the barocaloric effects are not system-selective. In principle, one can observe BCEs in any atomic system given that pressure is always factored in the free energy of a system. For instance, BCEs have been reported in superionic AgI,[7]inorganic-organic hybrid[TPrA][Mn(dca)3],[8]natural rubber,[9,10]spin-crossover compounds,[11]antiferromagnetic Mn3GaN,[12]Ni1-xFexS,[13]and nonmagnetic NiMnTi,[14,15]
where the latter three compounds are not magnetocaloric. Recently,we have found the colossal BCEs in a series of plastic crystals, whose entropy changes are not only one magnitude of order larger than currently existing barocaloric materials,[4]but also the largest in all known caloric materials. In the prototype neopentylglycol (NPG) with the chemical formula C5H12O2, the entropy change is about 389 J·kg-1·K-1under a pressure change of 100 MPa.
The underlying phase transition is the crystal structural transition from the high-temperature face-centered-cubic(FCC) phase to the low-temperature monoclinic phase.[4,16]The neopentylglycol molecules are characteristic of a tetrahedral configuration where carbon atoms are located at the body center and corners. Hydrogen and oxygen atoms are attached to these carbon atoms. The intermolecular interactions are mainly hydrogen bonding[17]and in fact,phase transition enthalpies are found to follow a linear relation with the square of the number of hydroxyl groups per molecule in (CH3)4-xC(CH2OH)x(x= 0-4) family.[18]The molecular structure and crystal structure of the monoclinic phase are shown in Fig. 1(a).[17]A quasi-elastic neutron scattering study has revealed that the neopentylglycol molecules are subjected to isotropic rotations in the FCC phase while they are restrained after the phase transition.[4]The reorientation dynamics have also been supported by molecular dynamics simulations andab initiocalculations.[16]Here, we present a comprehensive high-energy x-ray diffraction(HEXRD)study including pair distribution function (PDF) analysis of local structures and time-resolved diffraction for the phase transition kinetics.
2. Experimental details
Polycrystalline NPG samples were used for thermal and x-ray diffraction measurements. Heat flows were recorded by using Seteram μDSC7 under applied pressures generated through compressed nitrogen gas, and the details were described elsewhere.[4]The HEXRD measurements were performed at the beamline BL04B2 of SPring-8,Japan.[19,20]The x-ray energy was fixed at 61.4 keV(wavelengthλ=0.202 °A)with an Si (220) crystal monochromator. In the experiments,the NPG powder samples were sealed in quartz capillaries with a diameter of 2 mm. At first, we collected the total scattering structure factors on NPG samples for PDF analysis by using six point-detectors arranged horizontally to obtain a 2θvalue ranging from 0.3°to 48.4°at a series of constant temperatures.[21]A furnace with a vacuum chamber was heated from 293 K to 338 K and then cooled down to 298 K.The heating/cooling rate between two constant temperatures was 1 K/min. After reaching a target temperature, the samples were kept for 10 mins at this temperature prior to acquiring data. The total structure factorSX(Q) was measured at aQrange up to 20 °A-1at a constant temperature for approximately 40 min. An empty quartz capillary was also measured for subtracting the background from the data to be analyzed.After background correction,absorption correction,and polarization correction,the resultingSX(Q)was normalized to 1 in aQrange of 15 °A-1-20 °A-1. The reduced PDF,GX(r), was calculated by the Fourier transform ofSX(Q). The total and partialGX(r)were simulated based on the average monoclinic structure by using PDFgui.[22]
Then,time-resolved HEXRD data were recorded by employing a 16-inch (1 inch=2.54 cm) digital x-ray detector (XRD 1621 CN3, PerkinElmer).[23]The detector offered an image size of 2048×2048 pixels with a pixel size of 200 μm.[23]The image integration time was at least 66.5 ms.The sample was heated and cooled in a designed furnace with a chiller. The temperature ramping rates were set to be 0.1 K/min and 1 K/min. In the present study,we used an image acquiring time of 1 s to obtain the images continuously in heating and cooling processes. Comparing with the temperature ramping rate,the image acquiring time is quite short,
where the sample is expected to be at a constant temperature.The obtained time-resolved data were reduced and visualized in Orochi Project.[24]
3. Results and discussion
3.1. Heat flow data
Heat flow data recorded at a ramping rate of 1 K/min are displayed in Fig.1(b)under constant applied pressures up to 100 MPa in steps of 5 MPa. It can be seen that there is obvious thermal hysteresis, as a practical identification of a first-order phase transition.[25-27]The phase transition interval(i.e.two-phase coexistence region)is much smaller at cooling than at heating,which is known as phase transition asymmetry.This is also a feature of a first-order phase transition and has been observed in confined FeRh,[28]VO2,[29]and V2O3.[30]The phase transition temperature defined as the peak position of heat flows is noticeably shifted toward higher temperatures,whose pressure dependence is plotted in Fig.1(c)for heating process and cooling process. The thermal hysteresis is about 17 K and is almost independent of pressure.This value is a few K larger than that observed at a ramping rate of 0.1 K/min.[4]The ramping rate dependence of thermal hysteresis is also an indication of a first-order phase transition.[26,31]
The temperature dependence of phase-transition entropy changes can be determined by integrating the heat flow data as done before.[4]Based on thein-situheat flow data with the fine pressure step,we convert the temperature dependence at constant pressure into the pressure dependence at constant temperature just above the phase transition temperature. By doing so, it is allowed to evaluate the critical pressure and saturation pressure of the phase transition. Shown in Fig.1(d)is the pressure dependence of isothermal entropy changes at 322.5,323.5,and 325 K,respectively.Taking the isotherm at 322.5 K for example,the critical pressure is found to be about 45 MPa,which is defined as the maximum value of the derivative of entropy change with respect to pressure. The saturation pressure is about 80 MPa.
3.2. HEXRD data
Shown in Fig. 2(a) is the normalizedSX(Q) at 293 K in aQrange from 0.2 °A-1to 20 °A-1, whose intensity oscillates around 1 at highQvalues. TheSX(Q) in the cooling process and heating process are plotted in Figs. 2(b) and 2(c). Since there are only two Bragg peaks visible in the hightemperature FCC phase, the phase transition is clearly distinguished by directly comparing the diffraction patterns. It can be seen that the phase transition takes place in a range of about 318 K-328 K at heating while in a range of 313 K-308 K at cooling. The phase coexistence is observed in both cases,but the interval at heating is much broader. As for the hightemperature FCC phase,there exists well-defined diffuse scattering in which the intensity oscillates around the background level as shown in the insets of Figs.2(b)and 2(c). The intensities most likely originate from the inter-molecular disorder.
The derivedGX(r) is plotted in Fig. 3(a). In a range of 1 °A-4 °A, there are three major peaks with few small shoulders resided. To distinguish the pairs, the values of partialGX(r) of major pairs are obtained by simulation through using theP21/nmodel,and the simulation results are shown in Fig.3(b). The first peak of C-C pair, located at about 1.5 °A,is associated with the distance between the corner and bodycenter of a tetrahedron, while the second one at 2.45 °A is related to the distance of the edge of the tetrahedron. As for the O-O pair, its first peak (~2.7 °A) is attributed to the intermolecular correlation whereas the second one (~3.4 °A) is the distance between two oxygen atoms within a molecule.The first three peaks of C-O pairs are all related to the intramolecular correlations. In contrast,the peak at 3.8 °A is mostly contributed by inter-molecular correlations. With the guide of partialGX(r), it is clear that the intensities ofGX(r) of intra-molecular pairs are much more susceptible to temperature change. It can be seen that the intensities ofGX(r) at about 2.7 °A and 3.8 °A are significantly reduced in the hightemperature FCC phase,which is attributed to the intermolecular disorder that leads the molecules to lose their mutual correlations.

Fig.2. (a)The SX(Q)at 293 K versus Q ranging from 0.2 °A-1 to 20 °A-1,normalized to 1 (dash line). SX(Q) at selected temperatures in (b) heating process and(c)cooling process in a Q range from 0.2 °A-1 to 10 °A-1,with insets highlighting diffuse scattering of high-temperature FCC phase.

Fig.3. (a)The GX(r)curves at selected temperatures. (b)Curves of partial GX(r)of O-O,C-O,and C-C pairs simulated in monoclinic phase.

Fig. 4. (a) Time-resolved HEXRD pattern of full cooling-heating cycle at a temperature ramping rate of 0.1 K/min and in a Q range from 1 °A-1 to 5 °A-1; (b) only cooling cycle and (c) only heating cycle at a temperature ramping rate of 0.1 K/min and in a Q range from 1 °A-1 to 3 °A-1.
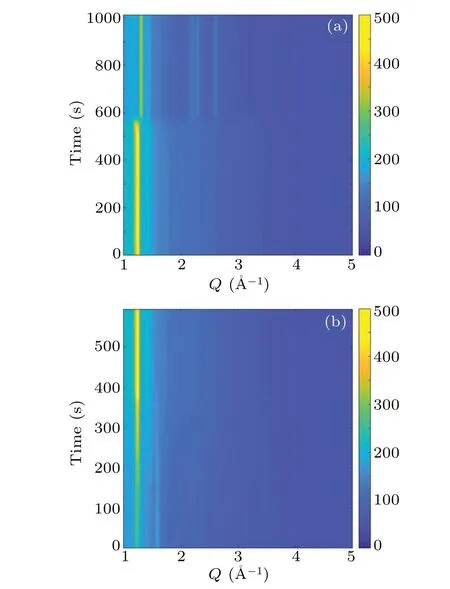
Fig. 5. Time-resolved HEXRD patterns at a temperature ramping rate of 1 K/min for(a)cooling process and(b)heating processes.
The plastic crystal phase transition of NPG is further explored by using the time-resolved HEXRD.With the fine time resolution, the transition processes can be monitored. Shown in Fig.4(a)is the contour plot of diffraction patterns during the cooling-heating cycle at a ramping rate of 0.1 K/min. In the beginning, there is a typical pattern for the high-temperature FCC phase. As cooling time reaches about 1.7×10⁴s, the phase transition abruptly takes place,where more Bragg peaks are present at higher angles and the main peaks at the lower angles are shifted. When cycle time arrives at~3.0×10⁴s,the phase transition at heating happens,as the intensity gradually increases the main peak is smoothly shifted toward lower angles. Surprisingly, the transition is considerably smooth.In Figs. 4(b) and 4(c), the details of the transition processes are highlighted. At cooling,the transition is completed within about 200 s, corresponding to a transition temperature interval of 0.33 K.In contrast,the transition at heating persists for about 1000 s,transformed into a temperature span of 1.67 K.The phase transition process is also recorded at a temperature ramping rate of 1 K·min-1as shown in Fig. 5. Similar features are observed,but the phase coexistence regions are larger than those at 0.1 K/min. When cooling,the transition is completed within about 40 s,corresponding to a transition interval of 0.7 K.In contrast,the transition at heating persists for about 300 s,transformed into a temperature span of 5 K.
3.3. Phase transition asymmetry
Both the thermal and the structural results suggest that the plastic crystal transition in NPG is quite asymmetric, that is,the transition at the cooling process is much faster than at the heating process. Moreover,the phase transition asymmetry is pressure-dependent,just as shown in Fig.6. As applied pressure increases, the phase coexistence regions are suppressed for both cooling process and heating process, whereas the interval at heating decreases faster so that the asymmetry is slightly reduced.

Fig.6. (a)Phase-coexistence intervals versus pressure at cooling and heating and(b)pressure dependence of phase transition asymmetry.
Phase transition asymmetry is observed in a series of dimension-confined materials including correlated electronic systems VO2[29]and V2O3[30]nanowires as well as metamagnetic FeRh ribbons.[28]In general,the origin of such an asymmetry has been discussed in terms of the difference between heterogeneous nucleation seeds of first-order phase transitions: point defectsversustwin walls.[28]The low-symmetry structure mimicking a higher-symmetry structure at its twin walls would facilitate the nucleation of the high-symmetry phase,whereas the transition back to the low-symmetry phase relies on the nucleation at point defects. In systems mentioned above,spin,charge,and lattice degrees of freedom are highly coupled and the delicate compromise among individual interactions may also lead to the asymmetry at a phase transition between electronic phases.[32]Especially,the temperature dependence of a gap and inherent thermal hysteresis may dominate a gapped system. At a phase transition between two magnetically ordered phases, the different magnetic correlations might be relevant to each other, just as observed in FeRh.[28]As for NPG, further studies are needed on the origin of the phase transition asymmetry issue. Based on the above discussion,two possible scenarios are present. One is the defect structure and the other is the temperature-dependent energy profile.
4. Summary
In this work, we have studied the relations of NPG to temperature,pressure,and temperature ramping rate,by usingin-situhigh-precision differential scanning calorimetry and HEXRD.The phase transition is observed inSX(Q)and also inGX(r). The phase transition asymmetry that the cooling process is much faster than the heating process is found in thermal measurement and time-resolved HEXRD measurement,which are both well consistent with each other. It is suggested that the asymmetry becomes smaller at higher pressures, but the exact origin remains unknown. Whether the asymmetry is a generic property of first-order phase transition is still an open question,which needs further studying.
Acknowledgements
The HEXRD experiments were performed at the BL04B2 of SPring-8 with the approval of the JASRI (Proposal No.2019A1249).
Project supported by the Key Research Program of Frontier Sciences, the Chinese Academy of Sciences(Grant No. ZDBS-LY-JSC002), the International Partner Program of the Chinese Academy of Sciences (Grant No. 174321KYSB20200008), and the National Natural Science Foundation of China (Grant Nos. 11934007 and 11804346).

- Chinese Physics B的其它文章
- Measurements of the 107Ag neutron capture cross sections with pulse height weighting technique at the CSNS Back-n facility
- Measuring Loschmidt echo via Floquet engineering in superconducting circuits
- Electronic structure and spin-orbit coupling in ternary transition metal chalcogenides Cu2TlX2(X =Se,Te)
- Characterization of the N-polar GaN film grown on C-plane sapphire and misoriented C-plane sapphire substrates by MOCVD
- Review on typical applications and computational optimizations based on semiclassical methods in strong-field physics
- Quantum partial least squares regression algorithm for multiple correlation problem