
On the spatio-temporal variation in b-value after 25 April 2015 Gorkha, Nepal earthquake
2022-09-05 00:55RamKrishnaTiwariHariharPaudyalDayaShanker
Geodesy and Geodynamics 2022年5期
Ram Krishna Tiwari , Harihar Paudyal , Daya Shanker
a Central Department of Physics, Tribhuvan University, Kirtipur, Kathmandu, Nepal
b Birendra Multiple Campus, Tribhuvan University, Bharatpur, Chitwan, Nepal
c Department of Earthquake Engineering, Indian Institute of Technology Roorkee, Roorkee, Uttarakhand, India
Keywords:Frequency-magnitude distribution Time series analysis Thrust fault Stress Central Himalaya
ABSTRACT In the present study,the spatial-temporal distribution of b-value along the five faults area(the Judi fault,Thaple fault,Kathmandu fault,Motihari-GauriShanker fault,and Motihari-Everest fault)was investigated after the Gorkha earthquake (MW7.8). The earthquake catalog of 10,500 events was prepared by compiling the published catalogs.The study area is bounded in the central Himalaya from 26.5° to 29° in latitude direction and 84° to 87° in longitude direction.The frequency magnitude distribution shows the variation of the b-value along with fault areas from 0.45 to 0.69, indicating a common characteristic of aftershock sequences. In particular, the Judi fault area, Thaple fault area,and Motihari-Everest fault area are characterized by the low b-values of 0.45 ± 0.02, 0.48 ± 0.02, and 0.55 ± 0.04, respectively. These regions could be the source region for future earthquakes. The low b-value observed for fault areas are also consistent with the thrust faulting pattern in the region as indicated by the focal mechanism of mainshock and major aftershocks.The temporal variation of b-value shows inevitable fluctuations during 25 April to 12 May 2015. Among the area selected, the Motihari-Everest fault area is in critical strain(mechanically locked) conditions, as indicated by the stepwise energy release pattern.
1. Introduction
Nepal has a long history of devastating earthquakes because of its location in an earthquake-prone plate tectonic zone.Two major earthquakes that occurred in the last 200 years are the 26 August 1833 earthquake (VII-IX in Modified Mercalli Intensities scale) [1]and the tremendous Nepal-Bihar earthquake(MW8.1)on 15 January 1934. The epicenter of the 1934 earthquake was 9.5 km south of Mount Everest[2].Recently the nation was struck by an earthquake of moment magnitude MW7.8 or local magnitude 7.6 on 25 April 2015 at 06:11:26 UTC [3]. The epicenter of this event was in the Nepal-Bihar seismic gap,located 36 km east of Khudi,Nepal,about 80 km northwest of Kathmandu [4]. The Gorkha earthquake was the largest in Nepal after the 1934 Bihar-Nepal Earthquake[5].The main event broke the Main Himalayan Thrust(MHT) locked lower section from west to east and left the locked upper section unbroken [6-8]. The event killed nearly 9000 people, and many thousands more were injured.It destroyed or damaged more than 600,000 structures in Kathmandu and nearby towns[9].
Following the main shock,the series of moderate to strong aftershocks are recorded,including the two largest aftershocks ML6.0 and ML6.7 on the same day within 35 min of the mainshock.On 26 April the second-largest aftershock of ML6.9 was registered while the strongest and severely damaging one(ML7.0)was noticed on 12 May 2015 which further ruptured the eastern end of the rupture zone.The rupturing process left a small gap unbroken between the mainshock andaftershock slipzones[10].After 30minof thisevent,anotherlarge aftershock MW6.3 was registered[11-13].The aftershock sequences are concentrated in a narrow band of width 40 km at mid-crustal to shallow depths(i.e.,within the range of 2-25 km)along the strike of the southern slope of the high Himalayan range [3]. From the prepared dataset,it can be noticed that the most of the aftershocks were spread over an area of about 222 km × 111 km, with an increasing concentration towards the east of the mainshock (Fig.1). These aftershocks caused further loss of life and infrastructures in the northern part of central Nepal.
2. Tectonic process and earthquake
The mechanism behind these Himalayan earthquakes is governed by the northward thrusting of the Indian plate below the overriding Eurasian plate.This long tectonic process dating back to 61 Ma [14] maintains the height of the Himalayas mountains and causes large earthquakes that can exceed magnitude 8 [15]. From the south to the north, the major faults of the Himalayas are the Main Frontal Thrust (MFT), Main Boundary Thrust (MBT), Main Central thrust(MCT),South Tibetan detachment system(STD),and the Indus-Tsangpo suture zone (ITSZ) [16,17]. The source region of the Gorkha event is the Main Himalayan Thrust(MHT)fault which is the most active structure running along the Himalayan arc. The MHT reaches the surface as MFT and absorbs about 20 mm per year of the India-Eurasia convergence in Nepal [8,18]. The coseismic rupture of the Gorkha earthquake has been controlled by the local heterogeneity in the stress/strain regime [19]. Transversal structures have controlled the rupture propagation during the earthquake.The Judi fault is the western boundary of the central rupture zone, while the eastern boundary is the Gaurishankar fault separating the 25 April 2015 rupture from the 12 May 2015 rupture[20].The well-marked concentration of these aftershocks (Fig. 1) near MHT could activate the Judi fault, Thaple fault, Kathmandu fault,Motihari-GauriShanker fault, and Motihari-Everest fault [21]. This study selected the fault that started in the footwall of the MHT and extending up to the hanging wall (i.e., from the Judi fault on the western boundary to the Motihari-Everest fault on the eastern boundary), to investigate the spatio-temporal variation of aftershocks sequences of the Gorkha earthquake in the central Himalaya.

Fig. 1. Seismotectonic map showing the 10,500 earthquake events (ML ≥2.0) along with the major faults MCT, MBT, MFT, and STD.From the historical period to date, the red stars represent seven major earthquakes in the region. The yellow stars are the mainshock (ML7.6) and major aftershock (ML7.0) of the Gorkha earthquake sequences.The dashed black lines represent the Judi fault, Thaple fault, Kathmandu fault,Motihari-GauriShanker fault, and Motihari-Everest fault [22,23].
3. Frequency magnitude distribution
Numerous workers have suggested the b-value of the frequency magnitude distribution as an earthquake precursor [24-26]. The frequency magnitude distribution equation [27] describes the number of earthquakes that occurred in the region as a function of their magnitude M as:

In the relation,N is the cumulative number of earthquakes with a magnitude greater than equal to M,while the parameter a and b are real constants with a spatial-temporal variation.The constant a characterizes the seismicity of the region. The high value of a corresponds to high seismicity and vice versa. The other constant bvalue has the potential to describe the relative number of minor to major earthquakes in the given area.The stable b-value is reported to be 1,but values ranging from 0.3 to 2.5 have also been mentioned in the kinds of literature [28-31]. The variation in the b-value is suggested to depend on tectonic characteristics and focal mechanisms.It takes a small value for a thrust faulting earthquake than a normal faulting earthquake and an intermediary value for strikeslip earthquakes [32-34]. In addition, parameter b is thought to depend on the stress regime as well as the tectonic character of the region[35,36].Moreover,the creeping nature of faults is associated with high b-values, while asperities type faults are reported to be described by peculiarly low b-values[34,37].The b-value increases when the asperities present in the region get isolated, and when the asperities become more organized,its value decreases[38].The b-value as a function of depth has also been studied[39]and found that the b-value decreases down to depth. Following the Gorkha earthquake, many investigators have studied the change in frequency magnitude distribution of earthquakes (b-value) in the central Himalayan region.The investigators [3]noticed that the bvalue (0.80 ± 0.05) lesser than the normal b-value of 1.0 observed worldwide after the major earthquake. The b-value (0.92) was noticed for around 3 months of data from April 25,2015,to July 31 2015, documented at the National Seismological Centre (NSC)network [11]. The findings [40] conclude that the triggering of aftershocks around the mainshock was delayed, and expansion occurred towards the eastern end near the Kodari earthquake(major aftershock).The previous finding[41]showed that b-values in the eastern zone are lower than that in the source region of the 25 April 2015 earthquake,inferring high-stress buildup.This might indicate the high probability of occurrence of a large earthquake,particularly in the eastern zone. This work examines the spatiotemporal variation of the b-value in the previously mentioned faults in the region after the Gorkha earthquake of 2015.
4. Data and methodology
The catalog in this study is prepared from the two different datasets containing well-located earthquakes. The first one is the bulletin of the permanent National Seismological Centre (NSC)network[3]and the second is a well-resolved aftershock catalog for the 2015 Gorkha earthquake detected by the NAMASTE temporary seismic network that is densely distributed over the rupture area[42].We got 15,275 earthquake events from the above sources.The magnitude of completeness (Mc) is calculated by the maximum curvature technique [43], and it was estimated to be ML2.0. The final dataset contains 10,500 earthquakes of magnitude ≥2.0 ML(Local-scale)from 2015.4.25 to 2016.5.14 within the study area.The b-value for the total dataset was found to be 0.61 ± 0.01 (Fig. 2).
To investigate the variation of b-values along the aforementioned faults, an area of fixed-width 20 km and variable-length from south to north is considered and analysis is carried out by the software package ZMAP [44]. We computed the maximum likelihood of b-values using the equation (2) [45,46].


where nsis the total number of events in the sample window,and δb is actual standard deviation of b-value. For the time series analysis of b-value, the window size of 200 was taken with the minimum number of events 50 and a window overlap of 4%,while for the b-value cross-section study,a minimum number of nearest events was taken 50 and the minimum number of events >Mcper node was taken 50. Similarly, for b-value variation with depth number of events in each window is taken at 150 with an overlap factor of 5.
4.1. b-value variation along the Judi fault
The cross-section along the Judi fault (84.30°E, 27.72°N and 85.10°E, 28.50°N) bounded by the length 117.0 km and width of 20 km is considered for the study.
From the log-linear frequency-magnitude plot of the Gutenberg-Richter distributions, the b-value is estimated as 0.45±0.02 for this area(Fig.3a).The b-value is the slope of the red line obtained from the linear regression of the observed events with Mc≥2.0.It is the significantly low value of b comparing to the remaining four areas selected for the study.The temporal variation of the b-values is depicted by the Fig. 3b, where the b-values are represented by a solid line, and the standard deviation is represented as dashed lines.The b-value was noticed 0.76 on 12 August 2015 and 0.67 on 18 August 2015.It shows a sharp rise,fall within a week,and settles within the range 0.75-0.8 after September 2015.The depth variation of b-value shows the lowest value below the depth of 10 km, which could be the indication that the stress was most concentrated near this depth(Fig.3c).The recurrent existence of earthquakes is at depth <12 km and within this depth the bvalue changes from ~0.27 to 0.33.The cumulative moment release curve (Fig. 3d) shows the large amount of strained energy gets released from this area.It rises sharply from 2.82×10²⁰Nm on 25 April 2015 to 2.97 × 10²⁰Nm on 2 May 2015 indicating the quick release of the energy.

Fig. 3. Graphs representing b-value variation for the area along Judi fault. (a), (b), (c)and (d) depict frequency magnitude distribution (FMD), b-value variation with time, b-value variation with depth, and temporal variation of cumulative seismic moment release for the area.
4.2. b-value variation along the Thaple fault
The area along the Thaple fault (84.64°E, 27.58°N and 87.15°E,29.55°N) bounded by the length 328.6 km and width of 20 km is considered for the study.
A log-linear frequency-magnitude plot for the Gutenberg-Richter distributions gives the b-valueof0.48±0.02(Fig.4a).Itisestimatedas the slope of the red line obtained from the linear regression of the observed events for (Mc≥2.0). The b-value estimated is again significantly low. In the temporal variation of the b-values plot(Fig.4b),the b-values are represented by a solid line,and the standard deviation is represented as dashed lines.The b-value shows roughly cyclic variation with a maximum value of 0.97 on 1 September 2015.The b-valuewas smallest(around 0.23)at a depth of 10 km,indicating that the stress was accumulated around this depth. It was around 0.39 at a depth of around 13 km (Fig. 4c). The cumulative moment curve(Fig.4d)for this area shows a significant rise to 1.37×10¹⁸Nm on 1 May 2015,and after that,it shows a gradual increase.
4.3. b-value variation along the Kathmandu fault
The area selected along the Kathmandu fault (85.14°E, 27.14°N and 86.0°E, 28.05°N) is bounded by a length of 130.9 km and a width of 20 km.
A log-linear frequency-magnitude plot for the Gutenberg-Richter distributions is depicted in Fig.5a.The slope of the red line obtained for the linear regression of the events(Mc≥2.0)gives the b-value as 0.64 ± 0.01. The estimated b-value is low compared to the average value of 1.0.The temporal variation of the b-values is revealed by the plot(Fig.5b),where the b-values are represented by a solid line,and the standard deviation is represented as dashed lines. The b-value shows roughly cyclic variation with decreasing trend and the lowest value was observed as 0.55 on 29 January 2015 and the highest bvalue1.10 on 7June2015.The b-valuewassmallest(<0.2)ata depthof 10 km, so the concentration of the stress is near this depth for this region.It was around0.38 ata depthof 15 km(Fig.5c).The cumulative moment release curve(Fig.5d)for this area shows a significant rise from 0.398×10¹⁸Nm to 4.07×10¹⁸Nm within the period of 25 April 2015 to 12 May 2015,and thereafter it shows a very small increment.
4.4. b-value variation along the Motihari-GauriShanker fault
To study the b-value variation for the area along the Motihari-GauriShanker fault (84.82°E, 26.67°N and 86.83°E, 28.58°N), we considered the area bounded by the length 289.3 km and width of 20 km.

Fig. 4. Graphs representing b-value variation for the area along the Thaple fault. (a), (b), (c) and (d) depict frequency magnitude distribution (FMD), b-value variation with time,b-value variation with depth, and temporal variation of cumulative seismic moment release for the area.

Fig.5. Graphs representing b-value variation for the area along the Kathmandu fault.(a),(b),(c)and(d)depict the frequency magnitude distribution(FMD),b-value variation with time, b-value variation with depth, and temporal variation of cumulative seismic moment release.
For the area considered,the b-value(0.69±0.02)is estimated as the slope of the red line in the Gutenberg-Richter frequency magnitude distribution.It is estimated from the linear regression of the observed events with Mc≥2.0 (Fig. 6a). In the temporal variation of the b-values plot(Fig.6b),the b-values are represented by a solid line, and the standard deviation is represented as dashed lines.The sharp fluctuation in b-value from 0.42 to 1.22 was noticed from 22 June 2015 to 22 July 2015. After July 2015, a gradual decrease in b-value was noticed. The b-value is smallest (around 0.2) at a depth of 10 km, and its variation is from 0.3 to 0.55 between 10 km and 17 km.The results indicate a concentration of the stress within this depth (Fig. 6c). The cumulative moment curve(Fig.6d)shows a sharp rise of energy up to 2.63×10¹⁹Nm within a single day(25 April 2015-26 April 2015).Thus,there is a release of a massive amount of energy in a noticeably short time interval.This may be the cause behind the occurrences of many aftershocks in a noticeably short time.
4.5. b-value variation along the Motihari-Everest fault
For this fault, the area covered by the length of 341.0 km and width of 20 km bounded by the geographical points 84.92°E,26.55°N and 87.69°E, 28.41°N is considered for the study.
From the log-linear frequency-magnitude plot of the Gutenberg-Richter distributions, the b-value (0.55 ± 0.04) is estimated(Fig.7a).The b-value is the slope of the red line obtained for the linear regression line of the observed events with Mc≥2.0.For this area, the b-value obtained is very low compared to the global average value of 1.0.Fig.7b shows the temporal variation of the bvalues where a solid line represents the b-values,and the standard deviation is represented as dashed lines. The b-value shows rapid fluctuations from 0.74 to 0.67 within one week(7 September 2015 to 14 September 2015),thereafter it settles around 0.7.The b-value was the smallest (around 0.303) at a depth of ~7 km (Fig. 7c). The cumulative moment release curve (Fig. 7d) shows that the release of strain energy is not sharp but in a stepwise process.The energy released was 2.51×10¹⁶Nm on 12 May 2015.It was 2.94×10¹⁶Nm on 23 May 2015, 3.57 × 10¹⁶Nm on 16 September 2015, and 3.93×10¹⁶Nm on 3 December 2015.This stepwise energy release process indicates that seismogenic sources are mechanically locked, and earthquakes occurrence is random to time due to frictional and mechanical reasons.
5. Focal mechanism of Gorkha earthquake and its major aftershocks
The CMT solution for the mainshock (ML7.6) of 25 April 2015 given by Global-CMT[48,49]shows a predominantly thrust fault on a shallow N-E dipping plane(Fig.8).The propagation of rupture is eastward and is consistent with Main Frontal Thrust [50,51]. The aftershock(ML6.7)on the same day shows a similar mechanism to the mainshock with a small oblique component on it. Another aftershock of ML5.7 had a normal fault mechanism with the eastwest orientation of nodal planes, which could be interpreted as an extension after the mainshock. The ML6.0 event showed a normal fault mechanism with a strong oblique component on the same day. The two aftershocks (ML6.9 and ML5.8) of 26 April originated on the eastern edge of the main rupture, also showed a predominant fault mechanism initiated by severe compressive stresses. The fault planes for those earthquakes are low angled,which results in a significant horizontal movement. The ML6.9 event had a close match with the dip of the mainshock.On 12 May 2015,ML7.0 event originated on the eastern end of the mainshock,having the characteristic of the shallow northeast dipping thrust fault.The ML6.3 aftershock of the same day and ML5.5 aftershock of 16 May show similar thrust mechanisms with small oblique components.

Fig. 6. Graphs representing b-value variation for the area along the Motihari-GauriShanker fault. (a), (b), (c) and (d) depict frequency magnitude distribution (FMD), b-value variation with time, b-value variation with depth, and temporal variation of cumulative seismic moment release.
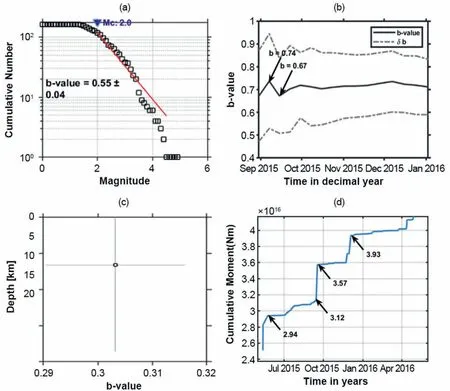
Fig.7. Graphs representing b-value variation for the area along the Motihari-Everest fault.(a),(b),(c)and(d)depict frequency magnitude distribution(FMD),b-value variation with time, b-value variation with depth, and temporal variation of cumulative seismic moment release.

Fig. 8. Focal mechanism of mainshock and major aftershocks where color of the stars indicate the depth of the earthquakes.
6. Discussion
The b-values reported for the faults (0.45-0.69) from the frequency magnitude plot are remarkably low compared to the global average value of 1.0 as accepted for the aftershock sequences.These low b-values are also associated with the thrust faulting [52] and may correspond with a strong and homogeneous stress field or asperities [34,37]. The low b-values for the Judi fault (0.45 ± 0.02)and Motihari-Everest fault(0.55±0.4)suggest that the stress level in this area is relatively high that may have a high potentiality of causing a possible moderate or larger event[53].The strain energy released in the area along the Judi fault is 1020Nm, which is the largest value,while the energy released along the Motihari-Everest fault is 1016Nm, which is the lowest value. The quick-release of strain energy for the Judi fault, Thaple fault, Katmandu fault, and Motihari-GauriShanker fault show how events occur in those areas.The results of this work can be compared with the preceding works.The study carried out by researchers [54] reported the b-value(0.75 ± 0.03) for the aftershock sequences of the 25 April earthquakes. In the other study [55] b-value was estimated as 0.93 for the aftershock sequences of the Gorkha earthquake. In the study[56], the b-value (0.78 ± 0.08) was computed for aftershock sequences after the Kodari earthquake (major aftershock). The estimated b-values in this work are low compared with earlier works for the region. This may be because of the abundant number of small magnitude earthquakes in the dataset.
7. Conclusion
In this paper,the spatial and temporal distribution of b-value for areas along the aforementioned five faults was studied to understand how the b-value distribution occurs after a major earthquake.From frequency magnitude distribution, variation of the b-value along the selected areas was reported from 0.45 to 0.69, which is accepted for the aftershock sequences. These low b-values regions have a low degree of heterogeneity of the materials, and they experience high stress and are associated with large faults. The results may reflect that the underlying crust bears the fracture of the firmly locked segment and the accumulated stress in the region is released through many small earthquakes. These significantly low b-values are also related to thrust faulting in the region as supported by the focal mechanism of the mainshock and the aftershocks. The Gorkha earthquake occurred on a low-angle fault plane and the thrust fault movements with more or less similar geodynamics may be the cause of its origin. The results from the temporal variation of the cumulative moment showed that the higher strain energy was released quickly in the area along the Judi fault and lower strain energy was released in a stepwise pattern in the area along the Motihari-Everest fault.The temporal variation of the b-value shows a specific rise in the b-value after the Gorkha earthquake.This study,which was based on the progression of the b-value and focal mechanism, might be helpful in understanding the rupture extent and stress changes after the Gorkha earthquake in the central Himalayan region.
Conflicts of interest
The authors declare that there is no conflicts of interest.
Acknowledgments
One of the authors RKT would like to acknowledge Tribhuvan University, Nepal for providing sabbatical leave and University Grants Commission(UGC),Nepal for providing financial support in the form of fellowship. We would also like to acknowledge three anonymous reviewers for their suggestions for the improvement of the quality of the manuscript.
 Geodesy and Geodynamics2022年5期
- Geodesy and Geodynamics的其它文章
- Revisiting the period and quality factor of the Chandler wobble and its possible geomagnetic jerk excitation
- Bathymetry inversion using the deflection of the vertical:A case study in South China Sea
- Three-dimensional gravity inversion based on optimization processing from edge detection
- The Doppler effect induced by earthquakes: A case study of the Wenchuan MS8.0 earthquake
- Impact assessment of the seasonal hydrological loading on geodetic movement and seismicity in Nepal Himalaya using GRACE and GNSS measurements
- Delineation of sensitive coastal zone of northern Ramanathapuram coast, Tamilnadu, India, using a GIS approach