
Effect of the codoping of N–H–O on the growth characteristics and defects of diamonds under high temperature and high pressure
2022-10-26 09:47ZhenghaoCai蔡正浩BoweiLi李博維LiangchaoChen陳良超ZhiwenWang王志文ShuaiFang房帥YongkuiWang王永奎HonganMa馬紅安andXiaopengJia賈曉鵬
Chinese Physics B 2022年10期
Zhenghao Cai(蔡正浩) Bowei Li(李博維) Liangchao Chen(陳良超) Zhiwen Wang(王志文) Shuai Fang(房帥)Yongkui Wang(王永奎) Hongan Ma(馬紅安) and Xiaopeng Jia(賈曉鵬)
1State Key Laboratory of Superhard Materials,College of Physics,Jilin University,Changchun 130012,China
2Key Laboratory of Material Physics of Ministry of Education,School of Physics and Microelectronics,Zhengzhou University,Zhengzhou 450052,China
Keywords: HPHT,N–H–O codoping,synthetic diamond,nitrogen concentration,defects in diamond
1. Introduction
For thousands of years, only three kinds of pure C have been known to mankind: diamonds,[1]amorphous C, and graphite. Diamonds are extremely important functional materials with maximum Mohs hardness,ultrahigh thermal conductivity, wide light transmission band, ultrawide forbidden bandwidth, and acid and alkali corrosion resistance that are due to their sp3hybrid structure,short bonds,and the tetrahedral arrangement of C atoms in their lattices. They are often used in equipment for processing materials with high hardness,semiconductor lasers,and high-power lasers.
Industrial diamond production is realized through the high-temperature and high-pressure(HPHT)method to break through the restrictions placed by the price and output of natural diamonds on their wide application.However,the origin of natural diamonds remains unclear.[2]A large number of studies have analyzed diamond deposits distributed worldwide,providing important information on the temperature and pressure conditions needed for diamond formation and growth.[3]Diamonds,a metasomatic mineral,are formed during the migration of fluids and melts in the craton mantle.[4]The composition of the environment for the formation of natural diamonds is a perennial basic hot issue in the field of diamond research.N,Si,Al,Ca,Mg,and Mn have been confirmed to be common impurities in natural diamonds. However, transition metals, such as Fe, Ni, Co, Mn, and related substances, have been found in some ultra-deep diamonds. H, methane, and water have been found to exist in the form of fluid inclusions in part of natural diamonds.[5–10]Initially, researchers agreed that the molten fluid containing C–H–O is of great significance to the formation of natural diamonds.[11]Fourier transform infrared spectroscopy (FTIR) and x-ray photoelectron spectroscopy(XPS)revealed that in diamonds,N is also an important impurity that cannot be ignored. N atoms can replace C atoms in the diamond lattice or exist in the diamond lattice in the form of isolated or atomic pairs,which are of great importance for the color and properties of diamonds.[1,12–14]Therefore, C–N–H–O fluid has an important role in the growth of natural diamonds.
Diamonds contain structural defects and impurity atoms;under certain conditions, the combinations of impurities and defects form color centers with different structures.[15,16]The types and contents of impurity elements,as well as the types of color centers, obviously differ between synthetic and natural diamonds.[17]Presently,the most studied color center is the N vacancy(NV)and Si vacancy.[18]Many complex color centers related to Ni–N impurities have also been studied,such as Ni–N centers(NE[1–8]).[13,19–21]Color centers not only have an important role in distinguishing natural diamonds from synthetic diamonds, but they also possess important application prospects in quantum information processing,spintronics,and high-sensitivity electromagnetics.[22]For example,some studies have shown that NV color centers with negative charges have a special spin triplet state. Therefore,the NV color centers can be initialized,coherently manipulated with long phase interference times,and read out by using optical means.A single NV color center can realize high-sensitivity nanoscale and macroscopic physical quantity detection.[22,23]Integrated optics based on diamonds are being developed rapidly with the help of NV color centers and will become increasingly widely used and investigated in the future.[24]
In this study, N–H–O codoped diamonds were synthesized through the HPHT method in a C–H–N–O doping system. The regular changes in diamond growth conditions and crystal surface morphology with the change in the N–H–O content of the synthesis system were investigated. FTIR and Raman spectroscopy were used to characterize the structural composition of diamonds and the changes in the types and contents of impurities in diamond crystals. Photoluminescence (PL) spectroscopy was utilized to characterize the luminescent properties and color center of the crystals. Investigating the growth of diamonds in C–H–N–O fluid provides important information for deepening our understanding of the growth characteristics of diamonds in complex systems and the formation mechanism of natural diamonds. At the same time, it provides a method and reference for the study of the generation and control of defects in diamonds,which are valuable for the practical application of diamonds.
2. Synthesis and measurement
2.1. Synthesis
Diamond crystal synthesis was performed by using a domestic high-voltage equipment with six sides(SPD-6×1200).The experimental assembly is shown in Fig. 1. The diameter of the synthesis chamber is 14 mm. In all experiments,99.99 wt.% high-purity graphite was used as the C source,and nicotinic acid (C6H6N2O) was used as the additive (purity>99.5 wt.%)at the addition levels of 0.1 wt.%,0.2 wt.%,and 0.8 wt.%. The{111}crystal plane of the 1 mm seed crystal was taken as the initial growth crystal plane. The weighed C6H6N2O and high-purity graphite were uniformly mixed and pressed into a columnar C source for later use. Diamond crystals were grown through the temperature gradient method,and the temperature of the synthesis chamber was calibrated by using a type b Pt–Rh thermocouple(Pt–Rh30%/Pt–Rh6%). After the experiment,the obtained crystals were treated with hot concentrated sulfuric acid and concentrated nitric acid at the volume ratio of 3:1 to recover impurities outside the crystals.
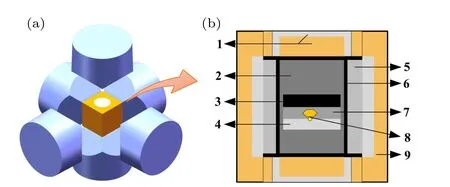
Fig.1. Diamond sample assembly under HPHT conditions: 1: steel cap; 2:ZrO2+MgO insulating material;3: C source;4: seed bed;5: NaCl+ZrO2 sleeve; 6: graphite heater; 7: Fe–Ni alloy catalyst; 8: seed crystal and synthesized diamond;9: pyrophyllite and dolomite composite block.
2.2. Measurements
The diamond crystals were characterized by using an optical microscope (OM), a scanning electron microscope(SEM),FTIR,Raman spectroscopy(Raman),and XPS.FTIR was performed using a VERTEX 70V vacuum micro-Fourier infrared spectrometer over the range of 800 cm-1–4000 cm-1with a spectral resolution of more than 0.4 cm-1. The spectral range was continuously adjustable. The Raman test was conducted using a Renishaw inVia Raman spectrometer at room temperature. The laser wavelength of the Raman test was 488 nm, the spectral range was 300 cm-1–4000 cm-1, and the spectral resolution exceeded 1 cm-1. The PL spectra were collected at room temperature, and the wavelength of the excitation laser was 488 nm.
3. Results and discussion
3.1. Morphological characterization of diamond crystals grown with different doping ratios of N–H–O
Different proportions of C6H5NO2(Xirefers to the doping percentage in mass percentage) were doped into the C source, and Ib-type diamond crystals were synthesized at 5.8 GPa–7.1 GPa and 1370°C–1480°C. Table 1 summarizes the C source conversion conditions and crystal morphology. The OM photograph (Fig. 2) shows that under the undoped condition, the diamond single crystal synthesized by C6H5NO2is bright yellow and the main crystal plane types are{111}and{100}. When the doping ratioXiis gradually increased, the yellow color of the diamond crystal gradually deepens and finally turns green. WhenXi=1.2%, the synthesized crystal gradually changes from a bright yellow single crystal into a black tower crystal (Table 1, Samples 1–5).When the doping ratio is further increased toXi=1.6%(Sample 6),the C source cannot be completely converted. We further increased the temperature of the synthesis chamber while keeping the synthesis pressure unchanged. Under the synthesis condition ofXi= 1.2% (Samples 7 and 9), the crystal structure gradually changes from tower-shaped to plateshaped (Fig. 2(f) and Fig. S1(a)) with certain lateral grafting and numerous catalyst corrosion pits on its surface. Under the doping condition ofXi=1.6% (Sample 8), the crystal does not grow when the temperature of the temperature synthesis chamber is increased. When the pressure is raised to 7.1 GPa again and the synthesis temperature is raised to 1390°C, the crystal grows again. The crystal structure is similar to that grown whenXi=1.2% and is a tetrahedron with a pyramid structure(Fig.S2(a),Sample 10). Under the same conditions,when the doping ratio is 2.0%(Sample 11),the crystal growth is completely blocked again.The need for high synthesis pressure and temperature conditions for diamond nucleation and growth indicates that with the increase in doping ratio,the Vshaped region of diamond growth expands.

Table 1. Summary of synthesis conditions and experimental results.

Fig. 2. Optical images of the diamond crystals synthesized by using Fe–Ni catalysts with varied doping ratios: (a)0%, S1; (b)0.2%, S2; (c)0.4%, S3;(d)0.8%,S4;(e)and(f)1.2%,S5 and S7.S1–S5 were synthesized at 5.8 GPa and 1370 °C,whereas S7 was synthesized at 5.8 GPa and 1400 °C.(g)refers to S12,which was synthesized at 7.1 GPa and 1480 °C with the doping ratio Xi=0.8%.
WhenXi=0, the dominant growth crystal faces of the diamond crystal are mainly{111}and{100}crystal faces with a small amount of{311}crystal faces. As the doping ratio is increased gradually, the{100}and{311}crystal planes decrease gradually. When the doping ratio is increased to 1.2%,the crystal is transformed into a tetrahedron with a pyramid structure,and all crystal planes are{111}crystal planes.
When the doping ratioXiis gradually increased,the temperature and pressure conditions required for the growth of diamond crystals gradually increase, and the crystal growth rate is severely limited (Table 2 and Table S3). Under the same growth time, the crystal geometry size gradually decreases with the increase in doping ratio, and although diamonds are nucleated in C sources, no diamond crystals grow on the seed crystals. Table 2 and Table S3 summarize the growth rates of diamonds under different synthetic conditions.The growth habit and surface morphology of diamond crystals also change regularly with the change in doping ratio.

Table 2. Growth rate and N concentration of diamond crystals synthesized with C6H6N2O in the Fe–Ni–C system.
The crystal micromorphology reflects the crystal growth environment. Therefore, SEM was applied to characterize the crystal surface morphology that was influenced by the change inXi(Fig. 3). AsXiis increased, the growth texture on the crystal surface regularly evolves. If undoped, the diamond crystal has a complete shape(Fig.3(a))and a clear edge boundary, and the crystal surface is very regular and smooth with a few parallel growth stripes even if it is enlarged. WhenXi=1.2% or 1.6%, the upper surface of the diamond crystal (Figs. 3(b) and S2b) has a growth layer section visible to the naked eye, and the crystal boundary exhibits obvious protrusions, gullies, and broken and incomplete growth. A large number of step-like spiral growth steps on the crystal surface show that the crystal grows along the two-dimensional direction(Figs.3, S1(b), and S2(b)). We speculate that these changes are due to the increase inXiand that the introduction of impurities, such as N, H, and O, into the growth chamber has changed the growth characteristics of diamond crystals,making the fine growth lines on the diamond surface gradually become clear and obvious and finally develop into growth faults.[25]

Fig. 3. SEM images of the diamond crystals grown with different doping ratios in the synthesis chamber: (a1)0 wt.%(S1);(b1)1.2 wt.%(S5);[(a2),(a3)]partial magnification of(a1);[(b2),(b3)]partial magnification of(b1).
3.2. Infrared spectroscopic characterization of crystals grown with different doping ratios of N–H–O
Infrared spectroscopy is an effective method for detecting impurity elements inside diamond crystals. Figures 4 and 5(a) show the infrared test results of diamonds synthesized with differentXiin the FeNi catalyst system. All crystals were treated with hot concentrated sulfuric acid to remove Fe and Ni impurities and a small amount of graphite from their surfaces and then ultrasonically cleaned for 5 min in absolute ethanol. All cleaned crystals were placed in an oven at 120°C to remove the alcohol that may have adsorbed onto the crystal’s surface. IR measurements were performed at room temperature. Numerous strong infrared absorption peaks are found in the infrared spectra of the synthesized diamond crystals(Fig.4(a)). Table S2 lists the functional groups and structures corresponding to the major peaks. The diamond crystals synthesized with different doping ratios have strong infrared absorption at 1130 cm-1and 1344 cm-1, which are induced by C-form N(single-substituted N atoms),[26]whereas the intrinsic absorption peak at 1282 cm-1related to A-form N(the nearest adjacent pairs of N atoms in diamond lattice nodes)is extremely weak,[1,27]indicating that the impurity N in the synthesized diamond crystal mainly exists in C form and the content of A-form N is low. Additionally, no 1175 cm-1absorption peak related to B-form N(four N atoms surrounding a vacancy)is observed in the infrared spectrum,indicating that when the N element in the synthetic system is increased,impurity atoms mainly exist in diamonds as substitutional C-form N, and a few N atoms enter the diamonds in the form of diatomic N pair(A-form N).
Consistent with the conclusions of other related studies,we found that the diamond crystals contain almost no B-form N. However, when the synthesis pressure and temperature are greatly increased, the form of N impurities in the crystal changes considerably. IfXi=0.8%(Fig.4(c))at 7.1 GPa and 1480°C,the infrared spectrum exhibits absorption peaks at 1130 cm-1and 1344 cm-1that are related to C-form N and an absorption peak at 1175 cm-1related to B-form N.[28]Generally,absorption peaks related to B-form N are rarely detected in synthetic diamond samples,and B-form N is difficult to obtain even after long annealing times. However, B-form N is one of the common forms of N in natural diamonds. Accordingly,we speculated a scenario about natural Ia diamonds.Some natural type-Ia diamonds may be formed in the mantle at regions deeper than expected. This environment has considerably high pressure and temperature conditions and is rich in N, H,and O fluids. Under such a condition, B-form N could form at the very beginning of diamond growth or go through a relatively brief thermal geological process.
H and O also are common impurities in diamonds. Figure 4(b) shows the variation in the infrared spectrum of diamond crystals at 2500 cm-1–3000 cm-1. Under undoped conditions, the diamond crystal only has an infrared absorption peak at 2688 cm-1and no other obvious infrared characteristic absorption. The diamond crystal synthesized by doping C6H5NO2as an additive not only has characteristic infrared absorption at 2688 cm-1but also has obvious infrared characteristic peaks at 2810 cm-1, 2850 cm-1, 2850 cm-1,2920 cm-1, and 2960 cm-1. The infrared absorption at 2688 cm-1is the frequency-doubled infrared absorption at 1344 cm-1related to the C-form N in diamonds,[29]and the infrared absorptions at 2810 cm-1, 2850 cm-1, 2850 cm-1,2920 cm-1,and 2960 cm-1are attributed to different forms of C–H bond stretching vibrations.[28]Notably, the infrared absorption peaks at 2850 cm-1and 2920 cm-1show an upward trend with the increase in doping ratio, indicating that additional H atoms have entered the diamonds (Fig. 4(b), Samples 1–4). Inversely,under heavy doping(Fig.4(b),Sample 7;Xi=1.2%),the absorption peaks at 2850 cm-1and 2920 cm-1related to H considerably weaken, illustrating that the number of H atoms entering the crystals is reduced; this finding is consistent with the previous experimentally observed phenomenon for the addition of hydrazine organic compounds into the NiMnCo catalyst system.[30]If N enters the diamond lattice, then H is inhibited from entering the diamond lattice. H and O in the synthesis system are prone to generating water.[30,31]Accordingly, the samples have absorption peaks related to water at approximately 1530 cm-1(free water)and 1650 cm-1(crystallization water),indicating that the crystal contains a small amount of molecular water. Given that the synthesis chamber was dehydrated at high temperatures before the experiment and all tested samples were dried and dehydrated, the trace water in the synthetic environment should have originated from the water produced by organic decomposition. Water molecules are often detected in natural diamonds, which exhibit many characteristics in accordance with those of crystals synthesized at extremely high pressures and temperatures. This finding is of great value and significance for understanding the formation mechanism of natural diamonds.

Fig.4. (a)Infrared absorption spectra of the diamond crystals synthesized by using Fe–Ni catalysts with varied doping ratios;(b)enlarged view of the infrared spectrum at approximately 2500 cm-1–3000 cm-1;(c)infrared absorption of S12.

Fig.5. (a)Concentration of A-form and C-form N in diamond crystals;(b)the growth rate of diamond crystals;(c)Raman peak position and Raman half peak width of diamond. The specific sample number corresponds to Table 2,and the corresponding samples are S1(0%),S2(0.2%),S3(0.4%),S4(0.8%),and S7(1.2%).
3.3. Raman spectroscopic characterization of diamond crystals grown with different doping ratios of N–H–O
Raman spectroscopy is an important means for characterizing the lattice disorder and crystal quality of diamond crystals. The Raman FWHM of diamond crystals indicates the relative quality of the crystals. Figure 6 shows the Raman test results of diamond crystals doped with different proportions of C6H5NO2. Although all samples have the intrinsic diamond peak at 1332 cm-1, the Raman peak intensity of the synthesized diamond samples decreases with the increase in doping ratio.
With the increase in doping ratio, the Raman peak of the sample also shifts to the long wavelength region from 1332.9 cm-1to 1331.5 cm-1,indicating that the diamond lattice has gradually expanded. The Raman FWHM of the synthesized diamond crystal is gradually widened from 5.25 cm-1to 5.65 cm-1as the doping ratio is increased. The Raman half-width reflects the crystallinity of the crystal, and a high FWHM is indicative of the low crystallinity and crystallization quality of diamonds.[32]

Fig.6. Raman shifts of the diamond crystals synthesized from the Fe–Ni–C system with N–H–O.

Fig. 7. PL spectra of diamond crystals synthesized in the Fe–Ni–C system with different doping ratios. The spectra were collected at 488 nm excitation at room temperature.
Moreover, whenXi= 1.2%, the synthesized diamond crystal has the intrinsic Raman peak at 1331.5 cm-1and clear Raman signals at 1418 cm-1and 1542 cm-1, among which the natural vibration peak of the graphite with sp2hybrid structure is located at 1542 cm-1. These results indicate that the peak is caused by the sp2hybrid C in the synthesized diamond crystal.[33]When the N–H–O doping proportion is high, the diamond crystals hybridize with the recrystallized graphite,resulting in the Raman FWHM expansion and poor crystallinity of the crystal. Remarkably, whenXi= 1.2%, the synthesized diamond crystal exhibits a Raman peak at approximately 1418 cm-1. In accordance with the relevant literature, this Raman peak is assigned to the fluorescence effect that is induced from the N inside diamond.[34]The diamonds contain N,which results in local energy levels in the diamonds.Therefore,when the diamonds are exposed to lasers,the electrons in their outer layer undergo an electronic transition that is accompanied by the release of energy,resulting in fluorescence.
3.4. Photoinduced spectral analysis
PL technology is an effective method for characterizing defects and optical centers in diamonds. Diamond color centers possess huge application value and prospects in the field of quantum devices. The PL spectra of diamonds synthesized with different doping ratios were collected, analyzed,and summarized(Fig.7). All PL tests were conducted at room temperature. With the gradual increase inXi, the PL spectra of the samples change gradually and regularly. This change is mainly reflected in the defect center type and its luminescence intensity.
Undoped or slightly doped (Xi= 0 wt.%, 0.2 wt.%,0.4 wt.%) synthesized diamond samples were examined for the presence of PL excitation at 522 nm (diamond Raman line); 555 nm (Ni–N related), at which the specific structure has not been determined and needs further investigation; and 637 nm(NV-).[35,36]As the doping ratio is increased,the luminescence intensity of the 637 nm center gradually increases.WhenXiis further increased to 0.8%,the luminescence intensity of the 555 nm and 637 nm center increases drastically and a subtle luminescence center emerges at 506 nm. WhenXi= 1.2%, the PL property of the sample changes tremendously; the 506 nm luminescent center is enhanced, and the 528 nm luminescent center, which is absent from other samples,appears. The 506 nm center is ascertained to result from the NE1 (N–VNiV–N)[37]center, whereas the 528 nm center is related to NE3(N–VNiV–N2). Interestingly,as the 528 nm center emerges,the Ni–N-related center at 555 nm is dramatically weakened and even nearly vanishes. Additionally, the 568 nm and 575 nm luminescence centers corresponding to the S1.[17]and NV0centers,respectively,appear. Notably,the intensity of the NV-(637 nm)center is always higher than that of NV0(575 nm). A previous study reached the opposite conclusion for high-purity diamonds synthesized through HPHT(type IIa,in which the N concentration is less than 1 ppm):The intensity of the NV0center is considerably stronger than that of the NV-center. In high-purity type IIa diamonds, only a few donor N atoms exist,resulting in vacancies that are mostly electrically neutral. Consequently, the NV0center is more likely to form and exhibit a higher intensity than the NV-center. By contrast, the opposite situation is observed for N-rich diamonds because the high N concentration and abundant N atoms result in most of the vacancies being negatively charged.Therefore,the NV-center is more inclined to form and exhibit a higher intensity than the NV-center.With the increase inXi,the luminescence intensity at the 555 nm center also increases(Xifrom 0 to 0.8%)likely because with the increase in doping ratio, the numbers of N and Ni atoms entering the diamonds increase, forming additional luminescence centers related to the Ni–N structure. However, whenXiis further increased to 1.2%, the 555 nm center dramatically decreases, whereas the 506 nm(NE1,N–VNiV–N),528 nm(NE3,N–VNiV–N2),and 575 nm (NV0) luminescence centers are abruptly enhanced.We speculate that whenXi=1.2%, the quantity of Ni atoms entering the diamonds drastically increases when Ni is combined with the massive NV center, forming the NE1 center that has a single Ni and two NV center structures and NE3 centers. XPS measurements (Table S4 and Fig. S3) indeed confirmed that the number of Ni atoms entering the diamonds has increased,further verifying the above conjecture.
4. Conclusion
In this study, the N–H–O codoped system was constructed by using C6H6N2O as an additive, and diamond single crystals containing N, H, and O atoms were successfully synthesized by using the{111}crystal plane with the same size as the initial growth plane. The experimental results demonstrated that with the increase in the doping amount of C6H6N2O, the V-shaped region of diamond crystal growth gradually expanded and the growth rate of diamond crystals decelerated. The color of the diamond crystals changed from bright yellow to dark green and to black. The growth texture on the diamond crystal surface became increasingly clear,and corrosion pits,bulges,and spiral growth steps appeared on the crystal surface. Infrared spectroscopy confirmed that as the doping ratio increased, the N content in the crystal increased markedly. Additionally, the heavily doped diamond crystals grown under high temperatures and pressures contained Bform N, which is very rare in common synthetic diamonds.Infrared spectroscopy also illustrated that when the doping ratio was gradually increased, H and O atoms in the diamond crystals also changed. The Raman scattering spectroscopy of diamond crystals gradually shifted to the long-wave direction,reflecting that the internal stress in the crystals increased along with the increase in doping ratio. The FWHM of the Raman scattering peak also widened gradually,indicating that the lattice became increasingly disordered. The PL property of diamonds was also affected by the doping ratio given that as the doping ratio increased,the NV luminescence center gradually increased. Particularly, the uncommon NE1 and NE3 centers were found at 506 nm and 528 nm,respectively.
Acknowledgments
Project supported by the National Natural Science Foundation of China(Grant Nos.51772120,11604246,51872112,and 11804305); the Project of Jilin Science and Technology Development Plan (Grant No. 20180201079GX); the Fundamental Research Funds for the Central Universities,the Natural Science Foundation of Chongqing, China (Grant No. cstc2019jcyj-msxmX0391); and the Science and Technology Research Program of Chongqing Municipal Education Commission(Grant No.KJQN201901405).
猜你喜歡
高中生學習·閱讀與寫作(2021年8期)2021-10-30
時代郵刊·下半月(2021年10期)2021-10-23
北廣人物(2020年29期)2020-07-29
東坡赤壁詩詞(2019年5期)2019-11-14
東坡赤壁詩詞(2019年3期)2019-07-05
婦女生活(2019年6期)2019-06-26
東坡赤壁詩詞(2017年3期)2017-07-05
東坡赤壁詩詞(2017年3期)2017-07-05
婦女生活(2014年7期)2014-09-10
幸?!せ橐霭?2014年7期)2014-08-25
- Chinese Physics B的其它文章
- Formation of high-density cold molecules via electromagnetic trap
- Dynamics of molecular alignment steered by a few-cycle terahertz laser pulse
- Terahertz spectroscopy and lattice vibrational analysis of pararealgar and orpiment
- Molecule opacity study on low-lying states of CS
- Finite-time Mittag–Leffler synchronization of fractional-order complex-valued memristive neural networks with time delay
- Ultrafast Coulomb explosion imaging of molecules and molecular clusters