
Maritime Energy Transition: Future Fuels and Future Emissions
2023-03-01 11:09WilliamRamsayErikFridellandMarioMichan
William Ramsay, Erik Fridell and Mario Michan
Abstract The lifecycle greenhouse gas (GHG) emissions (Well-to-Wake) from maritime transport must be reduced by at least 50% in absolute values by 2050 to contribute to the ambitions of the Paris Agreement (2015).A transition from conventional fuels to alternative fuels with zero or lower GHG emissions is viewed as the most promising avenue to reach the GHG reductions.Whereas GHG and toxic pollutants emitted from the use of fossil fuels (heavy fuel oil (HFO) and marine gas/diesel oil (MGO/MDO)) are generally well understood, the emissions associated with the new fuel options are only now being measured and communicated.This review provides an outlook on fuels that could help shipping respond to the decarbonization effort including Liquefied Petroleum Gas (LPG), Liquefied Natural Gas (LNG), methanol, ammonia, and hydrogen.A quantification of the pollutants associated from the use of these fuels is provided and challenges and barriers to their uptake are discussed.
Keywords Greenhouse gas; Emissions; Maritime transport; Future fuels; Future emissions; Life-cycle assessment; Energy transition
1 Introduction
The downstream (Tank-to-Wake, TtW) greenhouse gas(GHG) emissions from maritime transport that are emitted from ships combustion engines are estimated at approximate‐ly one billion tons of carbon dioxide equivalents (CO2e)annu‐ally (Buhaug et al., 2009; Faber et al., 2020; Lindstad et al.,2021; Smith et al., 2014).When the upstream (Well-to-Tank,WtT) GHG emissions from fuel production are included the total Well-to-Wake (WtW), or life-cycle emissions, increase to 1.25 – 1.5 billion tons of CO2eq(Lindstad et al., 2020),which is 3% of the 50 billion tons of anthropogenic GHG emitted annually (BP, 2021).
In 2018, the International Maritime Organization (IMO)agreed to reduce GHG emissions, which includes carbon di‐oxide (CO2), methane (CH4) and nitrous oxide (N2O), from international shipping by at least 50% by 2050 (relative to 2008) (IMO, 2018) as a pathway to reach the Paris Agree‐ment goal to limit global warming to 1.5℃ compared to preindustrial levels (UN, 2015).Recent activities indicate that this target will most likely be revised, with a strong push to reduce GHG emissions by 100% by 2050 (Bush, 2022).There are several options (and their combinations) for the maritime industry to reach the required GHG reductions, in‐cluding design and other technical improvements of ships,operational improvements, and, perhaps most promisingly,adopting energy carriers (fuels) with lower or zero GHG foot‐print (effectively moving away from the conventional use of fossil or carbon-based fuels) (Bouman et al., 2017).Consider‐ing that 99.5% of the current world fleet, which consists of approximately 110 700 vessels above 100 GT (not including inland waterways, non-merchant, and non-propelled vessels)is powered by diesel engines running on conventional marine fuel oils (such as heavy fuel oil (HFO) and marine gas/diesel oil (MGO/MDO)) (Figure 1), switching to fuels with lower or zero GHG emissions will be a disruptive transition for the conservative industry (DNV, 2021; UNCTAD, 2021).As indication of the decarbonization efforts by ship owners,approximately 12% of current newbuilds are ordered with fuel systems that move away from conventional fuels(Figure 1), with an increase in use of fuels such of ammonia,hydrogen, methanol, Liquefied Petroleum Gas (LPG) and Liquefied Natural Gas (LNG).
At first glance, the use of carbon-free fuels, such as ammo‐nia and hydrogen, are obvious candidates to reduce carbon dioxide (CO2)emissions as the carbon-free molecules do not release CO2when combusted.It is also generally accepted that LNG combusted in the ship’s engines delivers approxi‐mately 25% lower CO2emissions than conventional fuels(MGO and HFO) (Lindstad et al., 2020; Ushakov et al.,2019).However, these TtW emission reductions do not eluci‐date other issues arising from other pollutants that are re‐leased during combustion.For example, when one includes WtT estimates for the LNG supply chain (including extrac‐tion and transportation) and un-combusted methane (CH4)from the ship’s engine(s) (complete TtW), these additional emissions reduce and in the worst case negate any GHG ben‐efits relative to HFO or MGO (Lindstad, 2019; Lindstad and Rialland, 2020).Furthermore, emissions of N2O, a potent GHG with a Global Warming Potential (GWP) 273 times that of CO2on a 100-year timescale, formed in the combus‐tion of ammonia can significantly contribute to CO2eemis‐sions (Zincir, 2022).
In an effort to compare the alternative fuels (LNG, LPG,methanol, hydrogen, and ammonia) being pursued by the shipping industry to reduce GHG emissions, there is first pro‐vided a summarized emission factor data (in both g/kWh and g/MJ) of all of the pollutant emissions (both toxic and GHG)that result from combustion of these fuels (complete TtW emissions); these values are compared against traditional bun‐ker fuel (HFO) and diesel (MGO/MDO) (Tables 1 and 2).The emissions of carbon dioxide (CO2), methane (CH4)and nitrous oxide (N2O) are used to calculate CO2eemissions as a metric to compare exhaust gas emissions based on their GWP on both a 20-year and 100-year perspective (Shine,2009).The most recent GWP values provided by the Interna‐tional Panel on Climate Change (IPCC) in their 6thAssess‐ment Reports (AR 6), (IPCC, 2022) are based on the most re‐cent scientific work and therefore recommended as a charac‐terization factor of climate impact in life-cycle assess‐ment (LCA) studies (Hauschild et al., 2013).Values for sulfur oxides (SOx), nitrogen oxides (NOx), ammonia(NH3), particulate matter (PM), non-methane volatile organic compounds (NMVOC), and carbon monoxide (CO) emission values are also provided as they have both global climate ef‐fects and regional and local environment impacts on human health and nature (Lindstad et al., 2020).These TtW emis‐sions are then presented with WtT emissions to provide a LCA summary of the alternative fuels (Table 3).In this way,one can clearly compare the GHG reduction potentials of LNG, LPG, methanol, hydrogen, and ammonia against HFO and MGO/MDO from both WtT and TtW perspectives.
There is also provided highlights of the key challenges to adopt alternative fuels in the shipping industry to put in con‐text the difficulty in switching to these fuels.Typical key bar‐riers include the retrofit cost (implementation of new or adap‐tation of existing machinery and storage), engine availability and technical maturity as an energy converter, increased and/or highly variable fuel prices (with unknown availability),lack of global bunkering infrastructure, increased tank capaci‐ty to store less energy-dense fuels (this is a substantial barrier for many alternative fuels to be used in deep-sea trading),and safety and handling considerations (particularly the cur‐rently unestablished rules and regulations) (DNV, 2021).
By first providing the most up-to-date and quantitative TtW emission factors of all the GHG and toxic pollutants that are released during combustion from alternative fuels,and then duly providing an LCA summary for complete WtW emission factors, one can weigh the GHG reduction po‐tentials of LNG, LPG, methanol, hydrogen, and ammonia against the reality of implementing these alternative fuels across the global fleet with the highlighted key barriers to up‐take in the shipping industry.
2 Future fuels and emissions
2.1 Liquefied natural gas (LNG)

Figure 1 Uptake of alternative fuels for the world fleet (June 2021) (adapted from DNV, 2021)

Table 1 Tank-to-Wake (TtW) combustion emissions by fuel (gpollutant/kWh)
There is a large interest in the use of Liquefied natural gas (LNG) in shipping to reduce emissions, including CO2(Burel et al., 2013).LNG consists mainly of methane and is favored since the emissions of air pollutants SOx, PM and NOxare significantly lower from LNG engines com‐pared to traditional marine diesel engines burning HFO or MGO/MDO (Brynolf et al., 2014a).The low sulfur con‐tent of LNG results in low SOxemissions (although the sul‐fur content of the pilot fuel can contribute to SOxemis‐sions), and corollary, PM emissions are low (the absence of polyaromatics and combustion specifics also contribute to low PM emissions).The lower NOxemissions from LNG compared to HFO is mainly a result of reduced peak temperatures during combustion (Woodyard, 2009), and al‐though can reach Tier III levels, are still significant.Also,CO2emissions per energy unit is relatively low from LNGcombustion due to more chemically bound energy per car‐bon content in natural gas than in fuel oil (Winnes et al., 2020).
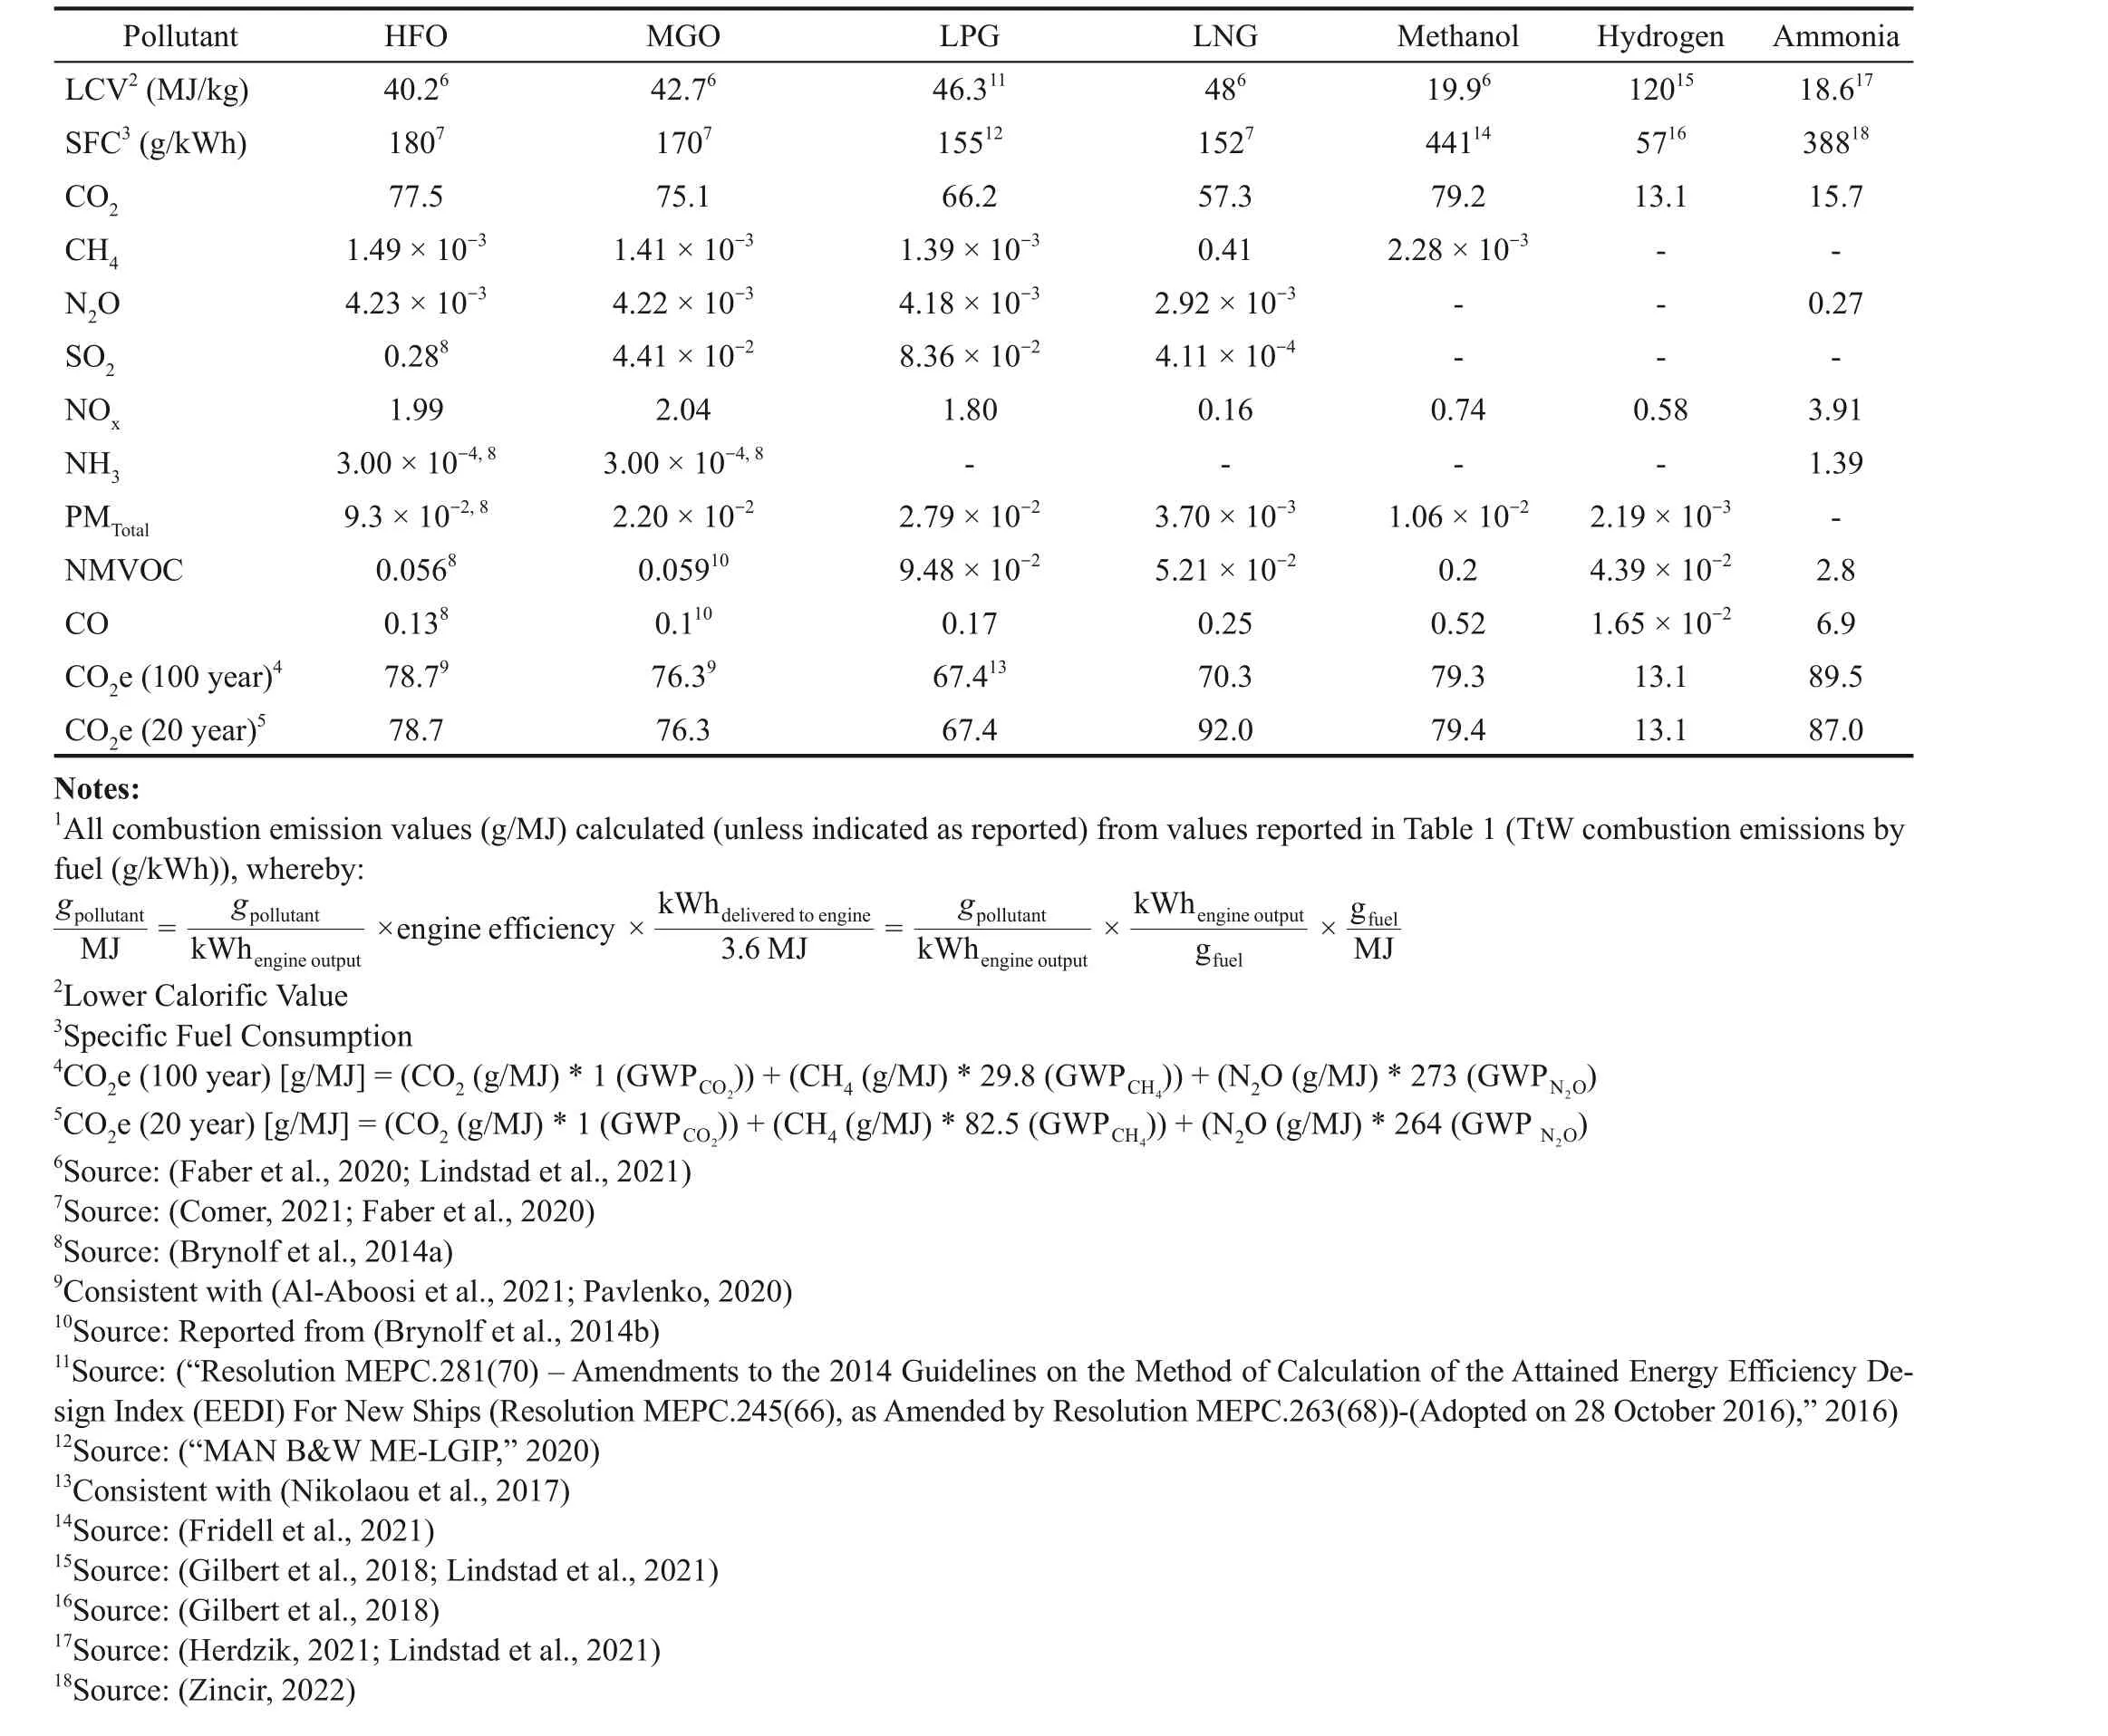
Table 2 Tank-to-Wake (TtW) combustion emissions by fuel (gpollutant/MJ)1
The marine engines operating on LNG (or equally Lique‐fied Biogas, LBG) are very often either a low-pressure or high-pressure type, with the low-pressure dual fuel engines being the most used on ships that are not LNG carriers.The low-pressure engines are either spark ignited (SI) (gas only)or use a dual fuel technology where a pilot fuel injection is used for ignition (referred to as LPDF or LNG Otto, medi‐um speed (MS) and slow speed (SS)).Another type of dual fuel engine is the high-pressure engine that uses LNG as fu‐el in a diesel combustion cycle (HDPF or LNG diesel).
The drawback from the combustion in the low-pressure engines is a 2.3% – 4.1% slip of unburnt methane through the combustion process for the most common LNG fueledengines that are in operation today (Stenersen and Thons‐tad, 2017).The slip, measured as CO2efrom a 100-year perspective, is large enough to result in CO2eemissions from LNG to be comparable to those from MGO (Pavlen‐ko, 2020), and when measured from a 20-year perspective,results in emissions of CO2eto exceed those from MGO(Winnes et al., 2020).The methane slip from ships engine contributes to the world’s increasing global methane emis‐sions, where the rising atmospheric methane levels repre‐sent a major challenge in the effort to limit global warm‐ing (Lindstad et al., 2020).
In a comparison between the engine types, the methane slip is lower from a HPDF engine (LNG diesel) (0.2 –0.4 g/kWh) than a LPDF engine (LNG Otto) (average emission factors are reported as 5.5 – 6.9 g/kWh for LPDF MS (LNG Otto MS) and 2.5 – 3.2 g/kWh for LPDF SS(LNG Otto SS)) (Comer, 2021; Winnes et al., 2020).This is mainly a result of burning the fuel directly upon injec‐tion during the compression stroke in a HPDF engine,whereas a LPDF engines compress an air/fuel mixture(Ushakov et al., 2019).These emission factors will also change at different load conditions and from different en‐gine manufacturers.

Table 3 Emission factors (WtT, TtW and WtW) of different shipping fuels (g CO2e/MJ of fuel) and comparison to HFO/MGO (conventional shipping fuels) (GWP100)
2.2 Liquefied petroleum gas (LPG)
Liquefied petroleum gas (LPG or LP-gas) consists of propane, propylene, butane, and butylenes (US EPA,2020).Although the emissions from the use of LPG on‐board a vessel have not been reported to date, it is known that gaseous pollutants such as NOx, CO, and organic compounds are produced during combustion as are small amounts of SO2and PM.LPG combustion results in low‐er CO2emissions compared to oil-based fuels due to its lower carbon to hydrogen ratio (Nikolaou et al., 2017), but the CO2emissions are higher than that of LNG.Unburnt fuel emissions can also be released from LPG combustion,including propane (GWP100 = 0.02), n-butane and isobu‐tane (GWP100 butane = 0.006) (IPCC, 2022), although any slip of un-combusted fuel through the engine would re‐sult in less GHG emissions for LPG than for LNG.
2.3 Methanol
Methanol is also a potential alternative fuel for ship‐ping.It is a liquid at standard temperature and pressure,which makes handling easier in comparison to LNG(Brynolf et al., 2014b).On an industrial scale, methanol is predominantly produced from natural gas reforming and distilling the resulting mixture (Riaz et al., 2013).Metha‐nol can also be produced from renewable resources, en‐abling lower WtT GHG emissions in the transition to nonfossil fuels (Fridell et al., 2021).
Recently, emissions of exhaust gases and PM from a du‐al fuel marine engine using methanol as fuel with MGO as pilot fuel have been reported for an operating ferry (Fridell et al., 2021).It was determined that the emission factor for NOxwas between 6.5 and 12.3 g/kWh, which is lower than what is typically found for MGO, but does not reach the Tier III limit.The emissions of CH4was determined to be 0.020 g/kWh, which is low when compared to the 5.5 –6.9 g/kWh reported for dual fuel LNG engines of similar type(Stenersen and Thonstad, 2017).The PM emission (as mass of particles) was measured as approximately 0.1 g/kWh, which is lower than what is normally reported when using MGO as fuel, although there is a significant range in results from MGO reported in the literature (from 0.1 to 0.4 g/kWh)(Winnes et al., 2016).The black carbon (BC) represented approximately 17% of the mass of the PM in the data re‐ported and the BC emissions are also lower than what is ex‐pected from MGO (Fridell and Salo, 2016).Furthermore,the measured emissions of THC and NMHC were both 1.6 g/kWh, which is higher than what has been reported when using fuel oil in a medium speed engine (approxi‐mately 0.2 g/kWh) (Cooper and Gustafsson, 2004).Al‐though emissions of aldehydes are a concern for alcohol fuels, the emission factor measured for formaldehyde was 4.9 × 10?4g/kWh, which is well below the US HD limit of 0.013g/kWh (“Worldwide Emissions Standards Heavy Du‐ty and Off-Highway Vehicles,” 2016).Importantly, it was also determined that the emission factor of CO2was 28%higher than the use of MGO.
2.4 Hydrogen
Hydrogen has been attracting attention across all energy sectors as a clean and flexible energy carrier with per‐ceived zero GHG emissions (World Economic Forum,2022).Hydrogen can be produced from hydrocarbon feedstocks via chemical processes (e.g., steam reform‐ing of NG and coal gasification), and by using electrici‐ty to electrolyse water (Holladay et al., 2009; Navarro et al., 2007).“Renewable hydrogen” is produced using re‐newable energy or electricity sources that results in a de‐crease or zeroing of the GHG emissions (Barbir et al.,2016).At the other end of the supply chain, hydrogen can be consumed by diverse end-use applications including fuel cells and internal combustion engines (Ozawa et al., 2017).
Hydrogen combustion does not produce CO2(or other greenhouse gases), CO, HCs, SOx, smoke, lead (or other toxic metals), sulphuric acid, ozone (or other oxidants),benzene (or other carcinogenic compounds), or formalde‐hydes (Masood et al., 2007).Instead, its main product of combustion is water (Bose and Maji, 2009).There can be,however emissions of CO, CO2and HCs in exhaust gas be‐cause of the burning of lube oil and pilot fuel that is re‐quired for combustion (Bose and Maji, 2009).The only pollutant is NOx, which is due to high combustion tempera‐ture in hydrogen fuelled engines; the exhaust gas tempera‐ture for hydrogen enrichment is 505 ℃ at 80% load where‐as that of diesel is 260 ℃ (Bose and Maji, 2009).
The application of hydrogen injection in internal com‐bustion engines was proposed in the 1970s (Pan et al.,2014) and can be dated back two-hundred years (Cecil,1822).Many studies have implemented the use of hydro‐gen as a fuel in SI engines (Haragopala Rao et al., 1983),but these studies illustrated issues with backfire and knock‐ing problems at high loads due to the spontaneous combus‐tion of hydrogen, as well as a substantial drop in power output (Pan et al., 2014).Nevertheless, the implementation of hydrogen in SI engines has demonstrated excellent ener‐gy conversion with extremely low harmful emissions (Ver‐helst et al., 2006; White et al., 2006).Because of hydro‐gen’s high self-ignition temperature (576 ℃), it is not pos‐sible to use hydrogen directly in compression ignition (CI)engines as fuel (Bose and Maji, 2009), and an energy source is needed to provide ignition (Gomes Antunes et al., 2009).Combustion triggering devices such as installa‐tion of glow plugs in the combustion chamber has been used, but more widely investigated and implemented is the addition of a lower auto-ignition fuel to the combustion chamber (Bose and Maji, 2009).Hydrogen can be used in small energy share ratios for improving the engine’s per‐formance and provide reductions in carbon, smoke and NOxemissions, or can be used in high energy share ratios with the (diesel) fuel injected close to the engine’s top dead centre to act as the combustion trigger (Dimitriou et al.,2018).Although work has been reported for cases with hy‐drogen energy share ratio to be less than 5% or even more than 95%, most demonstrations investigates the effects of hydrogen energy share ratios between 10 and 40% (Dimi‐triou et al., 2018).
A recent review of H2supply in CI engines concludes that the use of H2as an energy carrier provides significant reduction in HC, CO, CO2and smoke in comparison to conventional fuels, but NOxformation was a significant is‐sue (Dimitriou and Tsujimura, 2017).In one example, hy‐drogen fuel (0-98% energy share ratio) was tested at low and medium operating loads in a heavy-duty hydrogen-die‐sel dual-fuel engine (Dimitriou et al., 2018).At medium load (with a maximum of 85% H2energy share ratio), the CO emission was reduced by up to 88%, the CO2emission was decreased by up to 84% (compared to diesel), the soot formation was up to 87% reduced, and the THC were at the same level (compared to diesel) for the dual-fuel opera‐tion.However, NOxemission increased four times higher than the conventional engine due to the high energy con‐tent of hydrogen fuel.Similar results were reported when the energy share of hydrogen co-combusted with diesel was changed in the range from 0 to 30% in a single-cylin‐der 4-stroke diesel dual-fuel engine (Jamrozik et al.,2020).The addition of up to 25% hydrogen to the CI en‐gine resulted in an 85% reduction in soot emissions, 57%reduction in CO, and 27% reduction in CO2.The disadvan‐tage of using hydrogen as a fuel for a CI engine was in‐crease in HC emissions and a significant increase in NO emissions (by over 80%).
2.5 Ammonia
Towards meeting the IMO’s goals, the use of ammonia as a shipping fuel is gaining significant interest because,like hydrogen, it is a carbon-free molecule and will not pro‐duce CO2when combusted (Al-Aboosi et al., 2021; Hans‐son et al., 2020a).However, it is important to account for all of the emissions emitted during combustion, as other sig‐nificant GHGs, such as N2O, are known to be emitted in the exhaust gas from the use of ammonia as a fuel (Zincir,2022).Furthermore, the emissions associated with the use of pilot fuels, which are required for combustion as ammo‐nia has a high resistance to autoignition, can produce CO2eemissions and need to be considered.
Although ammonia has been used in combustion engines since the second world war, there are a limited number of combustion tests (with emission data) published.Ammonia has rather poor ignition and combustion properties and an ignition fuel is needed for both CI engines (e.g., diesel oil,methanol or dimethyl ether (DME) (Gross and Kong, 2013;Pochet et al., 2017;Reiter and Kong, 2011, 2008) and SI en‐gines (e.g., hydrogen or alcohols (Frigo and Gentili, 2013;M?rch et al., 2011)) (Hansson et al., 2020b; Rehbein et al.,2019).In the CI engine application it was found that the successful approach was to supply ammonia vapor to the air intake system and use diesel fuel to provide ignition en‐ergy (Pearsall and Garabedian, 1968).The other approach of directly injecting liquid ammonia into the cylinder without using diesel fuel was not successful even though the engine compression ratio was increased to 30∶1.
The available tests on combustion engines show issues with ammonia slip (Bro and Pedersen, 1977; Reiter and Kong, 2011), NOx(Frigo and Gentili, 2013; Gray et al.,1966; Gross and Kong, 2013; M?rch et al., 2011; Ryu et al.,2013) and N2O (Pochet et al., 2017) emissions and potential‐ly emissions of CO and hydrocarbons (Gross and Kong,2013; Ryu et al., 2013) (depending on pilot fuel).Ammonia that is released into the atmosphere can have health risks (if at high concentrations) and contributes to eutrophication.Emissions of N2O are of significant concern due to its high GWP.Recently, a case study of the environmental and eco‐nomic effects of an ammonia-diesel dual-fuel marine engine onboard a general cargo ship has been reported (Zincir,2022).There were three fuel options in the study: 100%MDO, 60% NH3/40% MDO, and 95% NH3/5% MDO (this fraction is the highest energy fraction for the stable combus‐tion of the ammonia-diesel dual-fuel engines in the litera‐ture).It was reported that the SOxand PM emissions were de‐creased up to 95% by ammonia usage.The NOxemissions were 19.4% lower than MDO at 60% NH3energy fraction but increased 133.1% at 95% NH3energy fraction.Although it was reported that blue and solar green ammonia comply with IMO2030 CO2ereduction target of 40% and green am‐monia (from wind energy) complies with IMO2050 CO2ere‐duction target of 70%, the full TtW emissions, including the N2O emissions and carbon-based emissions from the pilot fu‐el, were not taken into consideration.Importantly, the N2O emissions of the ammonia-fueled engines with 60% and 95%energy fractions were calculated as 1.55 g/kWh and 1.95 g/kWh, respectively (calculated using values reported by Yousefi et al., 2022).The NOxand N2O emissions can likely be handled with after treatment systems (achieving Tier III NOxvalues and near zero N2O values), either three-way cata‐lyst (TWC) if the combustion is stoichiometric or Selective Catalytic Reduction/Exhaust Gas Recirculation (SCR/EGR)for lean combustion.However, the high fraction of the pilot fuel (specifically the emissions that result from the pilot fu‐el), the ammonia slip, and the N2O emissions are factors that need to be addressed (Hansson et al., 2020b).
3 Emissions discussion
The TtW combustion emissions (i.e., onboard emissions)for LPG, LNG, methanol, hydrogen, and ammonia are pre‐sented in Table 1 (gpollutant/kWh) and Table 2 (gpollutant/MJ); the emission factors for HFO and MGO are shown for compari‐son.The emissions of carbon dioxide (CO2), methane (CH4)and nitrous oxide (N2O) are used to calculate CO2eemissions as a metric to compare exhaust gas emissions based on their GWP on both a 20-year and 100-year perspective (Shine,2009).
For LPG, the CO2emissions are 13% and 15% less than MGO and HFO, respectively, and with lower emissions of SOxand PM; NOxand CO remain similar to the conventional fuels.Although CO2emissions for LNG are reduced by 25%when compared to HFO, including the conservative value of 3 g/kWh of methane slip (reflecting the most common LNG engines of Otto-SS and MS, in which LNG-Otto-SS = 2.5 –3.5 g/kWh and LNG-Otto-MS = 5.5 – 6.5 g/kWh) detract from the CO2ereduction potential of the fuel; lower values of SOx, NOx, and PM are still advantageous for LNG.Methanol has little advantage over HFO/MGO other than lower SOxand PM values, but the higher CO2and CH4emissions nulli‐fy any CO2ereduction potential.The emission factors report‐ed for hydrogen considers an 85% H2energy share with die‐sel in an inline-4 heavy-duty hydrogen (port injection)-diesel(direct injection) dual-fuel engine (Dimitriou et al., 2018).The benefits of hydrogen are clear (83% CO2ereduction),with reduction or removal of most pollutants, other than CO2(from the pilot fuel) and high NOxemissions.Similar to hy‐drogen, the emissions factors reported for ammonia considers a 95% NH3/5% MDO energy share (Zincir, 2022).Although the CO2reduction in comparison to HFO/MGO is 80%, in‐cluding the N2O emissions surpasses the CO2eemissions for HFO/MDO; the high NOxand HC emissions are also of con‐cern.The TtW combustion emission factors for all consid‐ered fuels are combined with WtT emissions to provide a LCA summary of the alternative fuels (Table 3).
Considered on a lifecycle perspective, LPG production is associated with lower emissions than oil-based fuels.The combination of low production and combustion emis‐sions yields an overall GHG emissions reduction of 17.2%compared to HFO or MGO (consistent with Nikolaou et al., 2017).For LNG, by including a conservative estimate of methane slip in the TtW emissions, the overall GHG emissions reduction is only 8.8% compared to HFO or MGO.Methanol, overall, has higher GHG emissions(13.6%) than the conventional fuels.If hydrogen is pro‐duced from a renewable source (hydro, wind or solar), the WtW GHG emission can be reduced by 79.9%; (Bicer and Dincer, 2018) reported a 40% decrease in GHG emissions per tonne-kilometre when hydrogen was used as dual fuel with heavy fuel oils (50%).Unfortunately, if hydrogen is produced from natural gas, as is common practice today,the use of hydrogen as a marine fuel contributes to 96.2%more GHG emissions than the use of conventional fuels.An interesting trend is calculated for ammonia: even if am‐monia is produced from a renewable source (green ammo‐nia), the use of ammonia can reduce GHG emissions by 71% if N2O emissions are completely removed nearing the advantages of hydrogen, otherwise will contribute to 13.1% GHG emissions; (Bicer and Dincer, 2018) reported a 30% decrease in GHG emissions per tonne-kilometre when ammonia was used as dual fuel with heavy fuel oils(50%).If ammonia is produced from natural gas (brown ammonia), the WtW GHG emissions increase by 140.0%including N2O emissions and 55.9% without including N2O emissions; note that although the production of blue ammonia (produced from fossil sources with carbon cap‐ture) results in 85% less CO2emissions than brown vari‐ants, only green ammonia can provide the up to 71% GHG emission reduction and is a zero-carbon fuel (Brinks and Chryssakis, 2022).
4 Challenges and barriers to uptake
Table 4 identifies seven key challenges in the uptake of alternative fuels identified above for shipping.
4.1 Retrofit cost
In order to maintain comparability across all fuels, one category of vessels is presented: LR1 tankers.The retrofit costs are based on the American Bureau of Shipping’s(ABS) MarE-fuel study, published in late 2021.
On the higher end, LNG’s retrofit cost of $26.5 million compares to a less costly retrofit for a methanol operation at $15 million.Both LPG and ammonia have similar retro‐fit costs with $18.5 million and $20 million, respectively.A hydrogen retrofit cost is not included as none have been identified for this vessel type.
4.2 Engine availability
Engine technologies for LNG, LPG and methanol are readily available today.Methanol engines today are devel‐oped by MAN and WinGD’s engine is expected to be available from 2024.The first ammonia engine will be ready end of 2024 (developed by MAN Energy Solutions).WinGD and Wartsila are also working on ammonia en‐gines to be delivered in 2025.For hydrogen, it is estimated that the first engines for this vessel type will only be avail‐able beyond 2030.It is also worth noting that engine man‐ufacturers, such as MAN, have developed innovative dualfuel two-stroke engines that can run on LNG, LPG, ethane and methanol nearly interchangeably (Anner, 2022); fuelagnostic engine platforms, which offer different versions of the same base engine with unique cylinder heads de‐signed to accommodate a different low or zero carbon fu‐el, are also being pursued in addition to fuel flexible en‐gines that can run on multiple fuels (White, 2022).Exist‐ing optimizations of diesel engines (Altosole et al., 2017;Tadros et al., 2019) and application of established after‐treatment exhaust systems (Lu et al., 2022) can be applied to future engine developments using alternative fuels to provide the most sustainable engine technologies (Trivy‐za et al., 2022).

Table 4 Key challenges for the uptake of alternative fuels for shipping
4.3 Technology maturity
Both LNG and LPG use mature technology, with ap‐proximately 1,050 LNG and 37 LPG vessels in operation today (according to Clarkson’s research).Conversely,methanol has not been deployed to the same scale with on‐ly 16 vessels deployed and 23 on order.Both ammonia and hydrogen have the lowest technology maturity at this stage compared to the other alternative fuels.
4.4 Fuel price
Price visibility is a key challenge for the renewable fuels.Fuels such as ammonia, methanol and hydrogen are not as readily traded as their counterparts.As much as possible the fuels are priced based on the same delivery location in Singa‐pore.In addition, their renewable production pathway is not readily priced, heavily depending on current project develop‐ment.As a result, renewable pathways are priced based on pro‐duction cost in this analysis.These prices should only serve as indicative for the purpose of this comparative exercise.
Fuel prices (June 2022) are presented in $/1 000 MJ to compare fuel prices adjusted for energy density and can be parallelly compared to prices in $/mt (Table 5).
Using Very Low Sulphur Fuel (VLSF) oil as a reference to compare against alternative fuels, LPG is more cost-effective than VLSF based on equal energy density.Meanwhile, LNG and ammonia are expected to be approximately 50% and 150% more expensive than VLSF, respectively.Methanol would be similar to LNG, ranging from 50% to 100% more expensive than VLSF.Hydrogen’s cost compared to VLSF depends on its feedstock, with it being competitive if pro‐duced from gas or 80% to 260% more expensive otherwise.
4.5 Bunkering and tank infrastructure
In terms of ease of adoption, LNG is the most broadly used and possesses existing global bunkering and infra‐structure.LPG is almost wholly used on LPG carriers on‐ly.Today there is very limited (if any) bunkering and infra‐structure for methanol, ammonia, and hydrogen.Methanol can technically use existing liquid infrastructure whereas ammonia can “piggyback” on LPG infrastructure.Today both methanol and ammonia are waterborne traded.Ammo‐nia traded volumes are approximately 20 million tonnes per annum and are even larger for methanol, both with exist‐ing handling and safety considerations in use today which will need to be transposed to the bunkering industry.
4.6 Tank capacity
Tank capacity was used as a measure for space require‐ments on board.The size of the tanks directly affects the ease of retrofitting and, consequently, the adoption of the fuel.In comparison to VLSFO (the base case for comparison here), LNG and LPG require approximately 60% and 50%more tank space, respectively.Methanol, with a 130% in‐crease in tank capacity, can also be more readily adopted.Ammonia requires a 210% increase in tank space and may require space optimization.Hydrogen poses the greatest challenge, requiring a 320% increase in tank space, making it particularly challenging to adopt in deep-sea shipping.
4.7 Safety and handling considerations
Lastly, each fuel presents their own handling and safety considerations, making it more (or less) straightforward to adopt them.LNG, LPG, ammonia, and hydrogen all re‐quire liquefaction, with ammonia and LPG at a required temperature of –33 ℃, needing the least amount of energy and isolation in the infrastructure.LNG, at a required tem‐perature of –153 ℃, requires entirely dedicated and costly infrastructure whereas hydrogen, at –253 ℃, a tempera‐ture close to absolute zero, will also need dedicated and ex‐pensive infrastructure.All liquefaction comes at an energy cost, in line with the temperature required.Hydrogen and LNG will require the most energy to liquefy, with hydro‐gen liquefaction consuming up to 30% of the energy con‐tained in the hydrogen.Methanol is liquid at atmospheric conditions however requires very clean tanks to avoid con‐tamination.In addition, methanol requires inert gas, such as nitrogen, to be used during loading and discharge to pre‐vent an explosive air mixture in the cargo tanks.Finally,ammonia does not easily ignite and hence requires a low autoignition temperature fuel such as diesel or even hydro‐gen to be injected in the engine.This entails availability of these fuels on board and dedicated tanks.

Table 5 Alternative marine fuel prices in $/mt and $/1000 MJ (June 2022)
5 Conclusions
Adopting energy carriers (fuels) with lower or zero GHG footprint is a promising route for shipping to cut car‐bon emissions.Implementing renewably sourced zero car‐bon fuels, such as hydrogen and ammonia, is the most promising, and perhaps the only, option to deliver the de‐sired GHG reductions for the maritime industry (Lindstad et al., 2021); although not the focus of this review, it must be noted that the upstream WtT emissions across all fuels can vary widely (European Parliament, Council of the Eu‐ropean Union, 2018).Hydrogen produced from renewable sources can achieve a WtW GHG emission reduction of 79.9% compared to conventional fuels.Similarly, ammo‐nia produced from renewable sources (green ammonia)can also achieve a 71.0% GHG emission reduction.
However, these GHG emission reductions are only achievable under the “cleanest” conditions.If hydrogen is produced from NG and used in the shipping industry as a fuel, the WtW GHG emissions will contribute to 96.2%more GHG emissions compared to conventional fuels.Fur‐thermore, if uncombusted hydrogen is released as a slip, it would amplify the GHG emissions as hydrogen has a GWP100 of 11±5 (Warwick et al., 2022).Similarly, if am‐monia is produced from NG and the current N2O emis‐sions are not abated, the use of ammonia as a fuel will re‐sult in a WtW GHG emissions increase of 140.0%.
Equally as important to considering these LCA emissions is the barriers to overcome to implement ammonia and hydro‐gen across the worldwide fleet: technical maturity, tank ca‐pacity and bunkering infrastructure are some of the key hurdles to overcome to realize a net-zero shipping future.
Competing interestThe authors have no competing interests to de‐clare that are relevant to the content of this article.
Open AccessThis article is licensed under a Creative Commons At‐tribution 4.0 International License, which permits use, sharing, adap‐tation, distribution and reproduction in any medium or format, as long as you give appropriate credit to the original author (s) and the source, provide a link to the Creative Commons licence, and indicate if changes were made.The images or other third party material in this article are included in the article’s Creative Commons licence, un‐less indicated otherwise in a credit line to the material.If material is not included in the article’s Creative Commons licence and your intended use is not permitted by statutory regulation or exceeds the permitted use, you will need to obtain permission directly from the copyright holder.To view a copy of this licence, visit http://creativecommons.org/licenses/by/4.0/.
 Journal of Marine Science and Application2023年4期
- Journal of Marine Science and Application的其它文章
- Review of Risk Analysis Studies in the Maritime LNG Sector
- Study on Flow-induced Vibration Characteristics of 2-DOF Hydrofoil Based on Fluid-Structure Coupling Method
- Design and Optimization of an Integrated Power System of Solid Oxide Fuel Cell and Marine Low-Speed Dual-Fuel Engine
- Environmental and Economic Evaluation of Dual-Fuel Engine Investment of a Container Ship
- Combustion Analysis of Low-Speed Marine Engine Fueled with Biofuel
- The Potential of Inedible Biodiesel as an Eco-Friendly and Sustainable Alternative Fuel for Marine Diesel Engines in India