
Direct measurement of an energy-dependent single-event-upset cross-section with time-of-flight method at CSNS
2023-03-13 09:18BiaoPei裴標ZhixinTan譚志新YongningHe賀永寧XiaolongZhao趙小龍andRuiruiFan樊瑞睿
Chinese Physics B 2023年2期
Biao Pei(裴標) Zhixin Tan(譚志新) Yongning He(賀永寧)Xiaolong Zhao(趙小龍) and Ruirui Fan(樊瑞睿)
1Spallation Neutron Source Science Center,Dongguan 523803,China
2Instituteof High Energy Physics,Chinese Academy of Sciences(CAS),Beijing 100049,China
3School of Microelectronics,Xi’an Jiaotong University,Xi’an 710049,China
4State Key Laboratory of Particle Detection and Electronics,Bejing 100049,China
Keywords: static random-access memory,soft error rate,neutron SEU cross-section,time-of-flight
1.Introduction
Single event effects (SEEs) are running errors in semiconductor devices caused by a single,energetic particle which originates from cosmic rays and/or their showers.SEEs take place anytime and anywhere,from the galaxy space or the near space where satellites fly-by to the territorial ground where mankind lives.[1]In order to emulate their impacts to semiconductor devices, many particle facilities (for protons, neutrons and also ions)were built to provide test beams with a resemble spectrum.Special efforts were put up for neutrons as they are hard to generate and control.In particular, atmospheric neutron beam lines from spallation neutron sources are in the center of attention,such as FP30L at LANSCE,since neutrons are the dominant irradiation source in the territorial environment.However,atmospheric neutron beams only address a group of common applications in the SEE tests.As mankind explores the space,[2,3]more demands with diverse neutron spectra will be encountered.In these cases, previous method with a test beam of a specific spectrum is no longer applicable.The requirements for a diversity of applications demand a new way with a profound comprehension in SEEs,in particular,a study on their cross-section with a variety of neutron energies.
There are kinds of effects caused by neutrons.The most common one is the single event upset(SEU),which is a state change in logic or bit-flips in memory.SEUs are ‘soft’ and non-destructive.It has been widely investigated.Although SEU research with single energy points had been collected for energy-dependence evaluation years ago, the summary is limited by the data points.Furthermore,the results in Johansson’s work[4]and a later report from Dyer[5]show a contradiction in the general trends range from 1 MeV to 200 MeV,which may be resulted from different devices and experimental conditions.In this perspective, an atmospheric-like neutron beam line with a wide spectrum is very suitable for the task of the cross-section measurements.In 2020, a pioneer work in energy dependence of SEU cross-section was reported by Iwashitaet al.[6]They exploited the hardware router and logic comparator within the chip to construct an energy-resolved measurement of SEU induced by the pulsed neutron source with tolerances in nanoseconds.Specifically,they focused on the soft errors that take place in the configuration random access memory(CRAM),which is a configurable static storage resource inside the chip.Circumstantial information indicates that commercial Xilinx FPGAs were adopted in the research.[7]Iwashita’s results suggest that the SEU cross-sections are steadily increased from 1 MeV to 20 MeV and show a plateau when the neutron energy is greater than 20 MeV.Apparently,these results are more elaborate than previous reports.However,the experimental design in Iwashita’s report is sophisticated.As the total size of CRAM in programming is out of control,authors introduced another cyclic redundancy check board to evaluate the total upsets, which makes the test complicated.
The Back-n beam line is a white neutron test beam with a wide neutron spectrum range from 1 eV to 200 MeV at the China Spallation Neutron Source(CSNS).[8,9]The most probable energy of Back-n beam line is about 1 MeV and the portion of neutron energy greater than 1 MeV is about 48.2%.[10]Many SEE tests were accomplished at the Back-n neutron beam line and it has been a good alternative for semiconductor device tests before the atmospheric beam line (BL11) of CSNS completes its construction.Driven by 1.6 GeV protons,the atmospheric neutron irradiation spectrometer(ANIS)of CSNS is a promising test station to deliver a full spectrum neutron beam from MeV to GeV, which will be even more comparable to the territorial neutron environment than ICE House@LANSCE.Except the atmospheric beam line(BL11@CSNS)at 41°,Back-n beam line is the only fast neutron beam line that directs to the spallation target and outputs MeV neutrons without moderators.Back-n is initially designed for nuclear data measurements with a maximum flight path of 78.2 m which result in a good energy resolution in the range of resonance neutron spectrum.[10]The long flight path endows Back-n beam line an advantage in energy-resolved applications and research, such as energy-resolved neutron imaging.[11-13]As an atmospheric-like beam line,a comparison of Back-n beam line with other fast neutron beam lines for SEE irradiation in spectra may help to explain the situation.[14]Figure 1 lists the fluence of five fast neutron beam lines in the world and the JEDEC, IEC references.The label ‘Y’ means the sum of fluence in a year.As shown,the IEC*Y may serve as the upper limit among these lines while the JEDEC*Y is almost the prescribed minimum.FP30L@LANSCE has the most similar spectra shape to that of the JEDEC standard,which makes it the most favorable atmospheric neutron test site.The section in 10-200 MeV of TRIUMF NIF is the largest one,which is suggested to be helpful in the SEE tests.ANITA is a neutron facility driven by 180 MeV protons for accelerated single event effect tests,and is operated at the Svedberg Laboratory in Uppsala, Sweden.The spectra of VESUVIO@ISIS and Back-n@CSNS drop rapidly when the neutron energy is greater than 100 MeV.They are described as ‘soft’beam lines.In fact,the portion of Back-n flux from 1 MeV to 20 MeV is significantly higher than that of other white neutron sources.This may be helpful in the investigation of the threshold energy of SEU,and it also suggests that the Back-n beam line has a chance to get a better cross-section result at the energy of several MeV.In addition,Fig.1 exposes a fact that all five spectra are different from the realistic standard, and are just varying in degrees.
To keep the test simple and compact, we prefer to measure directly the SEU bits in the block random access memory(BRAM)induced by neutrons.BRAM is a block memory that embedded throughout the FPGA which is often used for large data storage.They are continuous bits with excellent time performance.This feature is very useful when constructing modules for the time-of-flight measurement.The next step after determining the method and the objects is the technical scheme,including the chip selection and the circuit design.As a test in nanoseconds, the running clock of the circuit is important and will greatly influence the consuming time.A chip with high running frequency means a faster reading time and a smaller time shift error in SEU identification.Thanks to the advances in the semiconductor industry, commercial FPGAs with a frequency in hundreds MHz is very common nowadays,such as Kintex series in 28 nm from Xilinx Corp.Except the running frequency, the bit size of RAM for SEU tests is also related to the time consumed in the reading, which makes a great impact on the timing error in the time-of-flight (TOF)measurements.There are two effects caused by the bit size.On the one hand, under the same condition, the SEU occurrence is proportional to the used bit size.On the other hand,although a hardware parallel power could be exploited by circuit redesign, the size and depth of the RAM will increase the circuit complexity and eventually prolong the measurement time since the discrimination of the soft error consumes a certain time of locating and reading.Thus,an FPGA circuit with proper design is critical for the TOF measurements.In this test,we prefer to read a small memory of 400 kbit with a Xilinx chip running at a clock of 500 MHz.
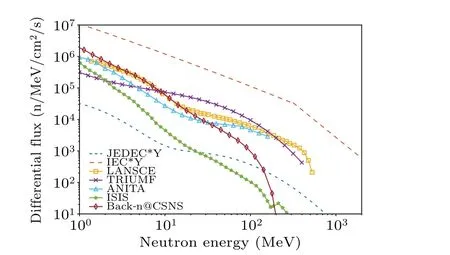
Fig.1.Comparison of the spectra of the CSNS Back-n white neutron source,the other white neutron sources and the JEDEC,IEC standards.The label‘Y’represents an accumulation of fluence in a year.
2.Experimental measurement
The experiment was performed at the CSNS Back-n beam line end station#1,which is 57.2 m far from the spallation center,as illustrated in the upright of Fig.2.The schematic in the left bottom of Fig.2 presents the experimental setup.Most of the devices are arranged in the underground tunnel and the experimental instructions are operated remotely in the control room.Fast neutrons are travelling from the left to the right,as indicated by the yellow horizontal arrow.The device under test(DUT,Kintex-7 chip)was installed in the center of the incident flange of a vacuum chamber,and been collimated by the laser markers.In order to timing the soft errors, another Spartan-6 FPGA communication board was fixed outside the beam spot.A local computer was setup in charge of the operation for the FPGA boards.The time-of-flight measurement was triggered by the signal from the rapid cycling synchrotron(RCS) kicker, as the red line shown in Fig.2.As shown, the kicker signal was extracted from the head of the ring target beam transport line and traveled near light speed with a short path.In this way,we constructed the trigger signal before the neutrons for TOF measurements.
As a station for nuclear data measurement, the spectrum of Back-n beam line was measured accurately with a fission cross section measurement (FIXM) detector.[8]Started from its commissioning, several long-term spectral measurements demonstrate that the spectrum of Back-n beam line is very stable.Thus,no fission ion chamber was arranged after the DUT in this experiment and the spectrum data was inherited from its former measurements.[10]
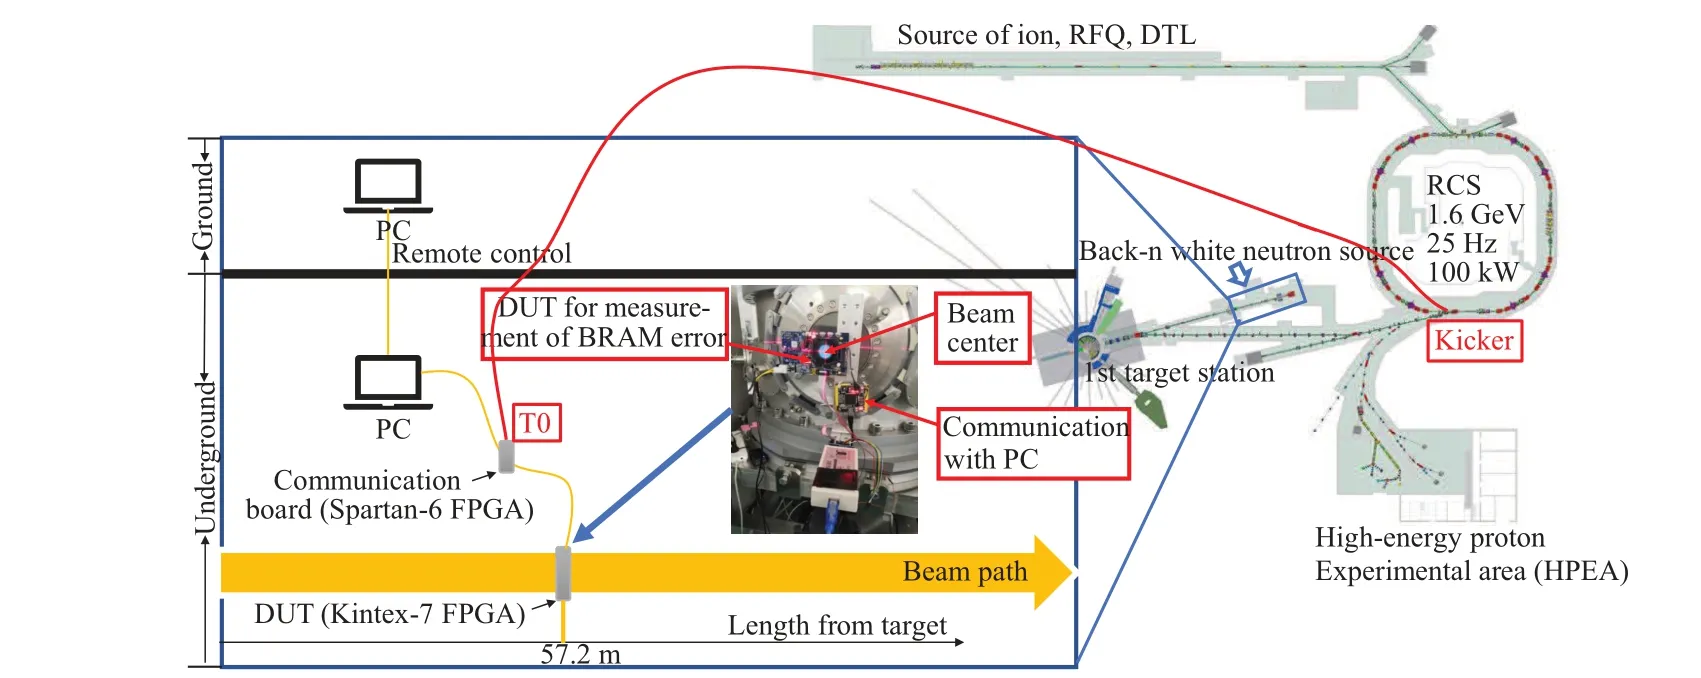
Fig.2.Schematic of the experimental setup at the CSNS Back-n white neutron source.Neutron beam transfer from the left to the right and the DUT was install in the center of the beam spot.
2.1.SEU cross-section
As mentioned,to estimate the DUT reliability,the soft error rate(SER)in a specific neutron irradiation is defined as an integration of SER within each energy section[6]
whereσSEU(En)is the SEU cross-section at each energy sectionEn,Nbitsis the number of bits in the sample under test,andΦ(En)is the spectral fluence of neutron in units of n/MeV/cm2which designates the radiation fluence of the device in the test.Thus,the SEU cross-section is written as
whereNSEU(En) is the number of soft error induced by neutrons within energy section ΔEnin the experiment.As illustrated in Fig.2,the soft error induced by neutrons will be registered by DUT output while its corresponding energy is measured by a timing process via time-of-flight method.
2.2.Time-of-flight method
Neutron TOF technique is a general method to determine the kinetic energy of a traveling neutron, by measuring the time it takes to fly from the spallation target surface to the circuit detector.The neutron kinetic energy is obtained from the time Δtand the distanceLby the following equation:
wherem0is the rest mass of a neutron,cis the speed of light andv=L/Δtrepresents the velocity of the neutron,nonrelativistic in usual.
In simple, we need to counter the SEUs and record its flight time Δt=tstop-tstart.However,the crux of a TOF measurement is to determine the start time and the end time of the neutron flight.Figure 3(a)shows the time relation within the measurements.As shown,it comes naturally that the timeTseu,when the soft error was registered,is set as the end time of the neutron flight.Since the maximum neutron energy of 200 MeV at the Back-n beam line is much lower than that in LANSCE, and the main section of Back-n spectrum is along the low energy section,as illustrated in Fig.1,the result is that the soft error counter histogram in time-space will have a slow increase,which suggests a large error if we determine the start time by the fastest neutrons.Therefore, in our measurements the start time cannot be treated like that in LANSCE, and a calibration of the start time(also written asT0)is demanded.
Figure 3(b)presents an oscilloscope shot with annotations for theT0calibration.A vertical dotted line in purple represents the start timeT0when neutrons begin to fly.However,it is unknown and we need to figure it out.As mentioned,the CSNS beam profiling system provides bunch signals from the ring kicker, annotate asTk.Since the rising edge of kicker signals (Tk) is very stable, the kicker signal is often used to synchronize other devices after it.In our test,each TOF measurement was triggered by theTksignal,as the green line with legend CH2 plotted in Fig.3.When the test was being carried out, a C6D6 gamma detector was arranged in the end-station#2 to record the gamma flash signal, as shown in the red line with legend CH0.The gamma flash is a phenomenon of burst gamma emission which is concurrent with the spallation and the neutron flight.The blue line in Fig.3(b)is another trigger signal from a fast-current-transformer(FCT)which is not used for this analysis since it is later than the gamma flash.
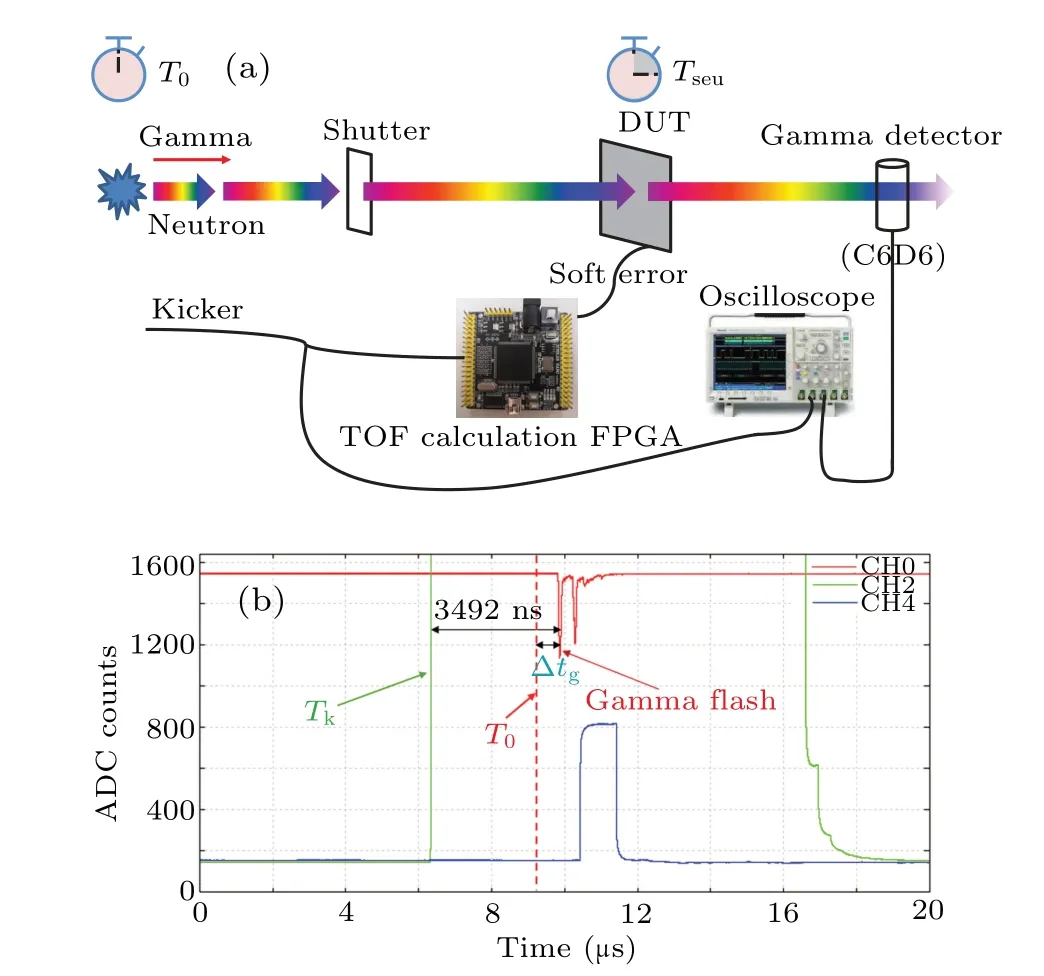
Fig.3.(a)The experimental configuration and time relation within the measurements.(b) T0 calibration for TOF measurements.The green line Tk is the kicker signal input to the FPGA circuit to trigger the TOF measurement.The prompt gamma burst of the first bunch is 3492 ns later behind Tk and the time for a photon to travel 76.2 m is 254 ns.
As shown, the peak of the gamma flash caused by the first proton bunch is ΔTd=3492 ns behind theTksignal.In addition, since the detector is located 76.2 m far from the spallation target, a correction of the transportation time of gamma ΔTg= 254 ns from the target to the detector position is demanded.So, the start time of the neutron flight isT0=Tk+ΔTd-ΔTg.The flight time of a neutron soft error is written as
whereTkis the kicker signal injected into the communication board to trigger the TOF measurements, andTseu-Tkis the output from the communication board.
2.3.Circuit design for high-speed SEU detection
Figure 4 presents the schematic diagram of the register transfer level (RTL) circuits designed for the cross-section measurements.As shown in Fig.4(a),BRAM modules are the core units in our design.40 modules are constructed in the test and each module outputs only one bit to flag whether a soft error occurs.The module bit size used in the test is 320×32 bits.In details, each module includes 5 BRAM blocks.They are configured as 512×72(four blocks)and 512×36(one block),respectively.So the total bit number is 512×(72×4+36).Therefore,partial bits(320 out of 324)and addresses(32 out of 512) are used to construct the soft error detection logic.Similar to Iwashita’s report,[6]the soft error probe is completed by logic comparators.As shown in the magnified drawing,all 320 bits are split into 20 groups.Initially,every bit is initialized in‘0’.To start with soft error detection,each group of 16 bits is input into a NOR gate.Then, the output from NOR signals will pass a two-level AND operation.Finally, a flag bit,whose change represents a upset occurs,is output for further process.The direct and parallel logic connection in the module results in a real time state detection.So whenever a bit upset within the BRAM module is detected,an error signal is output as a TOF stop which designates a soft error occured.In addition,the above process is implemented in a finite state machine(FSM),which describes the sequential logic.
The circuit of the TOF board is presented in Fig.4(b).It is a Spartan-6 chip running at a frequency of 200 MHz.The kicker signalTkinstructs the start of the TOF measurements.An automatic counter realtime reg is cleared by the rising edge of theTksignal every 40 ms, indicating the start of a new round.Whenever the rising/falling edge of the error signal occurs,the real time register will latch the value of the realtime reg counter to get the neutron TOF time induced by the soft error.Finally, the time difference (Tseu-Tk) as the timing result is sent to PC via an UART module.Figure 4(c)analyzes the time sequence during a whole SEU detection.In fact, there are various time delays in the signal processes which should been calculated carefully.Suppose that the two asynchronous signals (kicker and error) have the same time difference compared to the clock edge.As shown in Fig.4(b),the regtime reg counter is cleared by the kicker signal with two cycles delay,which means 10 ns will be consumed at the beginning of the TOF.However,before the SEU event is registered,another consumed time should be evaluated.The SEU flag signal requires a delay of 3 cycles in the Kintex-7 chip and 2 cycles in the S6 board before the value of the reltime reg counter is latched.This process takes 16 ns before a SEU event is registered, as shown in Fig.4(c), which means that the neutron TOF has been increased by 16 ns.Therefore, the time delay in the circuits is 16-10=6 ns, which should be subtracted in the final result.In the end,the circuit was tested before the real experiment.Figure 4(d)presents our HDL simulation result.As shown,after the emulated upset event is injected,each process in Kintex-7(FSM,comparator and DFF)takes 2 ns and an error signal is successful raised after that.However, the time difference between the two asynchronous signals relative to the clock edge cannot always be equal, so there is a maximum time shift of±5 ns in our formula,which will eventually be expressed as an energy uncertainty in the following calculation.
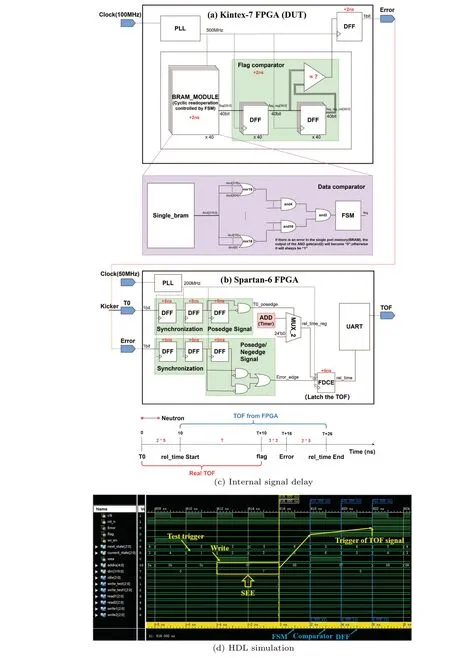
Fig.4.Schematic diagram of RTL for high-speed SEU detection and TOF measurement circuits.(a)Kintex-7 FPGA,it is the device under test(DUT),which operates at 500 MHz and outputs a signal that triggers the TOF calculation when a soft error occurs.(b)Spartan-6 chip,running at a frequency of 200 MHz,and outputs the neutron TOF time.(c)Analysis of FPGAs internal signal delay.(d)HDL simulation.
3.Result analysis and discussion
The experiment took 104.5 hours with 908 effective SEU records in total.The time-of-flight count histogram shows a ragged edge due to the scarce events, as shown in Fig.5(a).As predicted,the soft error counts are increasing much slower than that in Iwashita’s report.[6]The count curve reaches its peak of 44 at a time about 1000 ns,and then they are decreasing steadily.
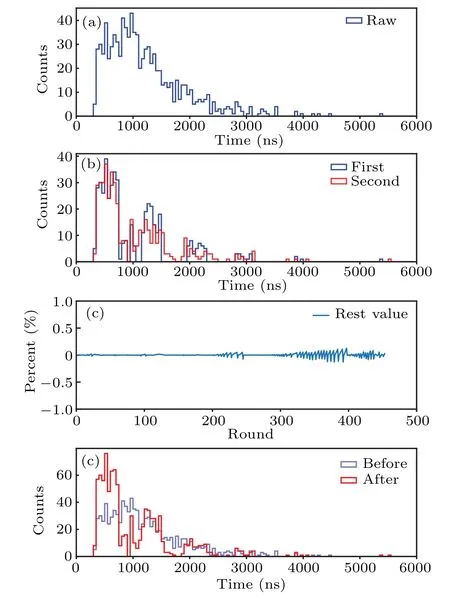
Fig.5.Results of the time-of-flight spectra for the SEU counts and the unfold process.The total soft errors in DUT are 908 counts.
The CSNS is a pulsed neutron source running at a frequency of 25 Hz.Meanwhile, the time structure of its driven proton consists of two bunches, with a separation of 410 ns.It is a common design for modern accelerator and spallation station to increase its yield for hot/cold neutron applications.However,this time structure makes a big obstacle for the TOF measurements,especially for fast neutron.So,the most tricky work is the unfolding of the data since it is hard to accumulate enough counts(such as millions of events within 100 bins per degree for flux measurements) in the SEE experiment in order to satisfy the statistics requirement for the process.[15]Therefore, we drop the histogram concept and the minimal unit of the unfolding falls to single event.However,neither it is scarce enough to be completed with eyes.Thus, we developed a new method to tackle the separation process.The basic hypothesis of the unfolding is that the two hunches will have the same physical consequences except a time separation.The fastest SEU event must be attributed to the first bunch while its corresponding event in the second bunch should be 410 ns later after it.This process is called a pairing.In practice, the nearest event to that time tick will be assigned to the second bunch.Therefore,the first unchecked event is assigned to the first bunch, while the nearest event after 410 ns to the second bunch,and then the pairing is repeated.Apparently,there will be a difference between the real position and the expected position when looking for the nearest event from the second bunch.However,that difference is indicative.We kept that as a residue which will be balanced in the next searching process.The unfolded result is presented in Fig.5(b).The blue and red lines are the SEUs attributed to the first bunch and the second bunch,respectively,with a time correction.As shown,the first and the second bunches show a good overlapping, especially in the first peak region.The line in Fig.5(c) represents the ratio of the time residue with respect to the separation interval.The up and down fluctuations around thex-axis suggest that the balance technique helps to control the residue during the pairing.As shown, there are three fluctuation regions after the unfolding process.The most ragged position is near the 400th pair, which corresponds to the second peak region in Fig.5(b).This is consistent with the data in Fig.5(b).The result demonstrates that our unfolding is coherent and correct.Figure 5(d)shows the final result after unfolding.The unfolding process makes a big influence on the distribution,turning it from a relative smooth distribution into an ragged one.

Fig.6.Measured neutron spectral fluence Φ(En).
Figure 6 presents the fluence during the test,where a maximum fluence over 1×10¹²n/cm2/MeV was achieved.The bit SEU cross-section ranging from 0.5 MeV to 200 MeV is presented with the red dots and line in Fig.7,including the error bar.As shown,the large time uncertainty results in a wide energy uncertainty,which is concerned in high energy region.However,an overall trend is upward as a function of the neutron energy.For clarity, a magnified picture is inserted in the bottom center to show the details in the energy section from 0 to 10 MeV.The longest TOF time is 5955-410=5545 ns,which corresponds to a neutron single upset event with energy 557 keV (second bunch), while its pairing event in the first bunch is 5350 ns/598 keV.The result confirms that the SEU occurred much below the threshold energy of the nuclear cross-section of silicon(2.75 MeV),which is consistent with Iwashita’s report.Such a low energy is beyond the conventional recognition, which raises the hypothesis of its relationship to the manufacturing scale.Further investigations in both experimental tests and Monte Carlo simulations are demanded.In addition, the time-of-flight in the energy section near 0.5 MeV is about 5850 ns, where the energy resolution is little than 5% at the Back-n beam line.[10]Thus, it is also demonstrated that the measurement with a pulsed spallation neutron source is a reliable method for the critical energy investigation.Since the fluence data are accumulated in a longterm measurement, the contribution from fluence can be ignored,and the statistical errors of the cross section are mainly determined by the event counts.The difficulty in this SEU test is the little event count, which is caused by the small cross section.Since only one DUT was installed,the calculation of the margin of error relies upon the sample size, which is the count numbers in the bins.As shown in the unfolded ToF result in Fig.5(d),the count number in the high energy region is near 80,which results in an error of about 11%.Thus the high energy region shows a small statistical error while a relatively obvious error bar in the low energy region.For an average energy of 5.6 MeV,however,the unfolding process dramatically reduces the count number, which illustrates a remarkable error in the insert.The influence of the unfolding process will be discussed later.In addition,the highest data points display an obvious deviation,which may be attributed to the division process since the flux drops very quickly when the neutron energy is close to 200 MeV.It will be excluded in the following fitting process.
One detail that is easily overlooked in Iwashita’s report is the start energy in the cross-section plot which was fixed as 1 MeV,this is incoherent with their TOF histogram.As illustrated,the interval of proton bunch in WNR station is fixed as 1.8μm, and the soft error event is not ended before 1800 ns.The maximum time interval of 1800 ns in the TOF histogram designates a neutron energy of 650 keV.Thus, as a matter of fact, Iwashitaet al.had measured a threshold energy, which is very close to our result.However,the discussion in Ref.[6]was short and soft errors lower than 1 MeV were ignored.A possible explanation is that these data were regarded as unreliable for the statistics reason.Nevertheless,the critical energy for neutron SEU events and its relation with manufacturing scale are very important questions.Obviously, a conclusion that the threshold energy less than 2.75 MeV is insufficient.The real reason why they gave up on the discussion may be that they noticed the threshold energy is out of their capability,and the discussion on the critical energy can not be completed.Thus, the Back-n beam line has the chance in this subject.In fact, the long flight path of the Back-n beam line meets the TOF measurement down to epicadmium neutron, which means it is possible to catch the soft error caused by even low energy neutrons.In addition,the interval of 1.8μm discussed above is originated from micro-pulse setting at WNR beam line,which is a counterpart to our double bunch mode.However,the superposition of events was not mentioned.
To evaluate the result, we have to compare it with other reports.Since the design rule has a great impact on the SEU cross-section and the manufacturing node has made rapid progress over the years, we have to focus on the literature of the last five years.Obviously, the report from Iwashitaet al.cannot be ignored.As shown, the cross-section data from Iwashitaet al.plotted in blue asterisks are about an order of magnitude smaller than our results.Another SRAM neutron SEU measurement with mono-energy neutron 2.5 MeV and 14 MeV from Chenet al.is considered here.[16]Their DUTs were manufactured with the latest design rule of 40 nm,which attracts our interest for the comparison and other details are ignored.As shown, their SEU cross-sections are much higher than our result in the same energy.In addition,soft error test data are important indices in order to help customers design products for the high reliability market,and also many chip manufacturers publicly release their reliability data results.Xilinx Corp.has published its soft error data in their chip user guide, including both CRAM and BRAM.[17]As listed in Table 20 of Ref.[17], the BRAM in Kintex-7 chip has a cross-section of 5.57×10⁻¹⁵cm2per bit with an error of±18% according to the LANSCE test, while the CRAM cross-section is 5.69×10⁻¹⁵cm2/bit,very close to that of the BRAM.Although these results are only coarse cross-sections in total spectrum, they may serve as an average of the SEU cross-sections for our comparison.The manufacturer BRAM cross-section is plotted as the horizontal purple dash-dotted line in Fig.7.As shown, the average cross-section line from the Xilinx is higher than the blue asterisks from Iwashitaet al.A common sense is that an average value of many sections should be in the middle of the whole data.Thus,considering the authority of the manufacturer data and their sufficient test in beam time,the result from Iwashitaet al.is doubtful if they did use the same Xilinx series chip in the tests.In our opinion, the complex experimental design should account for the situation.Thus, although there are some fluctuations, the red dotted result in our test is a reasonable result.
Another valuable topic is the subject of test data equivalence between the Back-n beam line and the FP30L@LANSCE.Some former report also touched the issue with a coarse estimate.Here we may repeat it in order to have an extensive comprehension.In our case,a coarse estimate of SEU cross-section with respect to the Back-n beam line will result inσseu=N/(Φ·tbits)=908/(1.62×107×η×T×400 kb)=7.55×10⁻¹⁶cm2/bit,whereη=48.2%represents the ratio of neutron with energy great than 1 MeV.[10]Since the spectrum of the Back-n neutron beam line is much different from that of LANSCE, these two experiments cannot be compared directly.Nevertheless, a previous experimental report may help in the issue.[18]Wanget al.had compared the SEUs result from the Back-n beam line and the JEDEC atmospheric environment.They concluded that the‘soft’characteristics of Back-n beam line will exaggerate the beam fluence which decreases the SEU cross-section.As listed in Table 6,[18]for HM62V8100 SRAM and considering a threshold energy of 0.6 MeV, a correction factor of 5.56 was suggested by the authors.Therefore, if the difference between LANSCE and the JEDEC standard is ignored, the total SEU cross-section of 4.2×10⁻¹⁵cm2/bit in our test is close to the result(about 5.6×10⁻¹⁵cm2/bit)provided by the chip manufacturer.In short,importing a correction factor to convert the SEU cross-section between different test stations is an effective method for a coarse data equivalence.The above estimate also suggests that no systematic error was included in our result.In addition, the measured threshold energy of 0.5 MeV also confirms the speculative energy value in report.[18]
As suggested,[19,20]the SER cross-section is usually formulated in the 4-parameters Weibull function
whereσsrepresents the saturated cross-section andEcis the critical energy.The fitted line is plotted in black(dashed line)and the parameters are labeled upon the line in the upper center of Fig.7.The coefficient of determinationR-square=0.9386 suggests the fitting is fine, except for some fluctuations.The critical energyEc=0.545 MeV is consistent with our experimental observation.
Although the fit shows a good result,there are some fluctuations in the bit cross-section curve which are related to the valleys in the counter histogram of Fig.5(d).Since the coarse estimate is consistent with the manufacturer’s data, the total SEU counts are as expected.Therefore,an explanation is that events in this energy section were counted in its neighbor bins due to the TOF timing error.With this in mind, we explore the time shift in neutron energy.There are two sources of time uncertainty in Eq.(4), including both the start timeT0and the end timeTseu.The uncertainty in the start time should be attributed to the time structure of protons at CSNS.Except the separation of the two proton bunches,the pulse width of a proton bunch is about 80 ns at the running power of 100 kW.The spallation neutron bunch is suggested to have an equivalent pulse length for any energy section.Therefore, since it is impossible to distinguish whether the neutron comes from the proton bunch head or its tail,the TOF start has a time uncertainty of 80 ns.The second time uncertainty comes from the reading process.Since the target BRAM is 32 bit in depth,the reading process will consume 32 cycles which means a time uncertainty of 64 ns.In addition, a time shift of 5 ns in the asynchronous case of the Spartan-6 board had been mentioned.Therefore,the maximum time uncertainty in total will be 80+64+5=149 ns.The error bar inx-axis in Fig.7 presents the corresponding energy uncertainty.As shown,the fixed time uncertainty expresses a large energy uncertainty in the high energy region while a much shorter error bar is shown in the range of 1-10 MeV.However,the insert also shows two points deviate the fit curve,which is corresponding to the valleys in Fig.5,and we will explain its origin below.
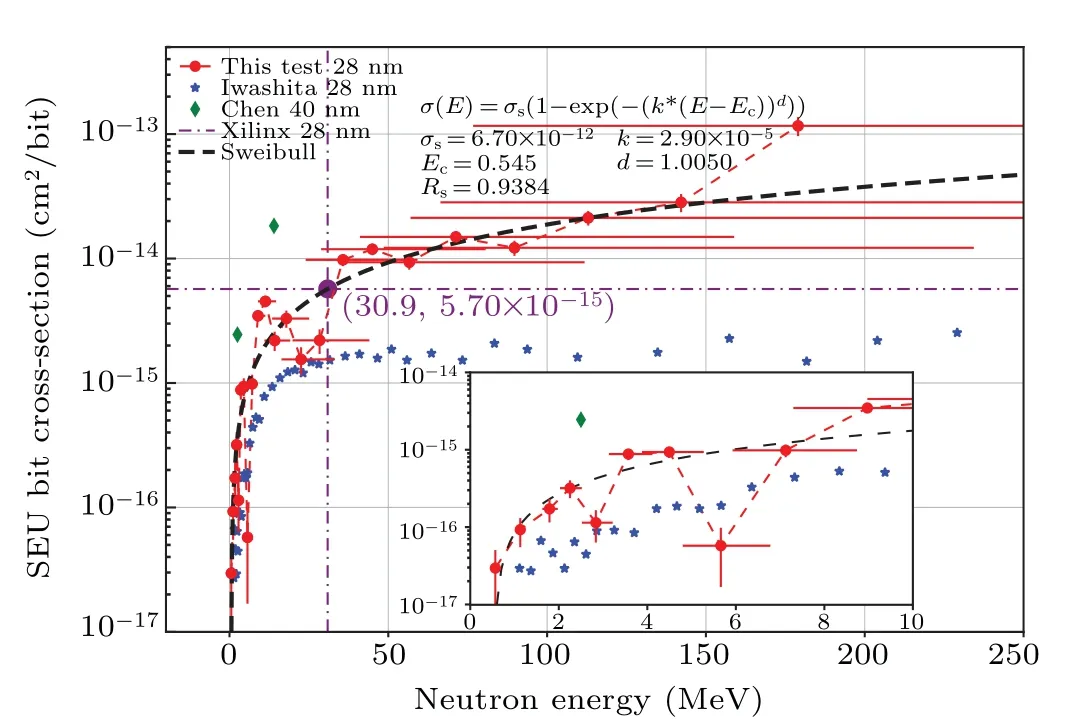
Fig.7.Result of neutron SEU cross-section for the SRAM-based FPGA.The red dotted line is the bit SEU cross-section measured in this test.The blue asterisks are the result from Iwashita’s report in LANSCE.[6] The green diamonds are the mono-energy cross-sections results in Ref.[16].
Since it is impossible to get the accurate time, the event may occur in every tick in a time window with a width similar to the total uncertainty.So,the measurement uncertainty may act like a moving window which smooths the counts in time series.In common, the stacking under double-bunches mode will result in an obvious shoulder shape in its time histogram.But, the moving effect of the time uncertainty smooths the curve in to a relative gentle one.Unfortunately,the consequential double-bunches unfolding process breaks the smoothed count histogram into a ragged state with peaks and valleys.In short, both the time structure of double bunches and the moving window should be responsible for the fluctuations.Although the CSNS accelerator has a single bunch mode,the cost is that the neutron flux at each terminal will be reduced by half.Obviously, it is hard for other beam lines to accept the single bunch mode as a long term running state.Although the single bunch beam time is very scarce, we wish to make a test with single bunch mode in the future.
In addition, although from the perspective of a single event, the bunch interval of 410 ns is like a big time uncertainty, it is should be regarded as a ‘fog’ before the truth and the underlying physics could be unveiled with the unfolding process.This has been proven by many experiments, such as time-of-flight spectrum test and nuclear data measurement.[8,10,15]The only difference is the size of statistics.Our test had collected 908 events in nearly 5 days and the size number is decent.Therefore,although the data set is not good enough, the result is acceptable for a SEE test.Meanwhile,for a small cross section and/or little fluence,the small number is inevitable at the very head or tail.The small number of soft error in low energy also has important physical meaning,otherwise,the investigate and discuss of the threshold energy will fall in vain.As to the reading depth of 32 bit,since we have a 80 ns proton bunch, a reading time uncertainty of 64 ns is acceptable.As an attempt,we prefer to a small number of BRAM blocks with large reading depth to increase the bit size,which helps us in the RTL timing constraint.
Another important information in Fig.7 is the crossing point of the fitted line and the‘average’line.The correspondingx-tic of the crossing point suggests an ‘effective’ neutron energy at about 30.9 MeV, where the SEU cross-section induced by mono-energy neutron source will be equivalent to the one from ICE House at LANSCE.This is an important information to evaluate the similarity between a beam line and the atmospheric neutron environment if we regard the FP30L@LANSCE as the standard beam line for semiconductor device irradiation.However, the results from Chenet al.indicate that the effective neutron energy is below 14 MeV for their DUTs.In our opinion, it is unlikely that the effective neutron energy is as small as that,while some dozens of MeV is more probably in our guess.This should be checked in the future experiments.Further SEU cross-section measurements with mono-energy neutron higher than 30.9 MeV will help to verify the statement.If more measurements confirm our result with the concept of the effective neutron energy, it will be a new index to evaluate the characteristics of a beam line whether it is‘hard’as the atmospheric test beam line.
4.Conclusions
In summary,an energy-resolved single-event-upset crosssection measurement was performed with 28 nm BRAMs using TOF techniques at the Back-n beam line at CSNS.The result confirms that the soft error threshold energy is about 0.5 MeV,which is consistent with previous report.The comparison suggests that the direct measurement is a reliable method under this circumstance and the measured cross section is consistent with the manufacturer reliability data.In addition, an ’effective’ neutron energy is proposed as an index in order to evaluate the characteristics of an atmospheric test beam line.
Acknowledgements
Project supported by the National Natural Science Foundation of China (Grant Nos.2032165 and 62004158), the National Key Scientific Instrument and Equipment Development Project of China (Grant No.52127817), the State Key Laboratory of Particle Detection and Electronics(Grant Nos.SKLPDE-ZZ-201801 and SKLPDE-ZZ-202008),and the Special Funds for Science and Technology Innovation Strategy of Guangdong Province, China (Grant No.2018A0303130030).
猜你喜歡
肝博士(2022年3期)2022-06-30
公民與法治(2020年22期)2020-12-14
意林(兒童繪本)(2020年1期)2020-02-14
中國篆刻(2016年5期)2016-09-26
小天使·四年級語數英綜合(2016年6期)2016-06-24
新高考·高三數學(2016年1期)2016-03-05
中國學術期刊文摘(2016年4期)2016-02-13
詩選刊(2015年4期)2015-10-26
小朋友·聰明學堂(2009年11期)2009-11-28
雕塑(2000年4期)2000-06-24
- Chinese Physics B的其它文章
- Matrix integrable fifth-order mKdV equations and their soliton solutions
- Comparison of differential evolution,particle swarm optimization,quantum-behaved particle swarm optimization,and quantum evolutionary algorithm for preparation of quantum states
- Explicit K-symplectic methods for nonseparable non-canonical Hamiltonian systems
- Molecular dynamics study of interactions between edge dislocation and irradiation-induced defects in Fe-10Ni-20Cr alloy
- Engineering topological state transfer in four-period Su-Schrieffer-Heeger chain
- Spontaneous emission of a moving atom in a waveguide of rectangular cross section