
Effect of Tebuconazole exposure on oral Atenolol absorption in rats,based on bile acid homeostasis
2023-07-28 03:41TAOQuanXUYujingZHANGYufengTAOYuchenZHUANGXuzhenYINDengkeYANGYe
TAO Quan, XU Yu-jing, ZHANG Yu-feng, TAO Yu-chen, ZHUANG Xu-zhen, YIN Deng-ke, YANG Ye,2?
1.Anhui University of Traditional Chinese Medicine, Hefei 230012, China;
2.Anhui Provincial Key Laboratory of Pharmaceutical Preparation Technology and Application, Hefei 230012, China
ABSTRACT Objective: This study is aimed to explore the effect of triazole fungicide tebuconazole(TEB) exposure on the oral absorption behavior of atenolol (AT), based on the homeostasis of bile acids (BAs).Methods: TEB was daily gavaged to rats with 3 mg/kg dose for 28 days to establish the TEB-exposure rat model.The amounts of glycocholic acid,glycochenodeoxycholic acid, taurocholic acid and taurine deoxycholic acid in the small intestine contents of normal and TEB-exposure rats were detected by LC-MS/MS.AT (10 mg/kg) were gavaged to the normal and TEB-exposure rats, and then blood were collected from orbital venous plexus at predetermined time-points.The concentration of AT in plasma was detected by LC-MS/MS, and the pharmacokinetic parameters were calculated by the DAS pharmacokinetic software.An intestinal circulation perfusion model was established in normal rats, and perfused with the perfusates containing the model drug of fluorescein and the BAs with the same compositions as the normal/TEB-exposure rats.After perfusion, the absorption and permeability of fluorescein in intestine were detected, as well as the oxidative stress status and ZO-1 expression level in the intestinal tissues.Results: Compared with normal rats, TEB-exposure increased the amounts of glycocholic acid, glycochenodeoxycholic acid, taurocholic acid and taurine deoxycholic acid in intestine significantly (P<0.001).In TEB-exposure rats, the maximum plasma concentration and area under the curve of AT were increased significantly than those of normal rats (P<0.05), and the peak time was significantly delayed (P<0.05).The TEB-induced BAs homeostasis perturbance increased intestinal permeability, and this effect was associated with the elevation of oxidative stress and the down-regulation of intercellular tight junction proteins in intestinal tissues.Conclusion:TEB-exposure can affect the oral absorption behavior of AT, which is probably related with the intestinal BAs homeostasis perturbance, thus it might affect the clinical efficacy and safety of this drug.
Keywords:
Tebuconazole
Atenolol
Bile acids
Pharmacokinetics
Tight junction protein
Oxidative stress
1.Introduction
Tebuconazole (TEB) is a highly efficient and broad-spectrum internal absorption triazole fungicide, which is widely used in agricultural production[1].TEB has a long half-life and can remain in various environmental media[2,3].Human beings may be exposed for a long time.TEB has been reported to be detected in the urine of children and adults[4].TEB inhibits ergosterol biosynthesis by inhibiting lanosterol-14-α-demethylase (CYP51) in fungal CYP450 family, resulting in fungal growth inhibition or death[5].However,a large number of studies have confirmed that azole sterilization can also inhibit the CYP450 enzyme system of mammals[6], so the inhibitory effect of TEB on CYP51 may not be specific.
CYP450 enzymes are monooxygenases containing iron porphyrin active sites, which play an important role in the metabolism of endogenous and exogenous compounds[7].A large number of clinical cases have reported that the use of azole fungicides may change the metabolic rate of other drugs due to the inhibition of metabolism-related CYP450 enzymes such as CYP3A4, 2C9 and 2C19, thus affecting their safety[8,9].In addition, CYP450 enzyme is also involved in the synthesis of a variety of endogenous compounds.In the liver, CYP7A1 and 27A1 catalyze cholesterol to produce bile acid (BAs)[10].As a physiological surfactant, BAs plays an important role in oral drug absorption.For lipophilic drugs,BAs increases the concentration gradient across epithelial cells by promoting drug dissolution, so as to enhance absorption through static water layers[11,12].For low-permeability drugs, BAs can promote the penetration of intestinal epithelial cells by increasing the permeability of biofilms and opening tight junctions[13,14].Atenolol (Atenolol,AT) is a second-generation β-receptor blocker,which belongs to class Ⅲ of biomedical classification[15].It has strong solubility, but poor gastrointestinal permeability.It is mainly used in the treatment of hypertension, angina pectoris,early acute myocardial infarction and arrhythmia.In the process of drug treatment, the premise of good therapeutic effect is that the blood concentration is in the treatment window.Abnormal blood concentration of AT may bring a series of adverse reactions such as hypotension, bradycardia, dizziness, fatigue and so on[16].
Based on the above analysis, we propose that TEB exposure may interfere with intestinal BAs homeostasis by affecting the activity of CYP450 enzymes related to BAs synthesis, resulting in additional safety risks for people in need of drug treatment.Allowable daily intake (ADI) is usually used to measure the safety of chemicals[17].Therefore, this study established a TEB rat oral exposure model based on ADI dose, simulated the effects of safe dose of TEB exposure on BAs homeostasis and AT absorption behavior in real life, and explored the mechanism of BAs homeostasis changes on drug absorption from the perspective of intestinal barrier through intestinal perfusion model.The results of this study can provide experimental basis for the effect of TEB exposure on drug absorption and help people to recognize the risk of environmental pollutants to specific populations.
2.Materials and methods
2.1 Chemicals and the main instruments

Qtrap5500 liquid chromatography-mass spectrometry (AB SCIEX company, USA); Themo Scientific Syncronis C18 column (2.1 mm × 100 mm, 1.7 μm); 5300XR high speed freezing centrifuge(Eppendorf company, Germany); constant current pump type Dmuri 200B (Jiapeng Technology Co., Ltd.); Milli-Q ultrapure water system (Millipore company, USA); DM2000 fluorescence inversion microscope (Lecia company, Germany); SpectraMax i3x multifunctional enzyme labeling instrument (Thermo Scientific company, USA).
2.2 Animas
Male Sprague Dawley rats (8 weeks old, SPF class, weight 220-240 g) were purchased from Pizhou Dongfang Culture Co., Ltd.,animal production license No.SCXK Su 2017-0003.The rats were fed adaptively for a week before the start of the experiment.This study was approved by the Experimental Animal Ethics Committee of Anhui University of traditional Chinese Medicine.
2.3 Establishment of a rat model of TEB exposure
The United States Environmental Protection Agency stipulates that the risk reference dose of a chemical substance is the product of the ADI dose and the safety factor, which is usually 100[18].The ADI dose of tebuconazole was 0.03mg/kg, so the dose was determined to be 3 mg/kg[19].After a week of adaptive feeding, TEB was dissolved in 0.5% CMC-Na, and the rat model of TEB exposure was established by intragastric administration of 100 g/mL volume and 3mg/kg dose for 28 d.During the establishment of the model, the appearance and body weight of rats exposed to TEB were observed.
2.4 Determination of BAs content in intestinal contents
2.4.1 Sample treatment and analysis
After modeling, the rats were killed, and the small intestinal contents of normal (NC) rats and TEB exposed rats were taken, and 5 times the mass of ultra-pure water was added to make full vortex homogenate.The intestinal contents of 300 μL were homogenized,methanol of 1.2 mL was added, and mixed evenly.After 10 000× g centrifugal 10 min, the supernatant was taken for LC-MS/MS analysis.
2.4.2 Mass spectrometry and chromatographic conditions
The temperature of the electrospray ion source is 500 ℃, the spray voltage is ?4 500 V, the air curtain pressure is 232.4 kPa, the atomization pressure is 344.7 kPa, and the drying pressure is 344.7 kPa.The detection methods of GCA, GCDCA, TCA and TDCA were all negative ion multi-ion reaction monitoring, and the ions used for quantitative analysis were m/z 464.4 → 74.0 (GCA), 448.3→ 74.0 (GCDCA), 514.3 → 80.0 (TCA), 498.3 → 80.0 (TDCA)[20].The mobile phase was acetonitrile-water (65/35, V/V).The column temperature was 35℃, the flow rate was 0.2 mL/min, the injection volume was 2 μL and the running time was 12 min.
2.4.3 Exclusive investigation
Small intestinal contents of NC rats were removed and 100 mg/mL of activated carbon was added before vortex homogenate for 30 min.Then the supernatant was removed by centrifugation at 10 000 × g for 10 min to obtain a final sample of blank small intestinal contents removing endogenous BAs[21].The standard small intestinal content samples containing BAs were obtained by adding 200 μg/mL of GCA, GCDCA, TCA and TDCA to the blank intestinal content samples.Blank intestinal content samples, standard intestinal content samples containing BAs and intestinal content samples were processed and injected according to “1.4.1”method.
2.4.4 Standard curve and linear range determination
The standard intestinal content samples of GCA, GCDCA, TCA and TDCA with concentrations of 2.5, 5, 10, 20, 50, 100, 200,350, 750 and 1000 ng/mL were prepared with blank intestinal content samples, and the samples were treated according to the“1.4.1”method.The linear regression was made with the sample concentration (C) as the Abscissa and the sample peak area (A)as the longitudinal coordinate, and the regression equation was calculated.
2.4.5 Investigation of intra-day and inter-day precision and recovery
The quality control samples of low, medium and high concentrations (10, 50, 200 ng/mL) were prepared by adding GCA,GCDCA, TCA and TDCA to the blank small intestinal content samples, and 5 parallel samples were set up for each concentration.The injection was treated according to the “1.4.1”method, and the intra-day relative standard deviation (RSD) was calculated.The recovery rate was based on the ratio of the measured concentration to the actual concentration.The samples were determined repeatedly for 3 days, and the daytime RSD of the results was calculated.
2.4.6 Stability investigation
The “1.4.5”quality control samples were placed at room temperature for 24 h (room temperature stability) and at -20 ℃ for 7 d (freeze-thaw stability).The sample injection was determined according to the “1.4.1”method to investigate the stability of the samples.
2.5 Evaluation of oral absorption behavior of AT
2.5.1 Oral administration and sample treatment
NC and TEB exposed rats were fasted for 12 h before the beginning of the experiment, and the dose of AT was determined to be 10 mg/kg according to the clinical dose.After intragastric administration of AT, 0.5 mL of blood was taken from the orbit at 0.5, 1.0, 1.5,2.0, 3.0, 4.0, 5.0, 7.0 and 9.0 h, respectively.After 3 000 × g centrifugation for 10 min, 100 μL of the upper plasma was taken.The supernatant was analyzed by LC-MS/MS after adding 900 μL methanol, vortex mixing and 10 000 × g centrifugation for 10 min.The plasma concentration-time curve was drawn according to the plasma concentration of AT at different time points, and the pharmacokinetic parameters such as maximum plasma concentration(Cmax), area under the curve (AUC), eliminate half life, (T1/2) and peak time (Tmax) were calculated by DAS software.
2.5.2 Mass spectrometry and chromatographic conditions
The temperature of the electrospray ion source is 500 ℃, the spray voltage is 4 500 V, the air curtain pressure is 232.4 kPa, the atomization pressure is 344.7 kPa, and the drying pressure is 344.7 kPa.The detection methods of AT were positive ion multi-ion reaction monitoring, and the ions used for quantitative analysis were m/z 267.2 → 145.0[22].The mobile phase was acetonitrile-water(70/30, V/V).The column temperature was 30 ℃, the flow rate was 0.2 mL/min, the injection volume was 2 μL and the running time was 7 min.
2.5.3 Exclusive investigation
The blank plasma was obtained from the orbital blood of NC rats after centrifugation, and 200 μg/mL AT standard was added to it to obtain the drug-containing standard plasma sample.After intragastric administration of AT, the orbital blood samples of rats were obtained after 30 min and centrifugation.Blank plasma, drug-containing standard plasma samples and drug administration samples were treated and injected according to the “1.5.1”method.
2.5.4 Standard curve and linear range determination
AT plasma samples with concentrations of 1, 2.5, 5, 0, 20, 50,100, 200, 400 and 800 ng/mL were prepared with blank plasma.According to the sample treatment operation of “1.5.1”, the linear regression was performed with the sample concentration (C) as the Abscissa and the sample peak area (A) as the longitudinal coordinate, and the regression equation was calculated.
2.5.5Investigation of intra-day and inter-day precision and recovery
Blank plasma was added to AT to prepare quality control samples of low, medium and high concentrations (10, 50, 200 ng/mL), with 5 parallel samples per concentration.The injection was treated according to the “1.5.1”method, and the intra-day RSD was calculated five times a day, and the recovery rate was based on the ratio of the measured concentration to the actual concentration.The samples were determined repeatedly for 3 d, and the daytime RSD of the results was calculated.
2.5.6 Stability investigation
The “1.5.5”quality control samples were placed at room temperature for 24 h (room temperature stability) and at ?20 ℃ for 7 days (freeze-thaw stability).The sample injection was determined according to the “1.5.1”method to investigate the stability of the samples.
2.6 Evaluation of intestinal permeability in rats
2.6.1 Preparation of intestinal perfusion fluid
Solution A: NaCl 8 g, KCl 0.28 g, NaHCO31 g, NaH2PO40.05 g, MgCl20.1 g, solution B: CaCl20.2 g, glucose 1 g, dissolved in 500 mL ultra pure water, sealed cold storage.When the A and B solutions are mixed in proportion, the Kreb-Ringer buffer solution(K-R solution) is obtained.According to the levels of GCA,GCDCA, TCA and TDCA in intestinal contents of NC rats and TEB exposed rats, the perfusate was mixed in K-R solution.Finally, the perfusate was added to 10 μg/mL, which was named NC group and TEB group respectively.
2.6.2 Establishment of intestinal perfusion model in rats[23]
The blank rats were randomly divided into two groups, NC group and TEB group according to the type of perfusion fluid (n = 5).Before the experiment, the rats fasted for 12 h and drank water freely.The rats were fixed after intraperitoneal injection of 20%urethane.After cutting the abdominal cavity, the duodenum of about 10 cm was selected, intubated and ligated at both ends.After washing the intestinal contents with normal saline, the intestinal fluid was drained, and the perfusion fluid was perfused at the speed of 0.2 mL/min.After 60 min, the perfusion fluid was collected and the volume was read, and then the rats were killed after 30 min was perfused with normal saline.The intestinal segment was separated and perfused, and its inner diameter and length were measured.Part of the intestinal tissue was embedded and sliced in paraffin, and the rest was stored at ?80 ℃.
2.6.3 Determination of absorption rate constant (Ka) and apparent absorption coefficient (Papp) of fluorescein
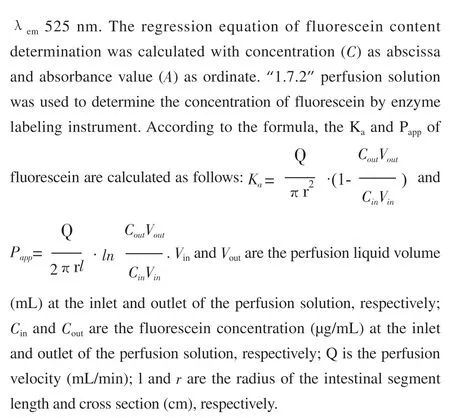
2.6.4 Experiment on the permeability of fluorescein in intestinal
Fixed intestinal tissue sections from “1.6.2”, dewaxing and hydration, running water buffered 10 min.After the slices were dried, the sections were rinsed with Triton × 100 for 20 min,stained with DAPI and rinsed with PBS.After air-drying, the neutral gum was sealed, and the absorption distribution of fluorescein was observed under fluorescence microscope.
2.6.5 Detection of tight junction protein expression in intestinal tissue
Fixed intestinal tissue sections from “1.6.2”.After dewaxing and hydration, the antigen was repaired in citrate buffer and incubated with peroxidase blocker.After incubated with goat serum at room temperature, ZO-1 antibody was added to incubate overnight, and diaminobenzidine was stained.The pictures were observed and collected under the microscope, and the ImageJ image analysis system was used to calculate the mean optical density of quantitative ZO-1 expression level.
2.6.6 Determination of oxidative stress index of intestinal tissue: H2O2, SOD activity and MDA
The intestinal perfusion segment of “1.6.2”was homogenized on ice.The protein concentration in intestinal tissue homogenate was detected by BAC protein kit, and the levels of H2O2, SOD activity and MDA were detected by related kit.
2.7 Statistical analysis
The measurement data were processed by SPSS 23.0 software, and the measurement data were expressed (±s).Single factor analysis of variance was used for comparison between groups.P<0.05 indicates that the difference is statistically significant.
3.Result
3.1 Physiological state of rats exposed to TEB
During the modeling period, there was no difference in appearance,body weight and other physiological states between TEB-exposed rats and NC rats.
3.2 Effects of TEB exposure on the level of BAs in small intestine of rats
The method for the determination of GCA, GCDCA, TCA and TDCA established in this study has good specificity, and the endogenous substances in the contents of the small intestine do not affect the detection.The linear regression equations of GCA,GCDCA, TCA and TDCA were obtained by taking the sample concentration (C) as the Abscissa and the peak area (A) as the ordinate.The regression equations of Cure C=199.1A?754.5(R2=0.9901),C=774.2A+547.9(R2=0.9932), C=1236A?456.7(R2=0.9908) and C=766.2A?784.8(R2=0.9987) were obtained, respectively.The results showed that the linear relationships of GCA, GCDCA, TCA and TDCA were all good within the concentration range of 2.5~1000 ng/mL.The intra-day and inter-day RSD of low, medium and high concentration GCA, GCDCA, TCA and TDCA standard samples were all less than 15%, and the recovery rate was 90%~110%,indicating that the intra-day and inter-day RSD of the method was good; the RSD of the samples stored at room temperature for a long time, repeated freezing and thawing for 3 times and frozen at -20 ℃for 2 weeks were all less than 15%, indicating good stability.Fig.1 showed that the contents of TCA, TDCA, GCA and GCDCA in intestinal contents of NC rats were(1.03±0.08)×105,(1.44±0.57)×105,(5.10±0.67)×103and 5.32±2.22)×102ng/g , respectively.The contents of TCA, TDCA, GCA and GCDCA in intestinal contents of rats exposed to TEB were(8.21±0.94)×105, (2.63±0.52)×105,(3.65±0.43)×104and (2.44±0.55)×103ng/g, respectively.The contents of TCA, TDCA, GCA and GCDCA in intestinal contents of TEB exposed rats were significantly higher than those of NC rats(P<0.001).
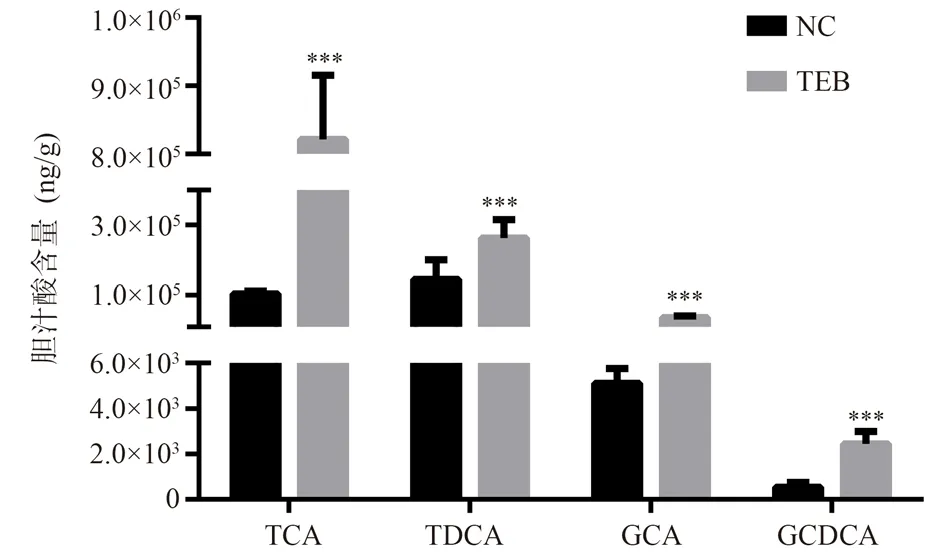
Fig 1 The amounts of TCA, TDCA, GCA and GCDCA in the small intestine of NC and TEB-exposure rats(n = 5, ±s)
3.3 TEB on pharmacokinetic behaviour of oral AT administration
The specificity of the AT content determination method established in this study was good, and the endogenous substances in plasma did not affect the detection of AT.Using the sample concentration (C) as the Abscissa and the peak area (A) of the sample as the ordinate, the AT regression equation was obtained as C=153.1A?1154.2(R2=0.9901), indicating that AT had a good linear relationship in the range of 1~800 ng/mL concentration.The intraday and inter-day RSD of low, medium and high concentration standard samples were all less than 15%, and the recovery rate was 90%~110%, indicating that the intra-day and inter-day RSD of the method was good; the RSD of the samples stored at room temperature for a long time, repeated freezing and thawing for 3 times and frozen at 20 ℃ for 2 weeks were all less than 15%,indicating good stability.
The dose-time curve of rats exposed to NC and TEB after intragastric administration of AT is shown in Fig.2, and the related pharmacokinetic parameters are shown in Table 1.The results showed that TEB exposure changed the kinetic parameters of AT absorption in rats.Cmax and AUC(0-t)of TEB exposed rats were significantly higher than those of NC rats(P<0.05), and Tmax was significantly delayed(P<0.05).
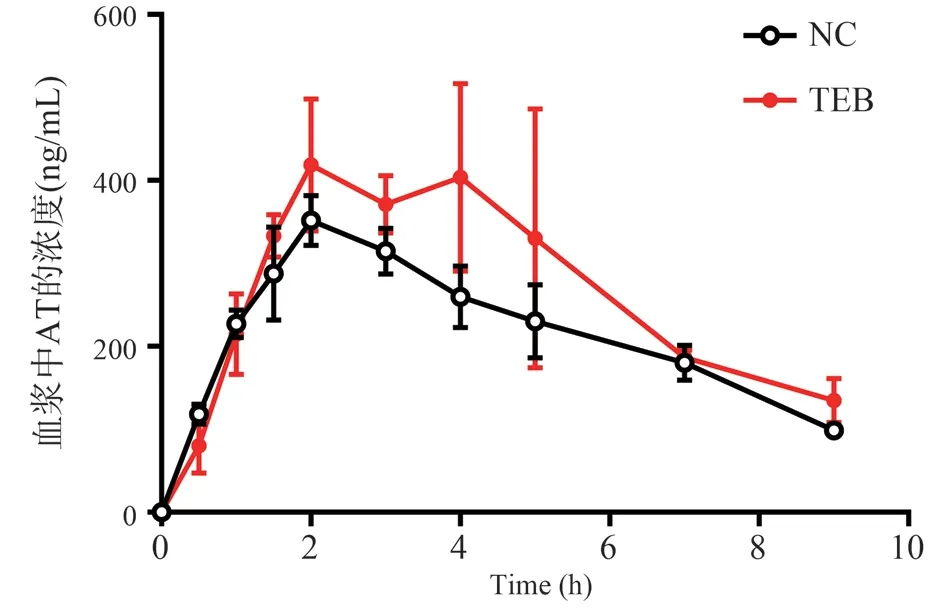
Fig 2 Mean concentration-time curve of AT in NC and TEB-exposure rats plasma after gavage.(n = 5, ±s)
Tab 1 Pharmacokinetic parameters of NC and TEB-exposure rats after AT administration (n = 5, ±s)

Tab 1 Pharmacokinetic parameters of NC and TEB-exposure rats after AT administration (n = 5, ±s)
* p < 0.05 vs.the NC group.
Parameter NC TEB Cmax (ng/mL) 351.82±30.01 478.95±60.56*AUC(0-t) (h·ng/mL) 1959.82±77.88 2407.32±235.98*T1/2 (h) 5.19±2.61 3.63±1.25 Tmax (h) 2.00±0.00 4.00±1.00*
3.4 Effect of BAs perturbations on the small intestinal permeability
As shown in Fig.3A and B, the Kaand Pappof fluorescein in the NC group were (3.25±0.25)×10-2/min and (1.42±0.12)×10-2cm/min,and TEB group were (6.25±1.03)×10-2/min and 3.03±0.02)×10-2cm/min, both Kaand Pappin TEB group were significantly higher than the NC group (P <0.05).Fig.3C showed that the fluorescence of the surface in the NC group and the surface and lamina propria in the TEB group.These results show that BAs perturbations induced by TEB exposure altered epithelial tissue permeability in the small intestine.
3.5 Effect of BAs perturbations on the expression of intestinal tight junction proteins
Fig.4 showed that immunohistochemical results of ZO-1, the ZO-1 expression level in the TEB group was significantly lower than that in the NC group (P <0.05), indicating that the BAs perturbations induced by TEB exposure altered the tight junction structure between small intestinal epithelial cells.
3.6 Effect of BAs perturbations on the oxidative stress levels in the small intestine
Fig.5 showed that the levels of MDA and H2O2in NC group were 1.09±0.06 nmol/mg and 1.38±0.30 mmol/g, respectively, the activity of SOD were 141.65±15.86 U/mg.The levels of MDA and H2O2 in TEB group were 1.49±0.17 nmol/mg and 2.40±0.30 mmol/g,respectively, the activity of SOD were 78.53±17.01 U/mg.The levels of MDA and H2O2in the intestinal tissues in TEB group were significantly higher than those in NC group (P <0.05), and the activity of SOD was significantly reduced (P <0.05), indicating that the BAs perturbations induced the intestinal oxidation/antioxidant imbalance.
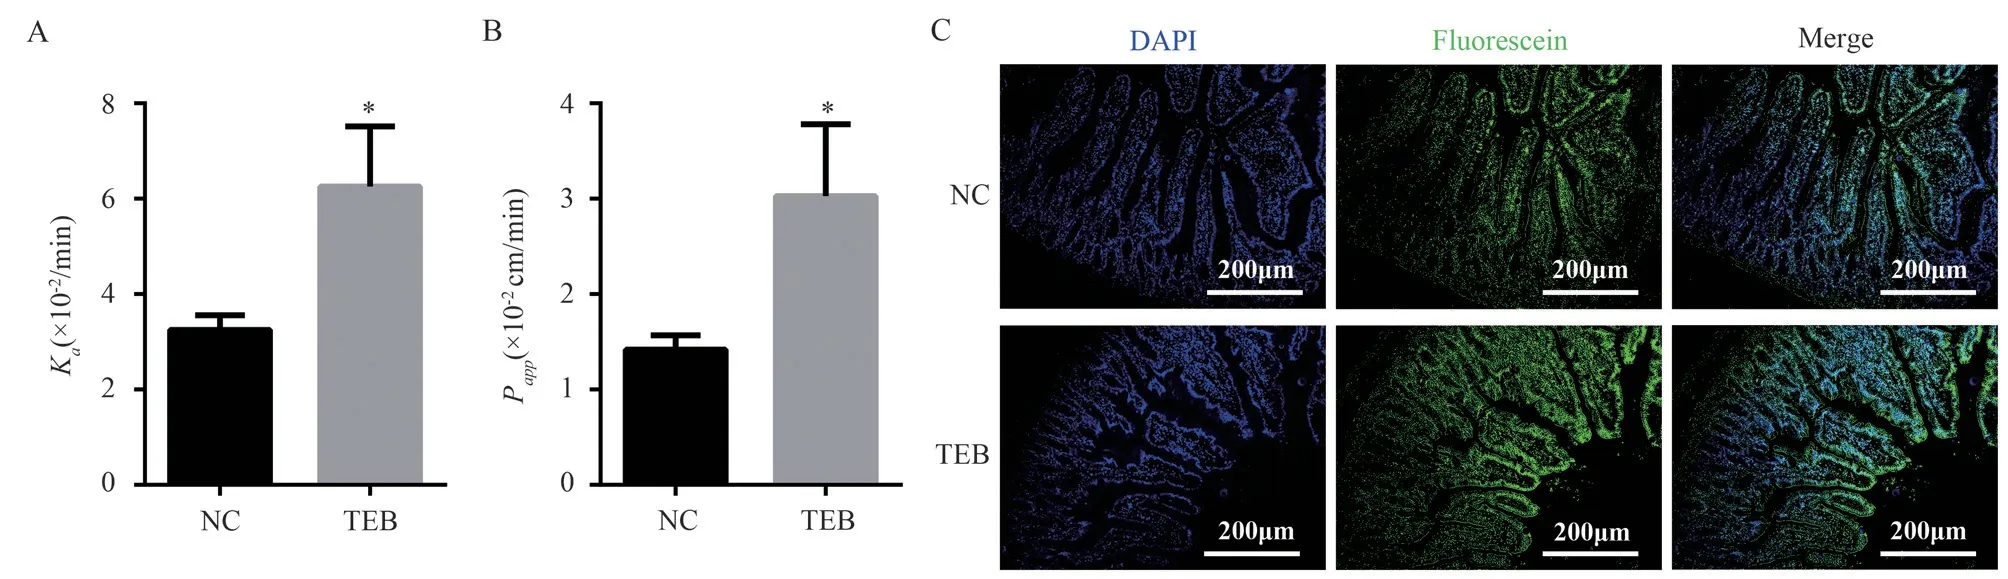
Fig 3 Evaluation of small intestinal permeability in rats of NC and TEB groups after intestinal circulation perfusion experiment(n = 5, ±s)
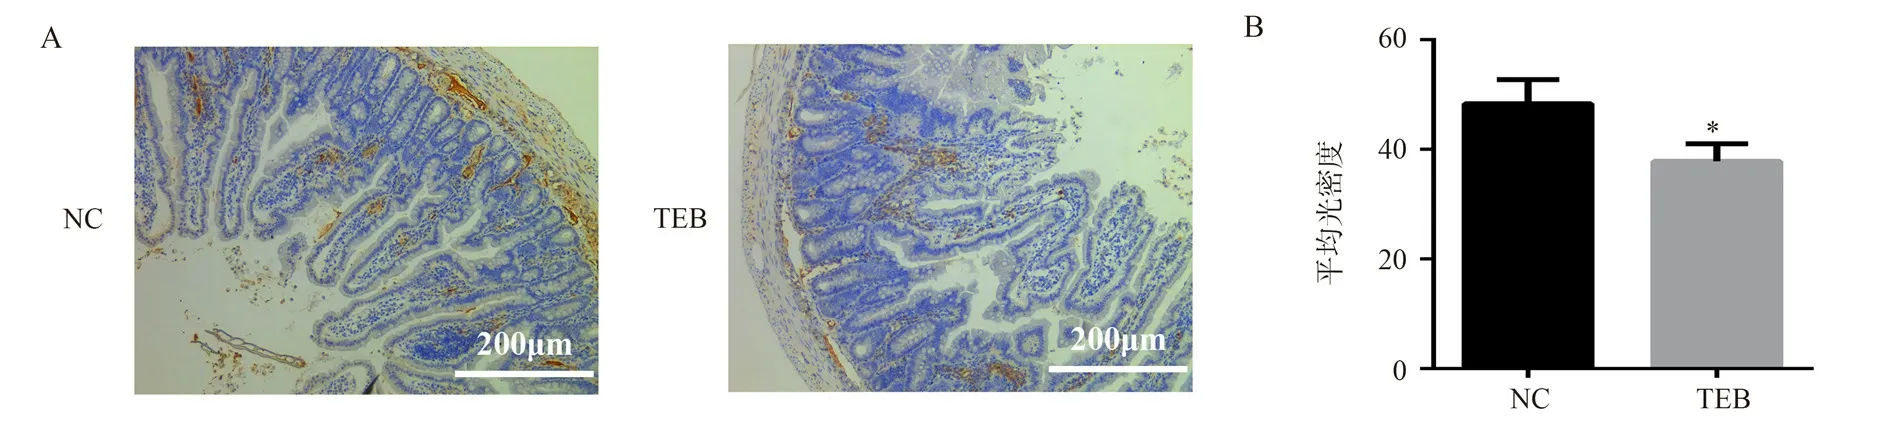
Fig 4 Expression of ZO-1 in rats of NC and TEB groups after intestinal circulation perfusion experiment(× 100, n = 5, ±s)
4.Disscussion
Due to the wide use and environmental persistence of TEB, its potential impact on the environment and human health has attracted more and more attention.A large number of toxicological studies have shown that TEB can induce cardiac, endocrine, embryonic and reproductive toxicity in mammals[25-27].However, the effect of TEB exposure on the safety of oral drug therapy has not been concerned.It has been reported that azole fungicides can induce the gene expression of CYP450 enzyme[28], so TEB exposure may increase intestinal BAs level by up-regulating the expression of key enzymes of BAs synthesis (CYP7A1 and 27A1).As an important physiological active substance, BAs is closely related to intestinal barrier function[29].The increase of BAs level can reduce the expression of intercellular tight junction protein and increase intestinal permeability [30].In addition, there is a correlation between intestinal barrier function and oxidative stress.Oxidative stress can destroy intestinal barrier by inducing intestinal cell apoptosis and reducing the expression of tight junction protein[31,32].Oxidative stress induced by hyperphysiological concentration of BAs increases intestinal permeability by activating intracellular phosphatidylinositol kinase and affecting the tight junction function of Caco-2 cells [33].Therefore, there may be a correlation between the increase of AT absorption after intragastric administration of TEB exposed rats and the increase of intestinal permeability caused by the up-regulation of intestinal BAs level induced by TEB.
In conclusion, this study found that the long-termTEB exposure at ADI doses increased the BAs levels in the intestine,increased the level of intestinal oxidative stress and decreased the expression of ZO-1, resulting in an increase in intestinal permeability, thus increasing the absorption of AT.Therefore, although it is generally believed that fungicides exposed to ADI doses are safe, it might affect the oral medication safety.
Conflict of interest: All authors declare no conflicts of interest.
Author contribution: TAO Quan: the proposal, design and writing of the paper
XU Yu-jing, ZHANG Yu-feng: data analysis and revision of the paper
TAO Yu-chen, ZHUANG Xu-zhen: Data acquisition
YANG Ye, YIN Deng-ke: Review and guidance
 Journal of Hainan Medical College2023年7期
- Journal of Hainan Medical College的其它文章
- Ethanol extract of Annona muricata Linn fruit perform antidiabetic effect on type 2 diabetic mice through α-glucosidase inhibition
- HPLC fingerprint of Nauclea officinalis stems in different harvesting period
- Efficacy evaluation of Shenlan oral liquid in the treatment of experimental thrombosis and hyperlipidemia
- Effect of Qingjin Huatan Decoction on transferrin and Iron regulatory protein in COPD rats
- Electroacupuncture on hippocampal CREB/BDNF/TrkB in depressive rats effects of signaling pathways
- Bone palsy eliminates granules to regulate Wnt/PI3K-AKT signaling pathway and intervene in hormonal osteonecrosis of the femoral head in rabbits