
Combination of hydrotreating and delayed coking technologies for conversion of residue
2024-01-13 04:53JosMuozGabrielezJorgeAncheyta
José A.D. Mu?oz, Gabriel Páez, Jorge Ancheyta
Instituto Mexicano del Petróleo, Eje Central Lázaro Cárdenas Norte 152, Col. San Bartolo Atepehuacan, México City 07730, México
Keywords: Economic benefit Heavy oil Hydrotreating Delayed coking
ABSTRACT Residue conversion by combining catalytic hydrotreating and delayed coking has been evaluated comparatively with both processes alone. Optimal operating conditions are defined to achieve the greatest economic benefit for upgrading an atmospheric residue from a heavy crude oil. A literature model was adapted to simulate the hydrotreating reactor, and for delayed coking,correlations reported in the literature were used.The results with both approaches were employed to calculate the techno-economic feasibility of the combined process scheme.The combination of hydrotreating and delayed coking presented an increase in light fractions of 29%and a reduction in coke production of 47.8%.Based on the calculated net benefit values,it was demonstrated that the combination of hydrotreating and delayed coking is technically and economically better than using each process alone, with highest benefit of 57.7 USD?m-3.
1. Introduction
At present, the demand for light petroleum products such as naphtha and diesel that comply with environmental constraints is on the rise. The production of such high-quality fuels requires light crude oils as feed to refineries.On the other hand,the production of heavy crude oils,which are characterized by high impurities content(asphaltenes,nitrogen,sulfur,and metals,especially nickel and vanadium),has been increasing.Due to this adverse panorama,refiners have the need to use new technologies and process schemes for upgrading heavy crude oils and residues, which are typically based on the hydrogen addition and carbon rejection routes.
Recently, the use of hybrid processes that combine more than one technology has emerged as an attractive option, technically and economically. Casta?edaet al. [1] identified the main advantages of several integrated process schemes,whose synergy would improve product yields and quality, and elimination of low-value by-products. They concluded that more analysis needs to be done for particular applications, especially when elevated operating conditions of pressure and temperature may increase investment and operating costs.
The literature reports some technical evaluations with or without experimental data, however techno-economic analyses for combined process schemes are scarce. Table 1 shows a summary of the main findings that are reported in the literature with combined technologies.In general,all authors agree that the combination of technologies is an effective option for upgrading of bottomof-barrel. The main conclusion from technical and economical point of views is that the synergy of combined process achieves better product quality and economical benefic compared with stand-along technologies.

Table 1Summary of main findings of literature reports with combined technologies
As can be seen in the literature reports, the integration of various technologies in one combined process scheme is indeed an approach that can offer higher performance,product quality,yields and better economic benefits than using only one process. In this sense, the well-known mature delayed coking technology is also a possibility for combination with hydrotreating.This is the reason why in the present study an evaluation of the economic feasibility of the conversion of petroleum residues through the simulation of combined processes of catalytic hydrotreating and delayed coking was carried out.
2. Description of Models and Correlations
2.1. Catalytic hydrotreating (HDT)
The model used for simulating the catalytic HDT reactor is based on that reported by álvarez and Ancheyta [10] for the HIDRO-IMP?technology, which includes the main reactions for residue hydrotreating.It considers a three-phase plug-flow reactorapproach which incorporates mass-transfer at the gas–liquid and liquid–solid interfaces, in accordance with the two-film theory.The feedstock and products are represented by chemical lumps(S, N, Ni, V, asphaltenes (Asph), and VR 538 °C+ (vacuum residue distilled at the temperature more than 538 °C) and the model accounts for the corresponding hydrotreating reactions such as hydrodesulfurization (HDS), hydrodenitrogenation (HDN),hydrodemetallization (HDM), hydrodeasphaltenization (HDAs)and hydrocracking (HDC) of the 538 °C+ VR. The general reactions of the HDT process are indicated in Fig. 1 [11].

Fig. 1. General reactions of the HDT process (Asph: asphaltenes, CCR: conradson carbon residue, M: metals, R: hydrocarbon molecule).
2.1.1. Mass and heat balances
Because there are no chemical reactions in the gas phase, the change in the molar flow in the gaseous components along the reactor is equal to the gas-liquid mass transfer rate [10].
wherei= H2, H2S, and CH4(gases).
The change in the concentration of gaseous compounds in the liquid phase depends on the gas–liquid equilibrium and the liquid–solid mass transfer along the reactor, expressed as follows:
wherei= H2, H2S, and CH4(gases).
The organic compounds and heavy liquid hydrocarbons are transferred from the liquid phase to the catalyst surface:
wherei= S, N, Ni, V, Asph and 538 °C + VR.
The compounds transported between the liquid–solid interphase are either consumed or produced by chemical reaction:
wherei=H2,H2S,CH4,S,N,Ni,V,Asph,and 538°C+VR,andj=HDS,HDN, HDNi, HDV, HDAs and HDC. The sign ‘‘–” is for reactants, and the sign ‘‘+” is for the products.
The necessary flow of hydrogen required to quench the process stream to a certain inlet temperature can be estimated as:
The model considers the exothermic nature of the hydrotreating reactions, using a global heat of reaction (ΔHR= 7820 kJ?kg-1)that is representative of the HDS processes of atmospheric residue and considers the contribution of all the reactions(HDS,HDN,etc.).
2.1.2. Reaction kinetics for impurities removal
The HDS reaction is described by the following Langmuir-Hinshelwood model which takes into account the inhibitory effect of H2S.
HDN, HDM, and HDAs reactions are modeled by power-law kinetic ofnth orders:
Methane production is assumed to be exclusively by hydrocracking of the 538 °C+ VR fraction:
The consumption of H2by HDS, HDN, HDM, HDAs, and HDC reactions and the generation of H2S during HDS were determined using the overall stoichiometric coefficients on a molar basis for the different hydrotreating reactions.
2.1.3. Removal of Conradson carbon residue (CCR)
The model of álvarez and Ancheyta [10] does not take into account the kinetics of Conradson carbon residue (CCR) removal,which is necessary for further simulation of the delayed coking process. The CCR removal (HDCCR) kinetic model proposed by Martínezet al. [12] was considered.
which includes a catalytic reaction with an order(ncCCR)of 1.53,and a thermal reaction with an order (ntCCR) of 1.01.
The following mass balance was used:
2.1.4. Hydrocracking kinetics
To estimate the product yields,the model proposed by Martínez and Ancheyta[13]was considered,which determines the yield of 5 lumps: gases (G), naphtha (N IBP–204 °C), middle distillates (MD 204 °C–343 °C), vacuum gas oil (VGO 343 °C–538 °C) and vacuum residue (VR 538 °C+). The model equations are:
Vacuum residue
Vacuum gas oil
Middle distillates
Naphtha
Gases
The composition is expressed by:
The following mass balance was used:
2.2. Delayed coking
Mu?ozet al. [14] performed a comparison of various correlations of delayed coking process with 13 different feedstocks and operating conditions from commercial units.The general reactions of the DC process are indicated in Fig. 2 [15].

Fig. 2. General reactions of the DC process.
The correlations developed by Volket al.[16]showed the highest accuracy for the estimation of product yields, which needs the following parameters: Conradson carbon residue (CCR, % (mass)),temperature (Tin °F, 1 °F = –17.22 °C), pressure (Pin psig, 1 psig = 0.01 MPa) and contact time (CT in min-1). The correlations are:
With the following corrections (marked with *) to properly reproduce the results of industrial cokers (% (mass)) [17]:
Required properties of crude oil and products of the two processes evaluated were estimated with the commercial software Aspen HYSYS petroleum refining?of the Aspen HYSYS V8.8?program. All products cut points from the evaluated process schemes were defined as follows: VR (538 °C + ), gas oil (343 °C–538 °C),diesel (221 °C–343 °C), and naphtha (IBP–221 °C).
3. Results and Discussion
3.1. Description of the process schemes
The feed for the evaluation of the different process schemes is an atmospheric residue (AR) 343 °C + from a 12.93°API heavy oil whose properties are reported in Table 2.

Table 2Properties of the feedstock
The evaluated process schemes are: 1) catalytic hydrotreating,2)delayed coking:vacuum distillation unit(VDU)and delayed coking, and 3) catalytic hydrotreating plus delayed coking. Fig. 3 depicts the three process schemes.In Case 3,the unconverted vacuum residue from the hydrotreating process is further sent to delayed coking.

Fig. 4. Volumetric yields of HDT products (Case 1): () VR(538 °C +), () gas oil (343 °C–538 °C), () diesel (221 °C–343 °C), () naphtha (IBP-221 °C), Gas in mass (?).

Fig. 5. Volumetric yields of DC products (Case 2). VDU: () VR (538 °C + ), ()heavy gas oil (454 °C–538 °C), () light gas oil (343 °C–454 °C + ). DC: () gas oil(343°C–538°C),()diesel(221°C–343°C),()naphtha(IBP–221°C),gas in mass(?), coke in mass (–).
3.2. Operating conditions
For all schemes four volumetric flowrates of AR were selected based on the liquid hourly space velocity (LHSV) of the HDT reactor: 0.5 h-1, 0.75 h-1, 1.0 h-1, and 1.25 h-1.
Case 1.Catalytic hydrotreating
The reactor model was used to simulate a commercial HDT unit with a reactor of a 40 m length and 4.9 m diameter.Operating conditions were average hydrogen-to-oil ratio (H2/oil) of 890.4 m3?m-3constant pressure of 9.81 MPa,and inlet feed temperatures of 380,390,400 and 410°C.The feed was the atmospheric residue with the properties reported in Table 2. Reaction kinetics parameters are presented in Table 3.

Table 3Kinetic parameters of hydrotreating reactions
Since the size of the HDT reactor was kept constant, the AR flowrate fed to the HDT process is(based on the LHSV conditions):382.1 m3?h-1,572.9 m3?h-1,764.2 m3?h-1,and 955.3 m3?h-1.These flowrates of AR were also used as a basis for the delayed coking and the combined process schemes.
For the hydrogen consumption, since the dissolved hydrogen accounts for 0.1%–6% of total hydrogen, which is certainly not a high contribution[17],in the present study the difference between the amount of hydrogen entering and leaving the reactor in the gas streams is reported as hydrogen consumption.
Case 2.Delayed coking
In this Case, the AR is first sent to a VDU. Yields and properties of light vacuum gas oil(LVGO),heavy vacuum gas oil(HVGO),and VR from the vacuum distillation unit were calculated with the Aspen HYSYS Petroleum Refining?module. The VR was then set as feed to the DC process. The pressure, temperature and liquid space velocity were considered constant at 0.16 MPa, 496.1 °C and 0.0085 min-1respectively, where the pressure and temperature are intermediate values within the valid range of application of the correlations, and liquid space velocity is a fixed value proposed by Volket al.[16]to properly reproduce the results of industrial DC units.
Case 3.HDT + DC
For this combined scheme, the AR is fed to the hydrotreating process.Since the feed to the delayed coker is VR,the hydrotreated product is fractionated to generate the VR.Operating conditions in the HDT and DC processes were the same as in the previous Cases.
3.3. Results of the simulations
Fig.4 shows the effect of HDT temperature and LHSV on product yields for Case 1.As the temperature increases the volumetric yield also slightly increases due to the hydrogen addition,thus generating more quantity of distillates.In addition,as the LHSV increases,although greater production of distillates is obtained due to higher feed flowrate, the residence time of the feed in the reactor decreases (less contact time with catalyst), causing lower conversion of the VR.
For Cases 2 and 3, CCR content in the hydrotreated VR was determined by simulation with the HDT reactor model described before as function of temperature and LHSV, whereby product yields of DC were calculated.
For Case 2, according to Fig. 3, the AR is first fed to the VDU,whereby the VR is obtained and then sent to the DC plant.The product yields of the VDU and DC are shown in Fig.5.For comparison purposes, instead of using the feed flowrate, an equivalent LHSV used in Case 1 (HDT) was considered. The content of CCR of VR fed to DC are 27.88% (mass).
In Case 3, the VR obtained in Case 1 was used as feed for the simulation of the DC process. The calculated yields of the HDT + DC scheme are presented in Fig. 6. Thex-axis represents the operating temperature and LHSV of HDT process.The bars give the volumetric yields of the liquid products and the symbols the mass yields of coke and gas. It is observed that the product yields increase or decrease according to the amount of VR coming from the HDT unit. The production of the lower value product (coke)represents between 25.9% and 28.1% (mass) of the VR fed to the coker. The former value corresponds to an AR flowrate equivalent to LHSV of 0.5 h-1in the HDT process at an inlet temperature of 380 °C, that is, 74.1% of VR was transformed into products of greater value. Coke production is lower in Case 3 with respect to Case 2 in about 28%–40%.
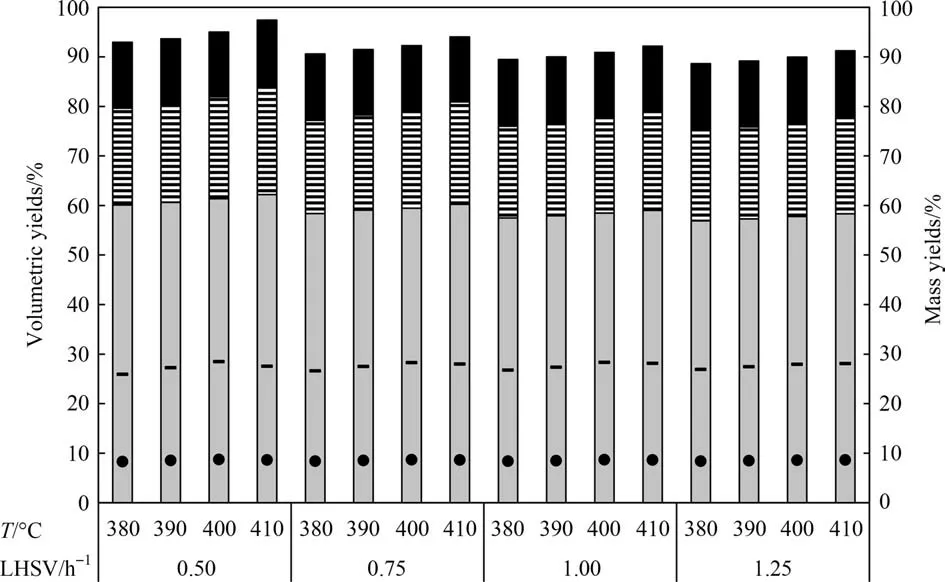
Fig. 6. Volumetric yields of HDT + DC (Case 3): () gas oil (343 °C–538 °C), () diesel (221 °C–343 °C), () naphtha (IBP–221 °C), gas in mass (?), coke in mass (–).
3.4. Technical analysis
The operating conditions that are evaluated in the HDT process(Case 1)are LHSV(0.5 to 1.5 h-1)and reaction temperature(380 to 410 °C) at constant pressure (9.81 MPa) and H2/oil ratio (890.4 m3?m-3). The results of impurities removal and upgraded oil composition at the lowest severity operation(LHSV of 1.5 h-1and temperature of 380 °C) and at the highest severity operation (LHSV of 0.5 h-1and temperature of 410 °C)are indicated in Fig. 7.The differences between low and high severity conditions are clearly observed.That is,high severity operation results in higher impurities removal, higher amount of distillates, and lower amount of residue. Similarly, the API gravity was 17.6° at high severity and 10.3° at low severity.

Fig. 7. Impurities removal and upgraded oil composition for Case 1.
The evaluation of the DC plant(Case 2)considered only the feed flows and the CCR concentration of 27.88% (mass) of the vacuum residue at constant operating conditions of 0.2 MPa, temperature of 532 °C and LSV 0.0085 min-1. The predicted yields (Eqs. (21)–(32))are:9.99%(mass)gas,14.23%(mass)naphtha,16.38%(mass)diesel,26.85%(mass)gas oil and 32.55%(mass)coke.Coke yield is high due to the high content of CCR in the residue feed (27.88%(mass)). Total liquid yield is 57.46% (mass), which is low due to the poor quality of the feed coming from the heavy oil.
Table 4 presents the properties and liquid volumetric yields for the three Cases at the highest severity operation in HDT (LHSV of 0.5 h-1and temperature of 410 °C). The combination of the HDT and DC (Case 3) considers the effect of operating conditions in the HDT process at constant severity of the DC process. The HDT reaction severity affects the performance of the DC, since the amount and quality of the produced VR is different. For Cases 2 and 3, both metals and CCR are expected to concentrate in the coke, that is why the liquid does not contain them. For the other parameters, it is observed that the values of Case 3 (HDT + DC)are in between Cases 1 and 2.

Table 4Properties and yield of the liquid product for the three Cases
The benefit of Case 3 is an increase in production of naphtha(9%(vol)),middle distillates(4%(vol))and gas oil(16%(vol))compared to the other Cases,as indicated in Figs.2,3 and 4.Another benefit is the reduction of coke production by 47.8%.With the increase in the production of liquid distillates, higher yields of refining products such as diesel and gasoline are expected.
3.5. Economic analysis
The economic evaluation of the three process schemes was carried out considering the global benefit as function of the income(Income, USD?m-3), the investment cost (CAPEX, USD?m-3), and the operating costs (OPEX, USD?m-3), based on barrels per year(BPY) of feedstock flowrate as follows:
The incomes were calculated with the volumetric and mass flowrates of the products of each process scheme obtained with the mass balances by simulations,and their respective prices taken from the literature dated on 2021 (Table 5).

Table 5Prices of intermediate products [22]
The income considers the product flowrates (PF), unitary price(UP) and the service factor (SF) of each process scheme.
CAPEX was determined with the investment cost of each process taken also from the literature for DT,DC(with a vacuum fractionator for obtaining the vacuum residue feed)and the combined process. CAPEXs are presented in Table 6 with the corresponding process capacity and year of reference.

Table 6Investment costs of plants used in the three Cases
Since the economic information is reported at a specific year and capacity base [18,19], the values need to be updated to actual conditions. The six-tenth relationship and Farrar indexes were used to do this with cost indexes reported in Table 6 [20,21]according to the following equation:
To determine CAPEX,a constant linear amortization was established for a 20-year horizon, at an interest rate of 10%.
The calculation of CAPEX includes the plants indicated in Fig.1.Other complementary plants for gas sweeting, treatment of sour water, and hydrogen production are not considered. This assumption is valid since these additional units would have similar capacity for the three Cases, so that they do not affect the derived conclusions. It must be highlighted that differently to Case 1,which considers only HDT, Cases 2 and 3 include DC and HDT + DC respectively, and the products coming from these two latter Cases require further hydrotreating. Normally the products from DC in a refinery are sent to downstream processes to hydrotreat the liquid fractions(naphtha,diesel and gas oil)for their stabilization and removal of impurities,which is not considered in the CAPEX.
OPEXs were calculated with prices found in the literature for year 2021 for atmospheric residue, hydrogen, and utilities. For the HDT process, three catalysts are used. All these costs are reported in Table 7 [22]. Raw materials and the products obtained in the different Case studies are considered intermediate products in a refinery because the raw materials come from upstream plants(distillation and hydrogen plant) while the products are fed todownstream plants to finish its processing and meet the specifications of the final products. Utilities requirements of each process were taken from the literature [22] and are shown in Table 8.

Table 7Cost of utilities, raw materials and catalyst [22]

Table 8Requirements of utilities
Deactivation by metals (mainly nickel and vanadium) of HDT catalysts has been reported to follow a linear behavior with an increase of temperature [23–26]. It is also known that for the hydrotreating of heavy oils the catalyst life depends on several factors such as the amount of metals in the feed, the reaction conditions, the properties of catalysts, mainly [25]. Based on a series of experiments carried out with different heavy oils, it can be observed that for conversions of HDM of approximately 45%, the catalyst has an average life of 7.8 months, and for conversions of 88% HDM the average catalyst life is of 6.5 months [26]. With this information, the life of the catalyst was calculated as function of the HDM conversion achieved at each temperature and LHSV.The HDT catalyst life was used to define the frequency of catalyst replacement.
The operating costs consider the consumption of utilities, catalyst, atmospheric residue, hydrogen, unitary price and the service factor of each process scheme.
Table 9 summarizes the results of the economic evaluation of the three Cases. The following observations can be pointed out:
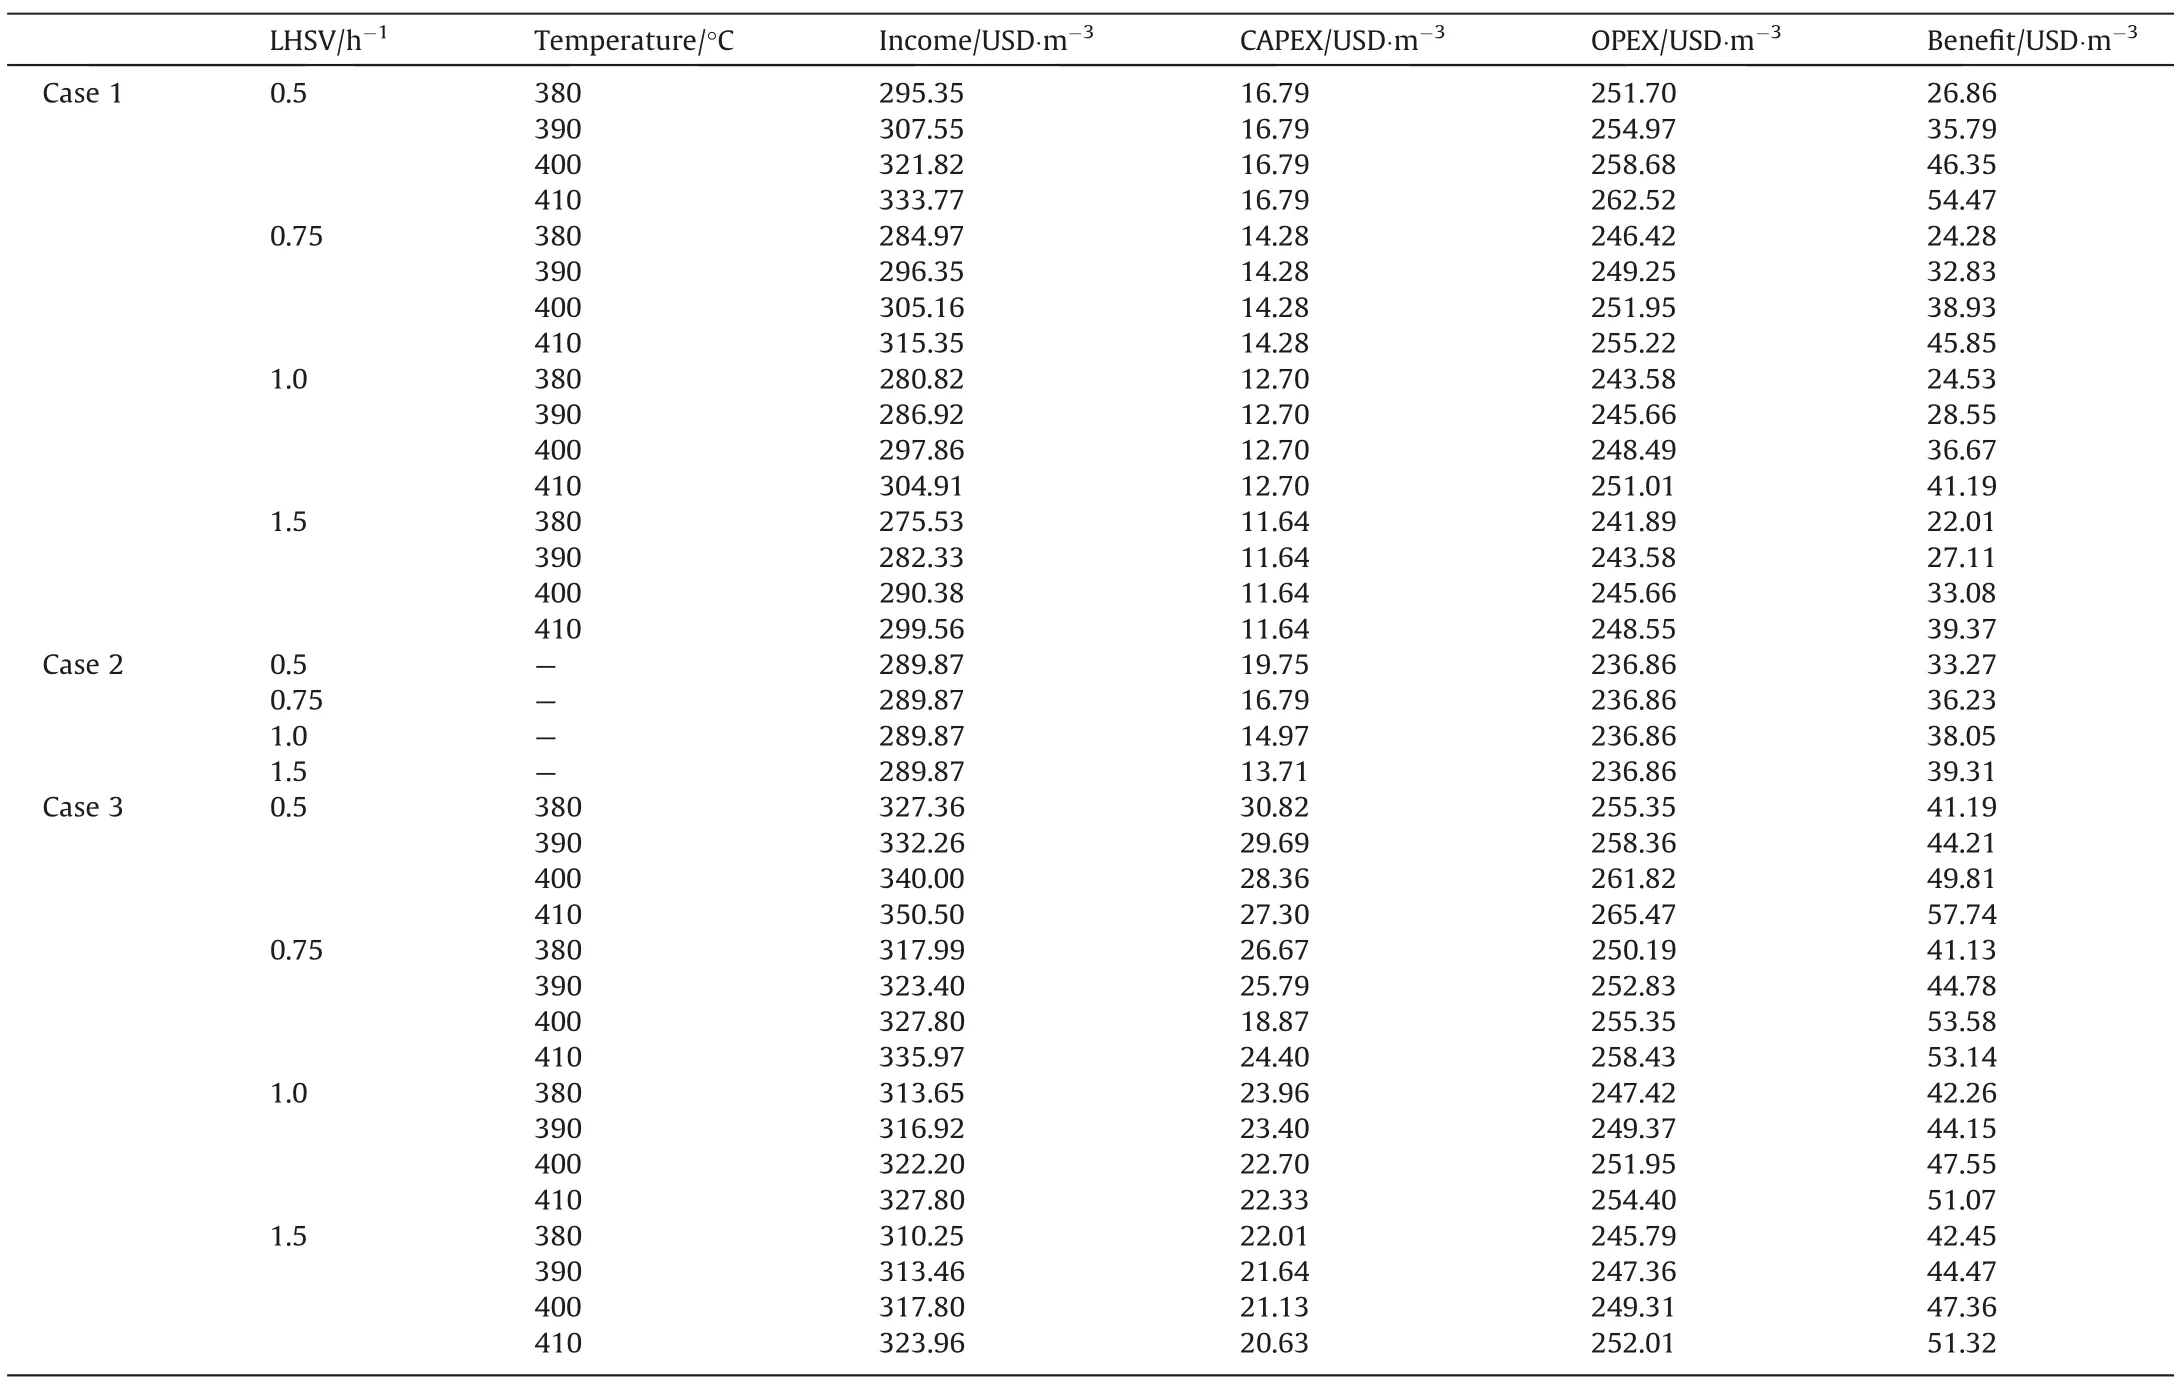
Table 9Results of economic analysis.
Case 1.It presented the highest yields as the HDT temperature increases or LHSV reduces,thus highest income is obtained(275.53 and 333.77 USD?m-3). The more severe the operation the higher the income.
CAPEX ranged from 11.63 USD?m-3(LHSV of 1.5) to 16.79 USD?m-3(LHSV of 0.5), which correspond to higher and lower plant capacities.
OPEX varied between 241.88 and 262.51 USD?m-3for lower and higher HDT plant capacity respectively.
Case 2.Income was the same for the different feed flowrates since the yields of the coker unit do not depend on flowrate but on VR properties. The calculated income value is 289.87 USD?m-3.
CAPEX ranged from 13.71 to 19.74 USD?m-3for the highest and lowest DC capacities, respectively.
OPEX was also the same for the different feed flowrates since it is refereed to barrels of feed flowrate, it was 236.85 USD?m-3.
Case 3.It presented similar behavior as Case 1, that is the higher the severity the greater the income and investment costs.
Income resulted to be between 310.25 and 350.30 USD?m-3,OPEX between 245.78 and 365.47 USD?m-3, and CAPEX between 20.62 and 30.81 USD?m-3.
The largest gap is found at LHSV of 1.25 h-1which is the result of the short residence time in the HDT reactor that gives lower reaction severity, hence a high production of VR is obtained. In the HDT+DC scheme this issue is solved by using the unconverted VR from the HDT process as feed to the DC process, recovering higher amounts of distillates. Regarding the coking process, the HDT + DC scheme exhibits the greatest advantage at equivalent LHSV of 0.5 h-1,since as mentioned above,under these conditions the lowest amount of VR is obtained in the HDT process at all temperatures and less feed is sent to DC causing a lower investment in this latter process.
Fig. 8 shows the results of the economic benefit of all process schemes.All the processes are economically feasible at all the studied conditions with the following values:

Fig. 8. Economic benefit. Case 1 (), Case 2 (), Case 3 ().
Case 1: 22.01–54.46 USD?m-3
Case 2: 33.27–39.30 USD?m-3
Case 3: 41.19–57.73 USD?m-3
In general, the HDT + DC scheme gives the highest economic benefit,which indicates that the combination between hydrotreating and delayed coking technologies is positive.HDT alone resulted better than DC alone, this is without considering the further hydrotreating than products from DC require. Other advantages of HDT + DC scheme are: zero production of fuel oil, high-quality feed and products of DC that would require null or less severe hydrotreating (coker naphtha and gas oil), lower production of coke,production of coke with reduced content of metals and sulfur,mainly.
From these results, it is evident that the combination of hydrotreating and delayed coking represents advantages for the refineries. Particularly, in those Cases when the refinery does not have a process for conversion of bottom-of-barrel, and there is uncertainty on which process to install, the best recommendation is to perform a feasibility study on the use of HDT + DC scheme.
The final benefit would depend on the properties of the AR to be converted. For instance, if low metal content AR is used,hydrotreating catalyst would have longer life thus reducing the operating costs. It is then anticipated that highly contaminated heavy AR would be best feedstocks for obtaining better benefits with the HDT +DC process scheme.In other words,refineries that process high proportion of heavy crude oils are good candidates to use the HDT + DC process scheme.
The values obtained from the economic benefit may change depending on the costs(materials,utilities and catalysts)and local,regional or international prices (products) reported by an official energy institution. However, it is expected that the benefit of the developed Case studies would present the same tendency as that reported in this work.
4. Conclusions
A literature hydrotreating of heavy oil reactor model was successfully extended to predict products yields and quality to be used as feed for the delayed coking process. Depending on the reaction temperature and residence time in the HDT reactor,a reduction or increase of heavy oil conversion is observed,the HDT +DC combination increases the yields of the light fractions by 29% (vol) and reduces coke production by 47.8%, which directly affects the performance and economics(CAPEX and OPEX) of the delayed coking and the combined process scheme. The HDT + DC configuration is economically feasible and presents higher benefits than each process alone, hydrotreating or delayed coking. The highest HDT + DC benefit is 57.7 USD?m-3, which was obtained at 410 °C and LHSV of 0.5 h-1in the HDT unit.
Nomenclature
AF annual flow rate of feedstock, m3?a–1
ASsectional area of the reactor, cm–2
aLgas–liquid interfacial area, cm–1
aSliquid–solid interfacial area, cm–1
CCR Conradson carbon residue, % (mass)
Ciconcentration of compoundi, wherei= H2, H2S, CH4, S, N,Ni, V, Asph
Cpmass heat capacity, J?g–1?K–1
CT contact time, min–1
EAactivation energy, kJ?mol–1
ggas mass flow rate, g?s–1
gicontent of fractioni, g
gTtotal amount of stream entering the reactor, g
HDC hydrocracking
HDCCR Removal of CCR
HDM hydrodemetallization
HDN hydrodenitrogenation
HDNi hydrodenickelization
HDS hydrodesulfurization
HDT hydrotreating
HDV hydrodevanadization
Hihenry’s law constant for compoundi, MPa?cm3?mol–1
IC investment cost, USD
iinterest rate, %
adsorption equilibrium constant for H2S, cm3?mol–1
kcCCRcatalytic kinetic constant for the CCR removal reaction
kjreaction rate constant for reactionj
gas–liquid mass-transfer coefficient for compoundi,cm?s–1
liquid–solid mass-transfer coefficient for compoundi,cm?s–1
ktCCRthermal kinetic constant for the CCR removal reaction
Lcatalytic bed length
lliquid mass flow rate of thejstream, g?s–1
BPY barrels per year of atmospheric residue, 1 barrel = 0.159m3
mT0total mass flow, g?s–1
Nimolar flow of compoundi, mol?s–1
nyears of the evaluation period
njorder of reactionj
Ppressure, MPa
PF product flow, m3?a–1
Pi producti(gas, naphtha, diesel, gas oil, VR 538°C+, coke,LVGO, HVGO)
Pn productn(gas, naphtha, diesel, gas oil, VR 538°C+, coke,LVGO, HVGO)
qquench fluid mass flow rate, g?s–1
rjreaction rate of compoundj, mol?cm–3?s–1
rHDCCRHDCCR reaction rate, %?h–1
SF service factor (330 days of operation per year)
Ttemperature, °C
UF utilities, catalyst, atmospheric residue and hydrogen flow
Ups unit price of utilities catalyst, atmospheric residue and hydrogen
UPp unit price of product
Ui utilitiesi(electricity, steam, fuel, water and catalyst)
Un utilitiesn(electricity, steam, fuel, water and catalyst)
usuperficial velocity, cm ?s-1
VR vacuum residue
Wmass, g or kg
yicomposition of the lumpi
zaxial position along the catalyst bed
ΔHRoverall heat reaction, kJ?kg–1
ρ density at process conditions, g?cm–3
Subscripts and Superscripts
cat catalyst
diss dissolved
G gas phase
in inlet to the following catalytic bed
L liquid phase
out outlet of the previous catalytic bed
Q quench stream
S solid phase
Declaration of Competing Interest
The authors declare that they have no known competing financial interests or personal relationships that could have appeared to influence the work reported in this paper.
Acknowledgements
The authors thank the Mexican Institute of Petroleum(IMP)for the financial support.Gabriel Páez also thanks the National Council for Science and Technology(CONACYT)for the scholarship for MSc studies.
 Chinese Journal of Chemical Engineering2023年11期
- Chinese Journal of Chemical Engineering的其它文章
- Effects of the original state of sodium-based additives on microstructure,surface characteristics and filtration performance of SiC membranes
- Comprehensive analysis on the economy and energy demand of pressure-swing distillation and pervaporation for separating waste liquid containing multiple components
- Esterification of acetic acid with isobutanol catalyzed by ionic liquid n-sulfopropyl-3-methylpyridinium trifluoromethanesulfonate:Experimental and kinetic study
- Numerical investigation of film forming characteristics and mass transfer enhancement in horizontal polycondensation kettle
- COF-derived Co nanoparticles@N-doped carbon electrocatalysts for highperformance Zn-air batteries
- A potential-responsive ion-pump system based on nickel hexacyanoferrate film for selective extraction of cesium ions