
Influences of regeneration atmospheres on structural transformation and renderability of fluidized catalytic cracking catalyst
2024-01-13 04:53HaigangZhangZhongjieShenJianhongGongHaifengLiu
Haigang Zhang, Zhongjie Shen,, Jianhong Gong, Haifeng Liu
1 National Energy Coal Gasification Technology Research and Development Center and Shanghai Engineering Research Center of Coal Gasification, East China University of Science and Technology, Shanghai 200237, China
2 Sinopec Research Institute of Petroleum Processing, Beijing 100083, China
Keywords: Fluidized catalytic cracking Coke deposit Regeneration Pore structure Gasification and combustion
ABSTRACT The regeneration of fluidized catalytic cracking (FCC) catalysts is an essential process in petroleum processing. The current study focused the regeneration reaction characteristics of spent fluidized catalytic cracking catalyst (SFCC) at different atmospheres with influences on pore evolution and activity, for a potential way to reduce emission,produce moderate chemical product(CO),and maintain catalyst activity.The results show that regeneration in air indicates a satisfaction on removing coke on the catalyst surface while giving a poor effect on eliminating the coke inside micropores. This is attributed that the combustion in air led to a higher temperature and further transformed kaolinite phase to silicaaluminum spinel crystals, which tended to collapse and block small pores or expand large pores, with similar results observed in pure O2 atmosphere.Nevertheless,catalysts regenerated in O2/CO2 diminished the combustion damage to the pore structure, of which the micro porosity after regeneration increased by 32.4%and the total acid volume rose to 27.1%.The regeneration in pure CO2 displayed low conversion rate due to the endothermic reaction and low reactivity. The coexistence of gasification and partial oxidation can promote regeneration and maintain the original structure and good reactivity.Finally,a mechanism of the regeneration reaction at different atmospheres was revealed.
1. Introduction
Crude oil is a key resource in the energy and chemical industry,and its processing technology directly affects product quality,energy efficiency, pollutant emission,etc.Fluid catalytic cracking technology converts feedstocks (typically high-vacuum gas oil)into lighter products [1,2]. Its continued development is essential when refiners move their fluidized catalytic cracking (FCC) operations from fuel production to higher-value products(e.g., liquefied petroleum gas (LPG) and high-octane gasoline) [3,4]. However,during the catalytic cracking process, coke deposition hinders further diffusion and reaction of intermediates from cracking,causing temporary deactivation of the catalyst [5]. To solve this issue, one key step is keeping the catalytic activity during the regeneration process when removing the coke deposit on the FCC particle. The common method uses air to combust the coke deposit and obtain an extra energy supply [6,7]. The current extensive research on regenerator structures has also led to the full optimization of regenerator performance [8]. Nevertheless, the catalyst regenerationviacombustion generates large CO2emission issues, and a potentially overheated environment will deactivate the FCC catalyst particle. The combustion regeneration process predestines the above-mentioned problems to exist inevitably.
In a typical FCC process, the deactivated catalyst is separated and fed to a regenerator where it is burned in dilute air at a temperature range of 600–760 °C to form CO, CO2, steam, SOx, NOxcompounds to regenerate the catalyst [9,10]. However, each cycle of regeneration will reduce the catalyst life permanently, and Almaset al. [6] found that significant catalyst deactivation could be observed at the first regeneration and the increased number of reaction cycles and thermal aging also changes the structural order of the graphitic species or the morphology of the coke,forming hard coke that is difficult to remove. Meanwhile, the heat of coke combustion on the catalyst is crucial to the thermal equilibrium of the regeneration process, which affects the regenerator temperature as well as the structure and activity of the catalyst[11–13].Especially in the bubbling fluidized bed,the axial temperature difference exceeds 80 °C [14].
Generally, catalyst deactivation is divided into two categories:reversible and irreversible deactivation [15]. The catalyst particles are continuously cycled in the reaction and regeneration stages.On average,the particles undergo catalytic cracking reactions for a few seconds and regeneration for about ten minutes during a cycle[16]. Many studies so far have focused on the coke deposit in the cracking stage, aiming to reveal the mechanism of catalyst deactivation and the factors influencing the regeneration process [17–20]. While studies on the coke gasification or partial oxidation behavior and the possible evolution of catalyst structure under different regeneration conditions of catalysts are still seldom found.Considering that catalyst regeneration is a more complex and heterogeneous process involving multiple reactions, and heat and mass transfer at multiple scales,the structural changes of catalysts caused by heat and mass transfer are related to the durability and lifetime of catalysts, which directly affects the sustainability of refining enterprises.Thus,it is important to understand the evolution of particle structure during regeneration to improve the regenerated catalyst lifetime with further study.
Previous studies on catalyst regeneration have focused on combustion reactions [21–23]. Some scholars used the gasification technology to regenerate deactivated catalysts by using water vapor or CO2as gasification agents to produce H2and CO [24–27]. Water vapor gasification was mainly limited by the sintering issue,which was caused by catalyst hydrothermal instability(dealumination) during decarbonization [21,28]. CO2gasification, as a milder oxidant, can achieve the regeneration of coking catalysts by reverse Boudouard (RB) reaction without sinterization. However,the coke gasification process is a highly endothermic reaction,which usually occurs at temperatures above 700 °C [29]. Research has shown that the optimum temperature for coke gasification is around 800°C.The low reactivity of CO2and the high reaction temperature required are the main limitations of CO2gasification for catalyst regeneration. Theoretically, due to the high heat absorption and energy intensity of CO2gasification, O2can be added.The combustion of coke with oxygen provides the energy required for CO2gasification and it has been successfully applied in the coal gasification process [30,31]. At sufficiently high CO2partial pressures,CO2gasification is still possible even if the O2oxidation reactivity is several orders of magnitude higher than the CO2oxidation reactivity and even dominates the initial stage of catalyst regeneration [19]. Recent studies have focused on the effect of reaction conditions on coke deposit efficiency but neglected the effect on the catalyst structure itself.
In this study, the regeneration reactivity of spent fluidized catalytic(SFCC)catalysts under CO2and CO2-O2mixtures atmosphere(pure CO2, 20% O2and 80% CO2in volume (20% O2/CO2), air, and pure O2) were investigated. Meanwhile, various non-destructive and complementary characterization methods under different atmospheres were used to reveal the structure and distribution of coke deposits in SFCC catalysts.The changes in the pore volume of particles were also measured to evaluate the effect of the reaction atmosphere on particle structure. Finally, the interaction mechanism between the pore evolution and regeneration reaction of the regeneration process of SFCC catalysts at 800 °C was proposed based on the experimental and characterization results.The results will be helpful to provide a potential process to reduce CO2emissions and produce CO for the industry.
2. Experimental
2.1. Materials
The industrial fresh FCC catalyst and spent FCC catalyst used in this study were from Shanghai Petrochemical Refinery,which were denoted as FFCC and SFCC, respectively. The coked catalysts were prepared at 500 °C with Chinese Daqing vacuum residue. The chemical composition is analyzed by the ASVANT’X Intelli Power 3600 X-ray fluorescence analyzer (Thermo Fisher, America), and the true density of the tested sample is determined by AccuPycII1345 true density meter (Micromeritics, America) in helium atmosphere. The catalyst properties are shown in Table 1. There was little difference in the composition of FFCC and SFCC, which indicated that there were no metals (vanadium or nickel) in the feed oil. The increased iron content may originate from the feedstock or the steel reactor. The average particle size of the catalyst is around 67 μm, and the SFCC particle size is slightly reduced.The crushing of catalyst particles was carried out on an MZ600 ultra-centrifugal grinder (Macami, China) at 70 r?min-1for 10 min. The elemental analysis results showed that the C content in SFCC reached 2.72% (mass). The gas used in the experiment was purchased from Shanghai Haoqi Gas Company (China) with a purity of 99.99% (vol).

Table 1Chemical and physical information of samples used in this study
2.2. Experimental method
To exclude the influence of moisture on the experiments, the catalysts were dried in an oven at 105 °C for 3 h before each thermogravimetric experiment(TG).The mass loss curves of SFCC catalysts under different atmospheres are obtained by NETZSCH thermogravimetric analyzer (STA 2500, America). About 10 mg of spent catalysts were placed in an alumina crucible and the temperature was increased from 25°C to 800°C at a rate of 20°C?min-1in N2(20 ml?min-1). After that, oxygen or carbon dioxide was introduced at 800°C for a constant temperature of 1.5 h,and the quality variation was recorded. In experiments, the equilibrium point of the curve was used as the reaction endpoint, and the carbon conversion curves during the regeneration of SFCC catalysts were obtained based on the mass loss combined with Eq. (1).
wheremtis the mass of the sample at reaction timet,mais the mass of the reaction residue andm0is the mass of the sample before the reaction starts, mg.
TG experimental products cannot meet subsequent testing requirements.To analyze the reactivity and distribution of the coke deposit, the spent catalysts are regenerated under different atmospheres, including pure CO2, 20% O2and 80% CO2in volume (20%O2/CO2), air, and pure O2. The regeneration experiments were carried out in a tube furnace. About 2 g spent catalyst sample was placed in a crucible and heated from room temperature to the regeneration temperature (800 °C) at a rate of 20 °C?min-1. Nitro-gen was introduced as protective gas during the heating process,and reaction gas was introduced at the constant temperature stage for 1.5 h. Both the reaction gas and the protective gas (N2) were blown into the reactor at a constant flow rate of 120 ml?min-1to ensure that the atmosphere remained stable during the experiment.
2.3. Analytical method
Two non-destructive methods, including X-ray electron spectroscopy (XPS, Thermo Fisher, America), and Raman spectroscopy(Thermo Fisher), were used to analyze SFCC samples in the experiments. XPS analyses were done in the Nexsa surface analysis system, the data acquisition was collected from a monochromatic Al Kα emission X-ray source (hv = 1486.68 eV) operated at 10 kV and 10 mA. The results were analyzed by Avantage software with the spectra referenced to the adventitious carbon C 1s line at 284.8 eV. After the subtraction of a Shirley baseline, each C spectrum was deconvoluted by the Gaussian-Lorentzian mixed function. For the structural analysis of FCC catalysts, the specific surface area and pore volume of catalyst particles after the reaction were determined by nitrogen adsorption/desorption isotherm experiments(BET method,GB/T5816-1995)using the specific surface area analyzer (Qantachrom Corp, America) at -196 °C. The specific surface area and pore volume of catalyst particles before and after the reaction were obtained according to the Barret-Joyner-Helena method (BJH) to calculate the pore size and distribution.
The morphology of different sites of the catalyst was also photographed using scanning electron microscopy and further combined with energy dispersive spectroscopy (EDS) to investigate the relative contents of carbon at different sites of the catalyst.The average value of the relative content of carbon components(Wi) under different reaction atmospheres can be obtained, and the conversion of the coke deposit after the reaction can be further obtained by Eq. (2).
whereW0is the relative content of carbon components.
The mineral species of the catalyst were analyzed using the D/MAX 2550-VB/PC type X-ray diffractometer (XRD, PANalvtica,Netherlands). The operating conditions of the equipment were 40 kV and 40 mA, and the catalysts were scanned from 2θ =10°–80°. Then, Jade6.5 was used to analyze the XRD patterns with standard pdf cards to determine the crystalline mineral composition, and the catalyst particle crystalline transformation was shown by comparing the change of signal-to-noise ratio. The laser wavelength used for Raman spectroscopy was 455 nm and the power was 3 MW. The spectra were recorded in the beam range of 500–3000 cm-1. The Raman spectra were further deconvoluted to obtain the hidden carbon structure information. Ammoniaprogrammed temperature rise desorption (NH3-TPD) is used to determine the total acid amount after the NH3adsorption process.The rate of desorption of NH3with increasing temperature is recorded by the TPD detector to test the amount of acid at different acid strengths, and the combined results gave the total acid amount. Qualitative and quantitative elemental determinations were evaluated according to X-ray fluorescence spectra measured on an X-ray fluorescence spectrometer (XRF, Thermo Fisher Scientific).
2.4. Heat transfer analysis
In the TG experiment,for the reaction process between the coke deposit and the catalyst to be generated,energy balance among the heat of reaction (Q), conduction to the surroundings (Q1), conversion (Q2), and the heat conduction inside char particle (Q3) can be expressed as:
Generally, heat conduction (Q3) exists inside the particles.According to the empirical equation,when the Biot number is less than 0.1 (small particle size and high thermal conductivity), thus the internal temperature gradient could be negligible. The Biot number can be expressed as:
wherehgis the convective heat transfer coefficient,dpis the particle size,and λpis the internal thermal conductivity of the particle. The average particle size of the catalyst is 65 μm, the Biot number is much less than 0.1,and the temperature gradient inside the particle can be neglected. The calculation parameters are shown in Table 2.Thus,the heat transfer between the reaction layer and the particles can be considered as the temperature rise of the particle bed.

Table 2Values of the heat transfer parameters and model parameters applied in this study[10]
Meanwhile,the heat of the reaction can be detected by the differential scanning calorimetry (DSC), and the reaction exergyversustime can be obtained by a linear fit to the total heat flow rate. In addition, the heat of conduction between the particles and the walls can be expressed as:
where λsis the thermal conductivity of the container,S1is the thermal conductivity area,δ is the container wall thickness,Ttis the catalyst temperature at timetandTsis the ambient temperature.
During the experiment, the gas flow rate is set to 0.1 L?min-1.Particles are in a laminar flow state with a low value of Reynolds number, and the convective heat exchange between the particles and the airflow is:
whereS1is the particle contact area with airflow. Within the reaction section, the particle temperature rise can be expressed as:
whereCPis the specific heat capacity, andmis the sample quality.
3. Results and Discussion
3.1. Composition and distribution of coke deposits
The morphology of the catalyst particle and the coke deposit distribution on the catalyst surface before and after grinding are shown in Figs. 1(a) and 2(a), respectively. Likewise, Figs. 1(b) and 2(c) illustrate the element distribution at different spots on theparticle surface.Carbon is distributed evenly among the sites,with other elements mainly comprising of O, Si, and Al, which are the components of the mineral.After the catalyst is ground,the carbon content varies considerably at different sites due to fragmentation,and the carbon appears to be aggregated,which is attributed to the stripping and aggregation of carbon during the grinding process.According to the results in Table 1,the catalyst is composed of aluminosilicates with a fixed distribution of these components. Note that SEM-EDS is utilized to characterize the relative quantity of carbon, Taking the relative content of aluminosilicate elements as the reference value,the total carbon content of the catalyst is close to the surface carbon content.Therefore,a considerable amount of coke is present in the inner pores of the catalyst particle.
3.2. Coke deposit structure
Fig.3 provides the quantitative depiction of the relative content of the components in the coke deposits, XPS detects the composition of the material at the catalyst surface rather than the whole particle [32–34]. The details of the functional groups observed can be found in Table 3. The peak of the C—C bond at 284.8 eV was the most intense, accounting for 73.84% of the total area.The peak splitting results show that C—C peak covers the other two peaks of carbon–oxygen functional groups, located at 286.43 eV (B) and 289.12 eV (C) respectively. The high content of C—C bonds proves the graphitization of coke deposits on the surface of catalysts. Compared with the IR results conducted by Cerqueira [35], the content of the C—O bond decreases, and the content of the C—C bond increases, implying that the surface carbon is more inclined to a graphite-like macromolecular structure compared to the catalyst interior.

Table 3Catalyst structure parameters from the analyzed XPS spectra
XPS results confirm the high graphitization of coke on the catalyst surface. Raman analysis was performed on the catalyst to obtain detailed information about the structure of the coke deposit in the SFCC.The results are shown in Fig.4(a),and peak fitting with Gaussian or Lorentzian line shape for the original Raman spectrum was performed and displayed in Fig. 4(b). The explanation of the peak position is shown in Table 4. In Fig. 4, the first peak(1350 cm-1)indicated the carbon structure is close to the overlapping peaks of the D1and D4bands, which is disordered graphitic lattice with graphene layer edges and A1g symmetry. The other one (1600 cm-1) is close to the overlapping peaks of D2, D3, and G bands,which mainly are ideal graphite lattices with E2g symmetry and disordered graphitic lattices.The intensity of the D peak is higher than the value of the G peak,implying that the main form of carbon exists as disordered carbon. The reactivity of disordered carbon is higher than that of crystalline carbon, thus it can be judged that the coke deposit has both higher reactivity and gasification or combustion rate,which is consistent with the experimental results. The D1peak is noted to be higher than the G peak,indicating that the graphite microcrystals formed by coke deposits have a smaller average two-dimensional size. Additionally, the intensity of D3is reasonably explained by the presence of a small amount of small molecule aromatic ring or aliphatics vibrational peaks in the carbon deposit, and the presence of the D4peak indicates that the deposited carbon contains certain ionic impurities.

Table 4First-order Raman bands, Raman shift, vibration modes [36,37], and band area proportion used in this study
3.3. Coke deposit conversion and reaction heat effect
Results of the mass loss of the catalyst samples at different reaction stages are shown in Fig. 5(a). In the thermogravimetric curve,the mass loss in the heating stage is presumed to be light species volatilization.The coke deposit reacted rapidly after gas switching in the initial minutes under different atmospheres. However, it is noted that the spent FCC catalyst in CO2clearly shows a ‘‘fast and then slow” two-stage mass loss curve. This means reactions continues to occur under CO2or 20% O2/CO2atmosphere with a reasonable speculation of the continued gasification/combustion reaction of residual coke deposits inside the micropores.
To analyze the conversion on the catalyst particle surface, the reaction endpoint is defined as a mass loss change rate of less than 0.1%per minute,and the conversion of the regeneration reaction is further obtained and shown in Fig. 5(b). The coke deposit on SFCC catalysts can reach the completed point of mass loss in a relatively short period time in the pure O2or air atmospheres. The conversion rate in the initial reaction stage is high in the case of pure oxygen while slightly lower in air. The conversion rate in pure CO2ismuch lower than the value in other atmospheres, due to the low reactivity with CO2.Interestingly,when CO2is involved in the reaction instead of N2,i.e.at 20%O2/CO2condition,the conversion rate is faster than under the air atmosphere.This indicates the removal of the coke deposit is accelerated when gasification is involved.When CO2is introduced, there is still a slow reaction phase after the end of the fast reaction, compared to the results in pure O2or air.
Fig. 6 shows the differential scanning calorimetry (DSC) curves of the catalyst regeneration process. The results indicate that the endothermic/exhaustion rate of the regeneration reaction under different conditions follows a trend of increasing and then decreasing, which is consistent with the change in reaction rate. The exothermic rate during regeneration under air atmosphere shows a‘‘short and wide”peak compared to the pure oxygen combustion,suggesting a less intense combustion process. In addition, the intensity of the DSC curve during regeneration under 20% O2/CO2is significantly lower than that under a pure oxygen atmosphere,indicating that the introduction of CO2reduces the heat release during the combustion regeneration process. Besides, the DSC curve during regeneration under pure CO2condition shows a slow gasification and heat absorption process.
Fig.6(b)shows the temperature change of the catalyst particles at different conditions. During the combustion process, the temperature of the catalyst particles increases rapidly and then gradually returns to ambient temperature. In the pure oxygen atmosphere, the temperature of the catalyst reached up to 878 °C, which is sufficient to transform the kaolinite. The particle temperature can also reach 860°C in an air atmosphere.However,under 20% O2/CO2conditions, the involvement of the gasification reaction consumed part of the heat generated by combustion,resulting in a decrease of the particle temperature by about 40 °C, which is a good protection of the catalyst structure. One point to emphasize is that the temperature rise of the whole catalyst particle is calculated, whereas the actual temperature of the catalyst surface temperature will be higher.
Based on the abovementioned results in Sections 3.1 and 3.2,coke deposit is widely distributed on the catalyst surface and in the pores.For the fast combustion reaction,these two parts of carbon show different reaction rates, which theoretically correspond to the ‘‘fast mass loss” and ‘‘slow mass loss” processes in Fig. 5(a).During the combustion,no subsequent‘‘slow mass loss”phase was observed.The reason might be that the coke deposit inside the micropores does not completely react with oxygen. Therefore, to confirm this speculation, the relative content of coke deposit on the surface of the regenerated SFCC catalyst and in the whole catalyst was measured by EDS, and combined with the relative content of coke deposit in FFCC, the conversion rate of carbon accumulation in the catalyst after reaction equilibrium can be calculated. The results are shown in Fig. 7. Under oxygen conditions,the relative content of catalyst carbon on the surface of the reacted particles can be restored to fresh catalyst levels, with the conversion of cumulative carbon on the catalyst surface all exceeding 90%. The result demonstrates the high reaction rate and regeneration efficiency of oxygen in the regeneration process.However,the efficiency of carbon removal is poor for the pore interior, and the carbon conversion is low in total, mainly limited by the carbon conversion rate inside the pores. The difference in the conversion amount between pores and particle surface gradually increased as the oxygen content increased. Comparing the reaction results in 20% O2/CO2and air, the participation of CO2instead of nitrogen increases the overall carbon conversion by 15.34% and the presence of gasification facilitates the reaction of the overall carbon. In addition, the efficiency of the pure gasification process at this temperature is not high due to the poor gasification activity of pure carbon dioxide. Instead, the overall carbon conversion of the catalyst was found to be comparable to the surface, which is mainly due to the volatile diffusion of the light olefins embedded in the pore channels to the outer surface of the particles for release at this temperature,reducing the amount of internal coke.It is also consistent with the results of Liet al. [3].
3.4. Pore structure evolution
Fig. 8 shows the nitrogen adsorption–desorption isotherms for the different classes of catalysts.According to the IUPAC classification [38], all kinds of catalysts exhibit specific type IV isotherm characteristic, which implies that the catalysts are a typical mesoporous material with a distinct capillary condensation step. There is a significant hysteresis in the desorption curve, demonstrating the presence of slit-shipped pores in addition to cylindrical and conical pores in the catalysts. The hysteresis phenomenon is obvious within the regenerated catalyst,indicating the increase in slitshipped pores, and it is related to the structural variation of the catalyst. Compared with SFCC, the regeneration curve increases at relative pressures below 0.1, corresponding to the adsorption of micropores within the regenerated catalyst.In addition,the hysteresis loops of the regenerated catalysts showed two different trends. Regeneration under CO2-free conditions showed H3-type isotherms characteristic of the hysteresis loops, which increased rapidly at relatively high pressures, implying that the catalysts regenerated by combustion showed significant macropore porosity compared to SFCC. In contrast,the regeneration in the presence of CO2shows H4isotherms, with mesoporous characteristics.
Fig. 8 shows that different atmosphere regeneration changed the particle pore structure. The detailed results of the pore size distribution of catalyst particles under different regeneration conditions are shown in Fig.9,and the pore volume data of micropores and total pores are shown in Table 5. The pore volume was reduced in the SFCC compared with the FFCC catalyst, an effect likely caused by the carbon/coking formed on the FCC catalyst and the porous structure changes close to the surface of catalyst particles [6,23]. The presence of coke deposit covers most of the micropores and mesopores on the catalyst surface, resulting in a 70%reduction in micropore volume and blocking most of the reaction sites.In contrast,the total pore volume is reduced by only 6%,which is attributed to the amorphization of molecular sieve crystals and the collapse of pore channels under thermal conditions,thus leading to an increase in macropores. The result is also observed by Salmanet al. [33].

Table 5Catalyst structure parameters before and after the reaction
In addition, the variations in catalyst structure during regeneration under different atmospheres are compared separately. The pore volume of catalyst micropores slightly increased under pure CO2conditions but did not fully recover to the fresh catalyst state,which is mainly limited by the low reactivity of the CO2gasification process. Under air or pure O2atmosphere, the pore volume and distribution of the reacted catalyst micropores are lower than those of the original FCC catalyst, but the total pore volume is higher. Reasons can be explained that the exothermic combustion led to a sharp increase in particle surface temperature in the regenerated environment.The crystalline shape of the mineral has changed, which further led to the collapse of the micropores and the formation of macropores within the catalyst matrix. Hence the total volume of the particles shrank.Comparing the four regeneration atmospheres, the micropores volume of catalyst particles increased under the regeneration conditions of pure oxygen, air,and 20% O2/CO2in volume, but the trend of total pore volume was the opposite. The result means that the damaging effect of combustion on the catalyst particle structure is weakened with the decrease of oxygen partial pressure.Interestingly,CO2gasification and oxygen combustion played a synergistic effect on the maintenance of the catalyst structure, and a portion of the heat generated by combustion is used to feed the gasification thus avoiding the destruction of the structure due to high temperatures in the catalyst matrix. Under the same conditions, CO2instead of nitrogen is taken to participate in the reaction to consume part of the combustion heat could increase the number of catalysts micropores by 32.4%.
3.5. Mineral transformation
The XRD pattern results of the fresh and regenerated catalysts are shown in Fig.10.The diffraction peaks show that kaolinite,silica, and alumina are the main crystalline phases in SFCC, with small amounts of silicon and silicon phosphide. While in SFCC,the overall signal-to-noise ratio of the catalyst decreased, indicating that the catalyst crystal structure is damaged and the kaolinite peak intensity is weakened, while crystalline peaks such as ironaluminum-silica, aluminum-iron, and lanthanum phosphide silica are formed.During the regeneration process under different atmospheres, the XRD half-peak width of kaolinite increases gradually in CO2, 20% O2/CO2, air, and O2,the peak intensity decreased, and the microcrystal size became smaller and less ordered. This is mainly attributed to the transformation of catalyst structure due to combustion gasification.
It has been shown that at high temperatures,the kaolinite crystalline phase undergoes thermal transformation, with kaolinite transforming to metakaolinite near 850 °C, while higher temperatures(~900°C)lead to the formation of spinel[39,40].The crystal structure changes from lamellar to amorphous shape,and the powder or particle porosity increases and collapses easily, resulting in the clogging of particle micropores and expansion of macropores.The catalyst is exposed to this temperature and the particles are prone to sintering.The decrease of kaolinite peak in the above four atmospheres proves that the catalyst mineral is damaged to an increased extent. The crystallographic transformation is also another proof to explain the change in the pore volume of catalyst particles.Meanwhile,the absence of carbon diffraction peaks in the XRD patterns of the deactivated catalysts, thus proving that the presence of carbon on the catalysts is in the amorphous form and deposited carbon is the main form causing the catalyst deactivation, which is consistent with the Raman spectroscopy results.
3.6. Activity of regenerated catalyst
Acidity is an important indicator of acidic catalyst activity[41,42].The experiment measured the total concentration and distribution of acid centers of the samples before and after the reaction, and the results are shown in Fig. 11 and Table 5. The lowtemperature desorption main peak exists at 180.4 °C for the FCC catalyst, which proves that the overall acidity of the catalyst is weak[43].As substances such as water bound in the particles were evaporating,the TPD profiles do not stabilize at high temperatures.After the catalyst is wrapped by the coke deposit, the amount of matrix acid decreased sharply to 0.396 mmol?g-1. Compared with the total acidity of FCC shown in Table 5, the loss of acidity may be caused by pore blockage by carbon deposits, poisoning of the active center, or destruction of the mineral structure.

Fig. 1. (a) Images of SFCC particle morphology and (b) element compositions from EDS analysis. C in the upper right photo means the carbon element distribution.

Fig. 2. (a) SEM image, (b) carbon distribution, and (c) elements of crushed SFCC.

Fig. 3. XPS analysis result of coke deposit in the SFCC catalyst.

Fig. 4. (a) Raman spectra of coke deposit and (b) fitting analysis.

Fig. 5. (a) TG curves and (b) carbon conversion versus regeneration time for the coke deposit on the particle surface at different atmospheres at 800 °C.

Fig. 6. (a) DSC curves of catalyst particle regeneration reactions under different atmospheres and (b) variation in particle temperature.

Fig. 7. Catalyst surface (w1) and overall (w2) carbon conversion after regeneration under different conditions.

Fig. 8. Adsorption-desorption isotherms of N2 at -196 °C for different catalysts.
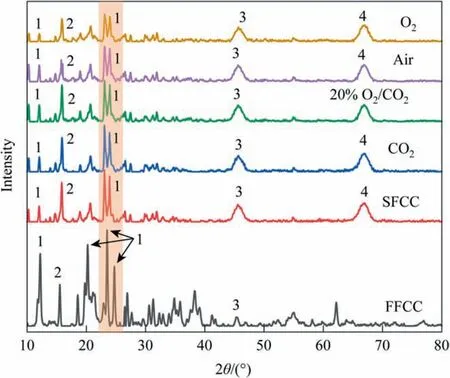
Fig. 10. XRD patterns of FCC catalysts after complete reaction under different atmospheres (1- kaolinite, 2-silicon, 3- iron aluminum silicon, 4- iron silicon).

Fig.11. The acidity distributions of the regenerated catalyst measured by NH3-TPD analysis.
During the regeneration process, as mentioned in the previous paper,the low reactivity of the gasification reaction led to the failure of complete gasification of the catalyst coke deposit, the total acidity amount is not significantly different from that of SFCC.However, after regeneration under other conditions, about 70% or more of the particulate acidity is permanently lost, and the total acidity loss gradually increased with the increase of oxygen partial pressure. It is mainly due to the destruction of the catalyst structure,which is consistent with the previous speculation.By comparing the regeneration results of both 20%O2/CO2and air groups,it is found that the total acidity increased by 27.1% in the case of the reaction with the passage of CO2at 800 °C compared to air. The presence of CO2is beneficial to reduce acidity loss.
3.7. Theoretical analysis and discussion
The schematic representation of the process is given in Fig. 12.The main type of surface area coke deposit is amorphous graphite,which has high reactivity. Therefore, in oxygen or air condition,combustion is rapid on the particle surface. Exothermic combustion leads to an increase in the temperature of the particle surface,which promotes the transformation of the kaolinite crystalline phase into an amorphous structure. Further, the particle structure is disrupted with microporous blockage and macropore expansion,which hinders the reaction of internal carbon accumulation.A certain amount of coke deposition still exists in the reacted catalyst particles.Combustion causes permanent damage to the service life of the catalyst.

Fig. 12. Pore structure evolution in the FCC catalyst under different reaction atmospheres (note: the figure is a simplified version and is not drawn to scale).
In contrast, the combination of gasification and partial oxidation weakened the damage to the structure. Previous studies have shown that in this process,gasification dominates at the beginning of the reaction [26]. The introduction of a 20% O2/CO2mixture ensures that both gasification and combustion can occur at the beginning of the reaction. The endothermic coke gasification consumed part of the heat from combustion,reducing the surface temperature of the catalyst,and weakening the damage to the particle structure. Further, the presence of CO2attenuates the damage to the micropores by combustion, thus allowing the reaction gas to penetrate deeper into the catalyst, and realizing more efficient removal of carbon from the catalyst.
4. Conclusions
In this paper, the regenerative reactivities of coke deposits in SFCC under four different atmospheres were investigated with analyses of pore evolution and mineral. Results showed that the coke deposit on the particle surface was graphite-like structure formed by carbon–carbon bonds, with small carbon microcrystal structure and high disordered degree of high reactivity. Furthermore, the regeneration under pure oxygen or air atmosphere had a satisfactory effect on removing coke from the catalyst surface but a poor effect on eliminating the coke inside the micropores.The reason attributed to the heat of combustion causing the structure transformation of the catalyst mineral, resulting in kaolinite changing to silica-aluminum spinel crystals.The structure changed from a laminar to an amorphous shape, which tended to collapse,causing a close of small pores and expansion of large pores.Regeneration by the coexistence of gasification and combustion, especially in O2/CO2, could maintain the pore structure and effectively remove the carbon deposit inside the micropores.Compared with the regeneration in air, the microporosity increased by 32.4%and the total acid amount rose to 27.1%after regeneration in O2/CO2, which showed better performance, owing to the limited gasification rate at low temperature in pure CO2. Consequently,the proper introduction of CO2in the catalyst regeneration process with O2can realize regeneration, maintain the activity and reduce carbon emission, which is important to extend the life of the catalytic cracking catalyst.
Data Availability
The authors are unable or have chosen not to specify which data has been used.
Declaration of Competing Interest
The authors declare that they have no known competing financial interests or personal relationships that could have appeared to influence the work reported in this paper.
Acknowledgements
This study is supported by the National Natural Science Foundation of China (21908063), the Shanghai Pujiang Program(21PJ1402300), the Fundamental Research Funds of the Central Universities (JKB01211715 and JKB01221677).
 Chinese Journal of Chemical Engineering2023年11期
- Chinese Journal of Chemical Engineering的其它文章
- Effects of the original state of sodium-based additives on microstructure,surface characteristics and filtration performance of SiC membranes
- Comprehensive analysis on the economy and energy demand of pressure-swing distillation and pervaporation for separating waste liquid containing multiple components
- Esterification of acetic acid with isobutanol catalyzed by ionic liquid n-sulfopropyl-3-methylpyridinium trifluoromethanesulfonate:Experimental and kinetic study
- Numerical investigation of film forming characteristics and mass transfer enhancement in horizontal polycondensation kettle
- COF-derived Co nanoparticles@N-doped carbon electrocatalysts for highperformance Zn-air batteries
- A potential-responsive ion-pump system based on nickel hexacyanoferrate film for selective extraction of cesium ions