
Pedestrian flow through exit: Study focused on evacuation pattern
2024-01-25 07:14BoSiZhang張博思ZhiHongYu余志紅BoLinSun孫柏林ZiYuGuo郭紫鈺andMoChen陳默
Chinese Physics B 2024年1期
Bo-Si Zhang(張博思), Zhi-Hong Yu(余志紅), Bo-Lin Sun(孫柏林), Zi-Yu Guo(郭紫鈺), and Mo Chen(陳默)
School of Safety Engineering,China University of Labor Relations,Beijing 100048,China
Keywords: evacuation,exit width,flow rate,queued evacuation pattern,random evacuation pattern
1.Introduction
In the Code for fire protection design of building GB 50016-2014 (2018 edition), the minimum evacuation clear width for every 100 persons(B)is specified for different kinds of buildings.The total width of exits can be calculated based on the total number of evacuees andBin the evacuation design of building.According to the calculation method,Bequals the product of the width of a single pedestrian stream and the number of required pedestrian streams for evacuating.Thus,a fundamental assumption for calculatingBis orderly evacuation at exits, that is, pedestrians pass through the exit in one queue or several queues.However, the evacuation process of people in panic is usually random and disordered; they may rotate their bodies or lower their shoulders to pass through the exit quickly by crowding other pedestrians.Owing to this,the number of pedestrian streams may be larger than the designed value,on the other hand,the evacuation speed may be reduced since the pedestrians are likely to be stuck at the exit when they are crowded.In a word,the evacuation pattern(queued or random) affects the evacuation rate of pedestrians at the exit,and the design result of exit width in building as well.If the evacuation rate with queued pattern is smaller than with the random pattern, the calculation result of exit width is conservative, otherwise, this influence should be considered in the safe margin.Thus,the evacuation rate with queued evacuation pattern and the evacuation rate with random evacuation pattern need comparing with each other and further studying.
The evacuation process and walking characteristics of pedestrians at an exit have received considerable attention.[1–3]The exit-selection behavior of pedestrians is important in simulating the evacuation process in a multiple-exit scenario.Loet al.[4]and Wanget al.[5]established pedestrian exit-selection models by using the game theory.Zarita and Lim[6]proposed a revised cellular automata model on exit selection behavior by introducing the probabilistic neural network.Liuet al.[7,8]established a multinomial logit discrete exit-choice model and the influence of information-inducing behavior of pedestrians was explored.Guo and Huang[9]investigated the evacuation processes in rooms with multiple exits through a cellular automata simulation embedded with a logit-based exit selection model.Xuet al.[10]proposed a multi-exit evacuation simulation model by using the deep neural network.Caoet al.[11]investigated the exit selection behavior of pedestrian under fire emergency by using an extended multi-grid model.In addition to these simulation studies, the exit-selection behaviors of pedestrians during evacuation have also been investigated through controlled laboratory experiments[12,13]and virtual reality experiments.[14]
The pass capacity decreases at the exit, which is typically a bottleneck in an evacuation route.[15]In emergency,the pedestrians want to pass through the exit quickly by crowding other pedestrians, which causes exit congestion and reduces the evacuation rate.[16]Therefore, the evacuation rate at an exit also earns considerable concerns as it has an appreciable influence on the total evacuation time in an emergency.When panic people who have high desired velocity evacuate through an exit,the flow rate may be lower than that of people whose desired velocity are slower: this is known as the faster-isslower(FIS)effect.[17]The FIS effect has been investigated by many researchers.[18–21]According to the researches by Muiret al.,[22]Zhanget al.,[23]and Qiuet al.,[24]the FIS effect is related to both the exit width and the location of exit.To reduce congestion at the exit and increase the evacuation rate in an emergency, it is found that placing an obstacle in front of the exit may be helpful.[17]Many studies have tested the influence of obstacles on the exit evacuation rate through numerical simulation models,[4,25–27]human participant experiments,[28–30]and nonhuman biological experiments.[31–33]In these studies,opinions on the effectiveness of obstacles in increasing the flow rate at the exit are inconsistent.Shiwakotiet al.[34]indicated that the effectiveness of an obstacle is conditional,and that the conditions under which an obstacle can improve the flow rate at an exit still need clarifying.
The characteristics of the exit and pedestrians also influence the pedestrian flow features at the exit.Yanagisawa and Nishinari[35]and Wanget al.[36]indicated that the exit width can improve evacuation through an exit.Li and Xu[37]presented the most advantageous exit width of the limited-space building in terms of both the evacuation time and the construction cost.The study of Liuet al.[30]showed that the corner exits have a greater effect on the evacuation rate through an exit than the center exits.Wanget al.[36]and Yanagisawa and Nishinari[35]reported that the relative effectiveness of the evacuation rate between center exit and corner exit is related to the exit width and the pedestrian mood(cooperative or competitive).In addition to the exit width and location,other properties of the exit are considered, such as the angle of exit[38]and entry restriction in front of a dual-exit (stair and escalator) bottleneck.[39]Regarding the pedestrian characteristics,the influences of inactive(stationary)pedestrians and pedestrians with crutches on pedestrian dynamics through exits were investigated by Liuet al.[40]and Huet al.,[38]respectively.
To sum up, there have been many studies of the evacuation process and walking characteristics of pedestrians at exits.However, only a few studies have focused on the influence of movement rules of pedestrians at the exit, which is mainly concerned in the present study.Liuet al.[41]investigated the inflow process of pedestrians through a door under different movement rules experimentally.With the door widths of 0.5 m, 1.0 m, and 1.5 m, the pedestrian inflow experiments were conducted with random,one-queue,and twoqueues movement rules,respectively.According to the experimental results,they reported that pedestrians should queue up to enter the room,and the number of queues should match the door width in consideration of both pedestrian safety and traffic efficiency.The influence of the corridor width in front of a bottleneck on the walking behavior of pedestrians was investigated experimentally by Adrianet al.[42]In their experiments,the exit width was fixed at 0.5 m, and the corridor width was varied from 1.2 m to 5.6 m.They indicated that the corridor width is an important factor affecting the movement of pedestrians in the corridor (whether they queued up or not).The transition widths of corridor where the pedestrian walking behavior changes from queuing to crowding is in a range from 1.2 m to 2.3 m.In a crowded wide-corridor scenario,pedestrians spend most of their time in congestion.Zhuanget al.[43]studied the constraint mechanism of queues at a bottleneck,and conducted controlled experiments in a room with one exit and three entrances.The experiments included the normal walking scenario and queue walking scenario.The results showed that queuing of pedestrians requires more time than normal walking; queuing of pedestrians is more orderly.According to these studies,the movement rules of pedestrians(randomly or queued)had obvious influences on the flow rate and passing of pedestrians at a bottleneck.Overall,queuing of pedestrians lead to the ordered passage through an exit.Random entrances and exits are more likely to cause pedestrian congestion and threaten pedestrian safety.However,there are few quantized conclusions regarding the difference between the flow rate at an exit in random process and the flow rate at an exit in queued process;the influences of crucial factors such as the personnel density and exit width in random process and those in queued process also require further investigation.
Thus,a comparative study of the pedestrian flow through an exit with queued evacuation pattern and that with random evacuation pattern is conducted experimentally in the present work.The evacuation processes and walking characteristics of pedestrians at an exit with queued and random evacuation patterns are compared with each other in 25 scenarios.
2.Experimental setting and procedure
Experiments on pedestrian flow through exits with queued and random evacuation patterns were conducted in a university classroom on October 23, 2022, with permission from the administrator.The layout of the experimental region with dimensions of 5.0 m(W)×4.0 m(L)is shown in Fig.1.The experimental region was enclosed by 14 desks; all desk legs were locked to ensure that they did not move when the participants collided with them during the experiments.The exit was located on the front side of the experimental region;its width, which varied in different scenarios, was controlled by the distance between the desks on the front side.The nearest obstacle (classroom platform) was approximately 2.5 m away from the exit, so as not to reduce the walking speed of the participants significantly after the participants had exited.
A camera for recording the experimental process at a frequency of 25 frames per second was set at a distance of about 3.0 m outside the exit; the camera was approximately 3.0 m above the floor.The walking characteristics of pedestrians at the exit were derived by analyzing the experimental video.For recognition purposes, the exit location was marked with yellow tape on the floor,as shown in Fig.1(blue line in the diagram).
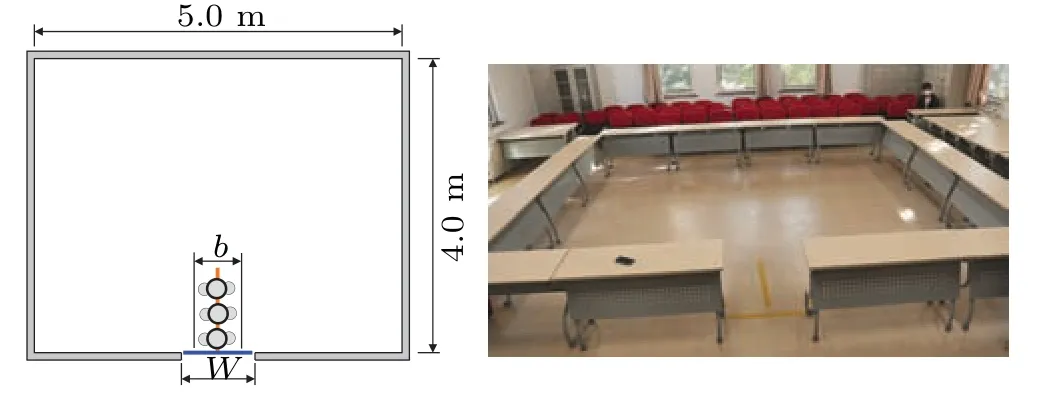
Fig.1.Layout of experimental region.
The experimental conditions are presented in Table 1.The personnel density ranged from 1.0 person/m2to 1.8 person/m2,and the exit width ranged from 0.8 m to 1.8 m.In each scenario, the participants walked out of the exit in queued and random evacuation patterns respectively.A total of 36 participants(10 male and 26 female)participated in the experiments, and they were numbered from one to thirtysix.The participants were all university students aged 19–23 years, and their heights ranged from 156 cm to 186 cm.The experiments were voluntary and paid,and all participants were notified of the experimental content and procedures before the experiments.
In the queued evacuation experiments,the number of people stream depended on the exit widthWand the width of a single stream of peoplebas shown in Fig.1.As all the participants were adults,the width of a single stream of people was taken as 0.55 m according to the Code for fire protection design of buildings.The number of people streams specified in the queued evacuation experiments was the maximum number of people streams that the exit can accommodate.Thus, only one stream of people was at the exit in the queued evacuation experiment whenWwas 0.8 m and 1.0 m.Two streams of people were present at the exit in the queued evacuation experiment whenWwas 1.2 m and 1.5 m.For the queued evacuation experiment withW=1.8 m,three streams of people were present at the exit.The guide lines of each stream were marked with yellow tape on the floor in the experiments as shown in Fig.1(orange line in the diagram).In the queued evacuation experiments, the participants were instructed to leave the experimental region through the exit in lines as soon as possible;they could choose any queue to line up.In the random evacuation experiments,the participants did not need to queue in the evacuation process.The participants were instructed to leave the experimental region through the exit as soon as possible under the premise of ensuring safety.The experimental procedures of each experiment were listed as follows.
(i)Inform the number of participants who should participate in the experiment.
(ii) Declare the evacuation pattern and the experimental requirement.
(iii) Start the experiment, and the participants evacuate through the exit following the experimental requirements.
(iv) Terminate the experiment after the last pedestrian walked out of the experimental region.
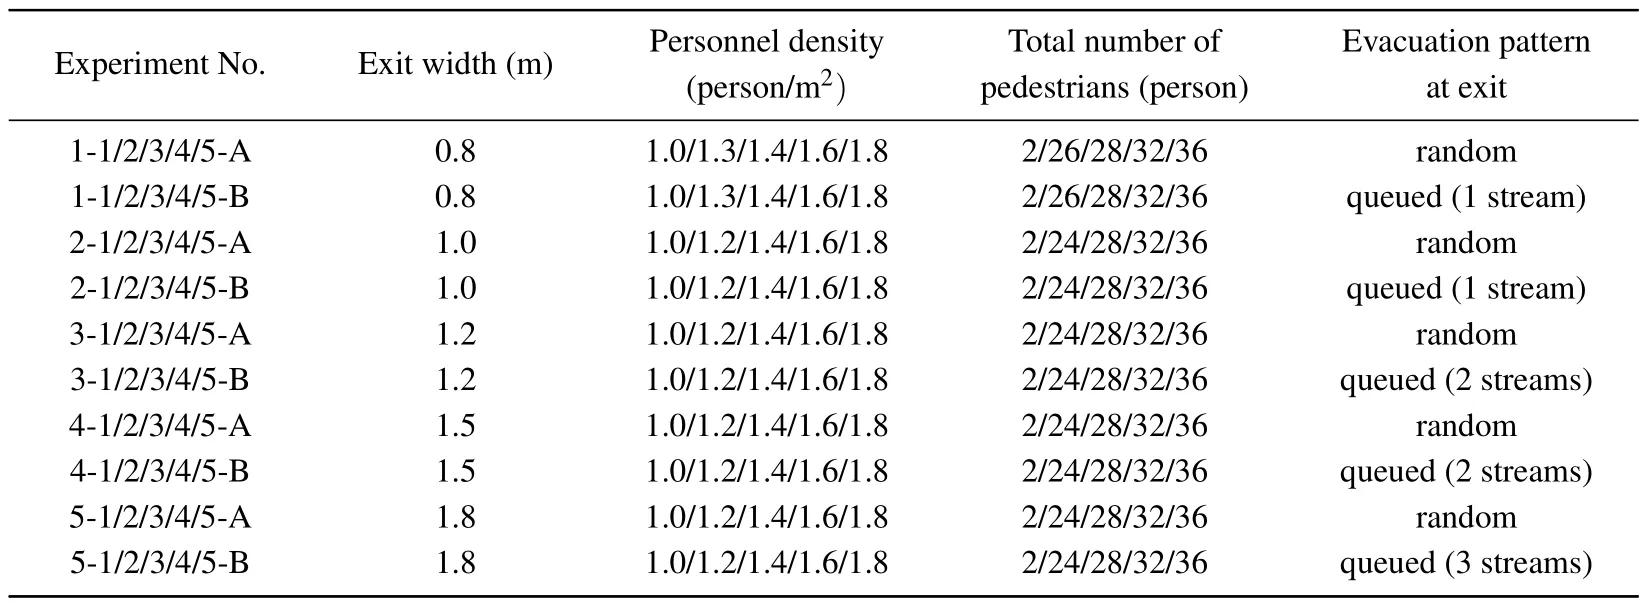
Table 1.Conditions of each experiment.
3.Experimental analysis and discussion
3.1.Macroscopic analysis of evacuation process
A comparison of the evacuation process with queued evacuation pattern and the evacuation process with random evacuation pattern is shown in Figs.2 and 3.In the experiments as shown in Fig.2,Wis 1.0 m and the personnel density is 1.6 person/m2, representing a narrow-exit condition in the macroscopic analysis of evacuation process.In Fig.2(a), the pedestrians with the random evacuation pattern are crowded in front of the exit.Some pedestrians rotate their bodies or lower their shoulders to pass through the exit along with other pedestrians.According to the experimental video, there are up to three pedestrians crossing the exit together in the experiments withW=1.0 m,which is narrower than twice ofb,and these pedestrians may block the exit and push each other.This is the main reason why the congestion happens at the exit in random evacuation experiments withW=1.0 m, on the other hand,it also increases the flow rate of the exits due to the fact that the utilization of the exit increases compared with the queued evacuation experiments.In the experiments, people far from the exit quickly move to the exit, forming an arch, because they all want to leave as soon as possible.These pedestrians have to stop when they are close to the exit because the flow rate of the pedestrians is limited in the narrow-exit scenarios.
The evacuation process in this scenario with a queued evacuation pattern is illustrated in Fig.2(b).When the experiment begins,the participants ran through the exit in an orderly line, and there is almost no pushing or squeezing in front of the exit.The pedestrians far from the exit gradually move toward the pedestrian line.Although some pedestrians attempt to jump into the queue in the middle,the entire evacuation process is more orderly with the queue evacuation pattern than with the random evacuation pattern.Comparing Fig.2(a)with Fig.2(b),the evacuation time with the random evacuation pattern is noticeably less than with the queue evacuation pattern,owing to a greater flow rate at the exit.
In the experiments illustrated in Fig.3,Wis 1.8 m and the personnel density is 1.6 person/m2, representing a wide-exit condition in the macroscopic analysis of evacuation process.Pushing and squeezing of pedestrians is also observed at the exit in the random evacuation experiment,but the crowdedness of pedestrians at the exits is somewhat relieved compared with that in the random evacuation experiments withW=1.0 m.In the queued evacuation experiment withW=1.8 m, there are three people streams at the exit.The pedestrians ran out of the exit in an orderly manner in three lines, but there are still few queue-jumps in the streams.Comparison of Fig.3(a)with Fig.3(b)shows that the evacuation time in the queued experiment is longer than that in the random experiment.In the conditions withW=1.8 m,the difference in the number of pedestrians crossing the exit side by side with the random evacuation pattern and queued evacuation pattern is not so large as that in the conditions withW=1.0 m.Since the pedestrians can access the exit from any directions with the random evacuation pattern,the pedestrians at the exit are more crowded than with the queued evacuation pattern,that is to say,the time interval between the pedestrians to access the exit is shortened.In addition to the increase of the number of pedestrians passing through the exit side by side,the decrease of time interval for the pedestrians to enter the exit is also a reason why the evacuation process in the random evacuation pattern is faster but more unsafe(crowded)than that in the queued evacuation pattern.

Fig.2.Evacuation through a narrow exit with queued and random evacuation patterns(blurred for privacy protection).(a)Experiment 2-4-A,(b)experiment 2-4-B.
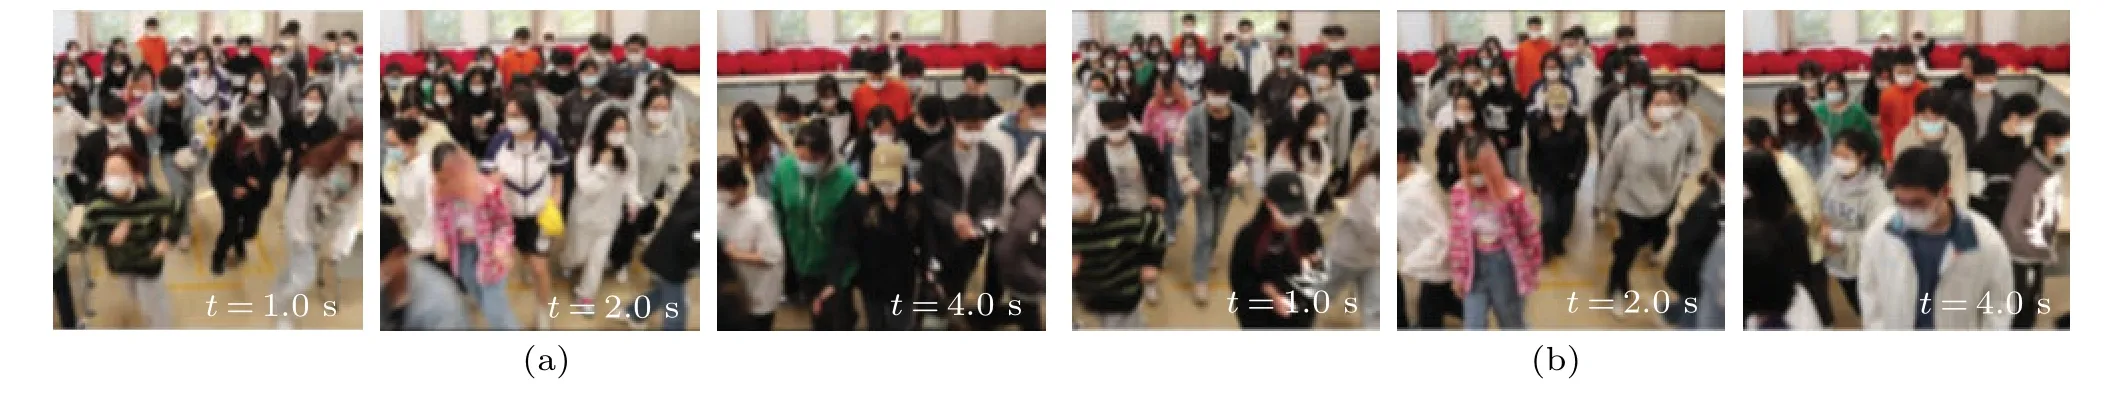
Fig.3.Evacuation through wide exit with queued and random evacuation patterns(blurred for privacy protection).(a)Experiment 5-4-A,(b)experiment 5-4-B.
3.2.Walking characteristics of pedestrians at exit
Based on the discussion in the above subsection,the evacuation time with the random evacuation pattern is less than with the queue evacuation pattern,but the evacuation process in the random evacuation experiments is less safe, since the pedestrians in front of the exit are more crowded.
The main reasons for these are the increase of the number of pedestrians exiting at the same time (N) and the decrease of the time interval between the front row and rear row of people (Δt) as illustrated in Fig.4.The above two parameters are mainly discussed in this subsection, which is helpful in understanding the difference between the evacuation process with queued evacuation pattern and the evacuation process with random evacuation pattern.BothNand Δtare obtained by analyzing the experimental video frame by frame in the present study.For a specific frame of video,the number of pedestrians crossing the yellow tape(used to mark the exit location in the experimental region)simultaneously is regarded asNfor this moment.The time interval between the rows of pedestrian crossing the exit successively is recorded as Δt.

Fig.4.Diagram of two parameters representing walking characteristics of pedestrians at exit.
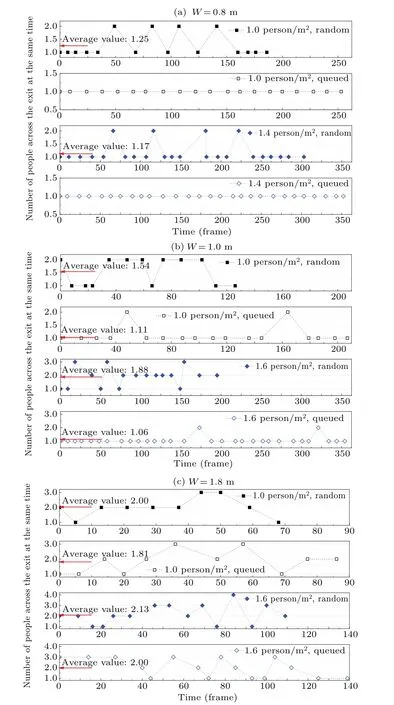
Fig.5.Number of people across the exit at the same time in different scenarios.
A comparison ofNvalues between queued evacuation pattern and random evacuation pattern in different scenarios is shown in Fig.5.In experiments ofW=0.8 m,N=1 with the queued evacuation pattern.With the random evacuation pattern,in most cases,N=1,because the exit is narrow.However,it can become two as shown in Fig.5(a).This means that two pedestrians rotate their bodies or lower their shoulders to go through the exit together, even though the exit is not wide enough for them to pass side by side.
Exiting is difficult in this condition.Thus,the time interval between the front row and rear row of people is typically longer whenN=2.In the random evacuation experiments,the average value ofNis 1.25 when the personnel density is 1.0 person/m2, and the average value ofNis 1.17 when the personnel density increases to 1.4 person/m2as shown in Fig.5(a).This indicates that the average value ofNdoes not increase with the personnel density increasing whenWis 0.8 m.
In the experiments withW=1.0 m,the pedestrians walk in one stream when crossing the exit with the queued evacuation pattern.However,in rare cases,N=2 in the queued evacuation experiments withW=1.0 m.The average values ofNare 1.11 and 1.06 with personnel densities of 1.0 person/m2and 1.6 person/m2, respectively.This is becauseWis much wider thanb, and the participants want to exit as soon as possible.In the random experiments, the average value ofNis 1.54 when the personnel density is 1.0 person/m2; the average value ofNis 1.88 when the personnel density is 1.6 person/m2.The value ofNis much larger in the random evacuation experiments than in the queued evacuation experiments.The maximum value ofNis 2 when the personnel density is 1.0 person/m2, and the maximum value ofNis 3 when the personnel density is 1.6 person/m2.
In the experiments withW=1.8 m,the pedestrians walk in three streams when crossing the exit with the queued evacuation pattern.Unlike the experiments withW=1.0 m, the maximum value ofNin the queued experiments does not exceed the designed value.In the queued experiments,Nwill also be one or two as shown in Fig.5(c).This is because pedestrians in the three streams may not arrive at the exit simultaneously.The average values ofNare 1.81 and 2.00 in the queued experiments with personnel densities of 1.0 person/m2and 1.6 person/m2, respectively.In the random experiments,the values ofNare 1, 2, and 3 when the personnel density is 1.0 person/m2; the average value ofNis 2.00.When the personnel density is 1.6 person/m2,Ncan reach to 4, except for three values in the last condition.The average value ofNis 2.13 in the random evacuation experiment with a personnel density of 1.6 person/m2.As with the queued evacuation experiments,the average value ofNin the random evacuation experiments is larger whenW=1.8 m.However,the difference inNbetween the two evacuation patterns whenW=1.8 m is smaller than that in scenarios withW=1.0 m.
For a comprehensive analysis, the average values ofNand Δtin all experiments are summarized in Table 2 and 3;the maximum values ofNin all random evacuation experiments are illustrated in Fig.6.In Table 2 and 3, R and Q represent the random evacuation pattern and the queued evacuation patterns,respectively.
In Table 2,the average value ofNwith the random evacuation pattern is greater than that with the queued evacuation pattern for each scenario.This means that the utilization ratio of the exit increases when pedestrians are allowed to evacuate through the exit randomly;however,this also leads the pedestrians to push and squeeze as shown in Figs.2 and 3.Based on the average value,the difference inNbetween the queued evacuation experiment and the random evacuation experiment is greater whenW=1.0 m andW=1.5 m than with the other three exit widths.According to the average value ofN, the influence of personnel density onNis not significant.Perhaps this may be because the participants can gather toward the exit quickly even in the low-personnel density scenarios,owing to the fact that the experimental region is not very large in this study.So, the influences of the personnel density in the entire experimental region on the local density of pedestrian at the exit and the walking characteristics of pedestrians at exit are not significant.The variation law of the average value ofNwithWis not obvious either.This is because pedestrians in different streams may not arrive at the exit at the same moment in wide-exit conditions,thus,Nis small sometimes,affecting the average value.In the queued evacuation experiments, the entire evacuation process is ordered,andNis usually equal to or smaller than the design value of the people stream based onW.It may be larger than the design value in rare cases as shown in Fig.5.In the random evacuation experiments, the evacuation process is disordered andNincreases with both personnel density and exit width increasing from the perspective of the maximum value ofNas shown in the following Fig.6.
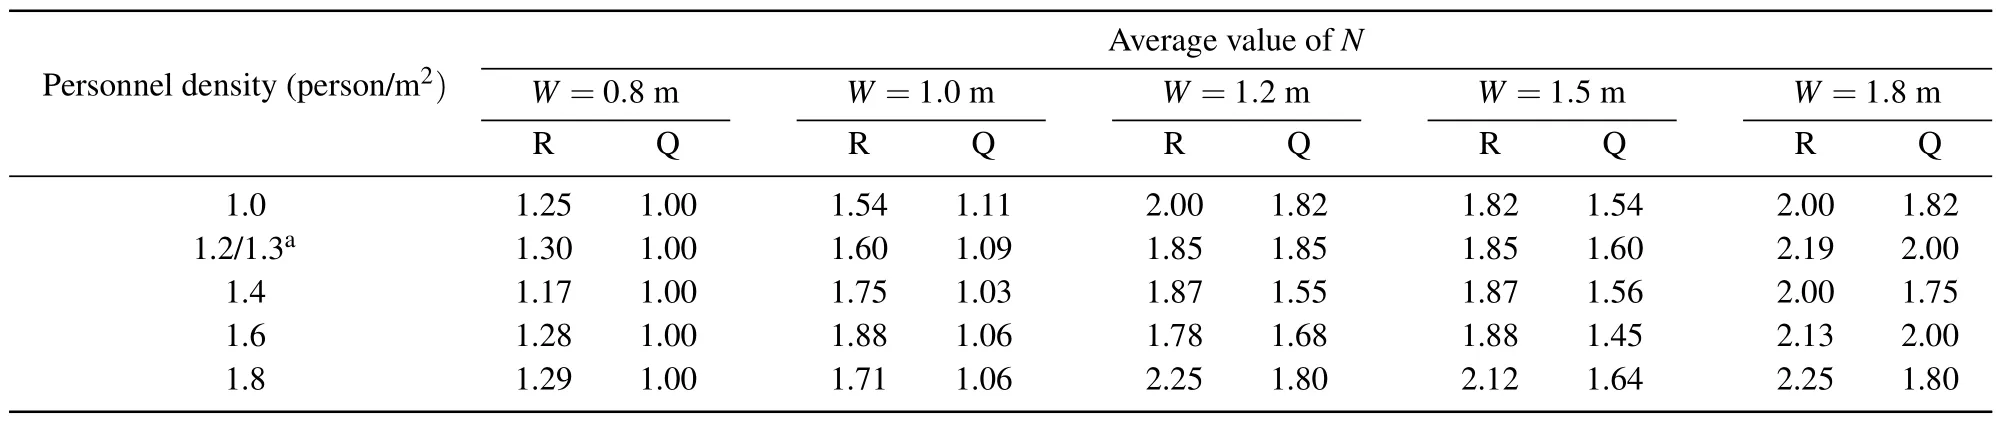
Table 2.Number of people across exit at the same time,N.
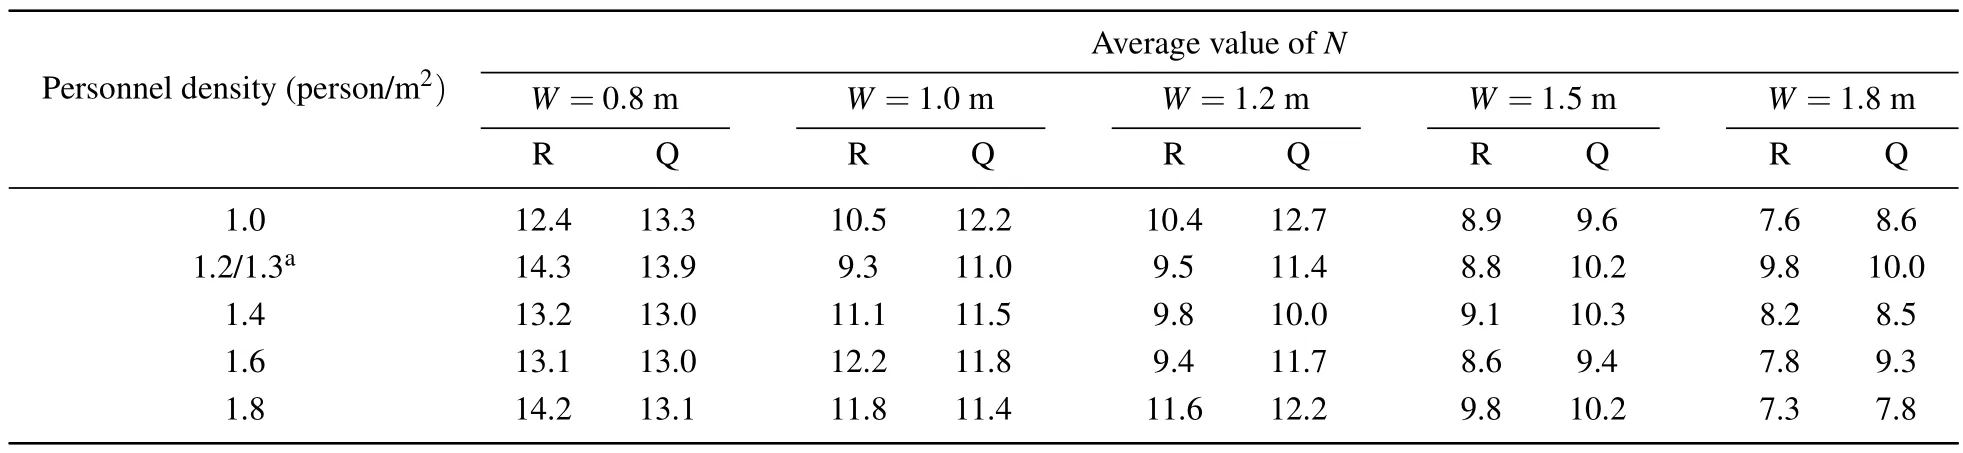
Table 3.Average value of interval time Δt between people in front row and rear row under different values of W.
The time interval between the front row and rear row of people is also an important parameter affecting the flow rate of pedestrian at the exit.Based on the average value of Δtin all scenarios presented in Table 3,the personnel density shows no significant influence on Δt.As illustrated in Figs.2 and 3,there are more pedestrians in front of the exit in the random evacuation experiments than in the queued evacuation experiments.Therefore, pedestrians enter the exit faster after the preceding pedestrians have passed, which is often a shorter Δtin the random evacuation experiments.However, Δtof the random evacuation experiment is larger than that of the queued evacuation experiment in some cases withW=0.8 m orW=1.0 m.This is because the pedestrians may be stuck at the narrow exit with the random evacuation pattern when several pedestrians want to exit together in narrow exit scenarios,which counteracts the advantage of the random evacuation pattern in reducing Δt.In the wide-exit cases,it is not common for pedestrians to remain stuck at the exit.Thus,in conditions of exit widths of 1.2 m, 1.5 m, and 1.8 m, the average values of Δtwith the random evacuation pattern are all less than those with the queued evacuation pattern.In the queued evacuation experiment, the average value of Δtdecreases withWincreasing,and it does in the random evacuation experiment.
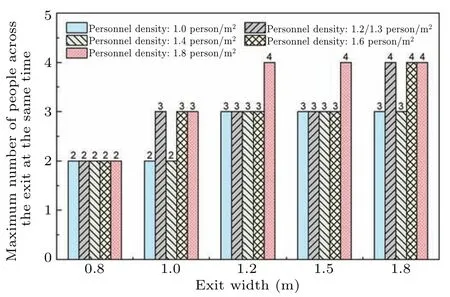
Fig.6.Maximum number of people across exit at the same time in different scenarios with random evacuation pattern(The personnel density of the second scenario was 1.3 person/m2 when W =0.8 m,and equaled 1.2 person/m2 in scenarios with other exit widths).
3.3.Flow rates at exit with different evacuation patterns
Based on the above discussion,Nis greater in the random evacuation experiments,and Δtis shortened in large-exit conditions when pedestrians evacuate randomly.These will affect the flow rate at the exit with the queued evacuation pattern and random evacuation pattern.In this subsection,the flow rates of pedestrians at the exit in different scenarios are presented,and the influences of the exit width on the flow rate of pedestrians at the exit are explored in detail.
The numbers of evacuated peopleNeversus time in different scenarios withW=0.8 m,1.0 m,and 1.8 m are plotted in Fig.7.The“zero point”of time illustrated in Fig.7 refers to the 10 frames before the first pedestrian evacuated through the exit, rather than the start time of the experiment, as the initial locations of participants are random.With the unified“zero point”,the comparisons of experimental results become more intuitive but do not affect the slope of the linear fitting as shown in Fig.7.The flow rate of pedestrians will be discussed in the following.The evacuation times for each experiment are shown in Fig.7.For both evacuation patterns,the evacuation time increases with personnel density increasing and decreases with exit width increasing.With the same exit width and personnel density, the evacuation time in the queued evacuation experiment is longer than that in the random evacuation experiment.According to Fig.7, the differences in evacuation time between the queued evacuation experiment and the random evacuation experiment withWof 1.0 m are greater than with the other two conditions illustrated in Fig.7.
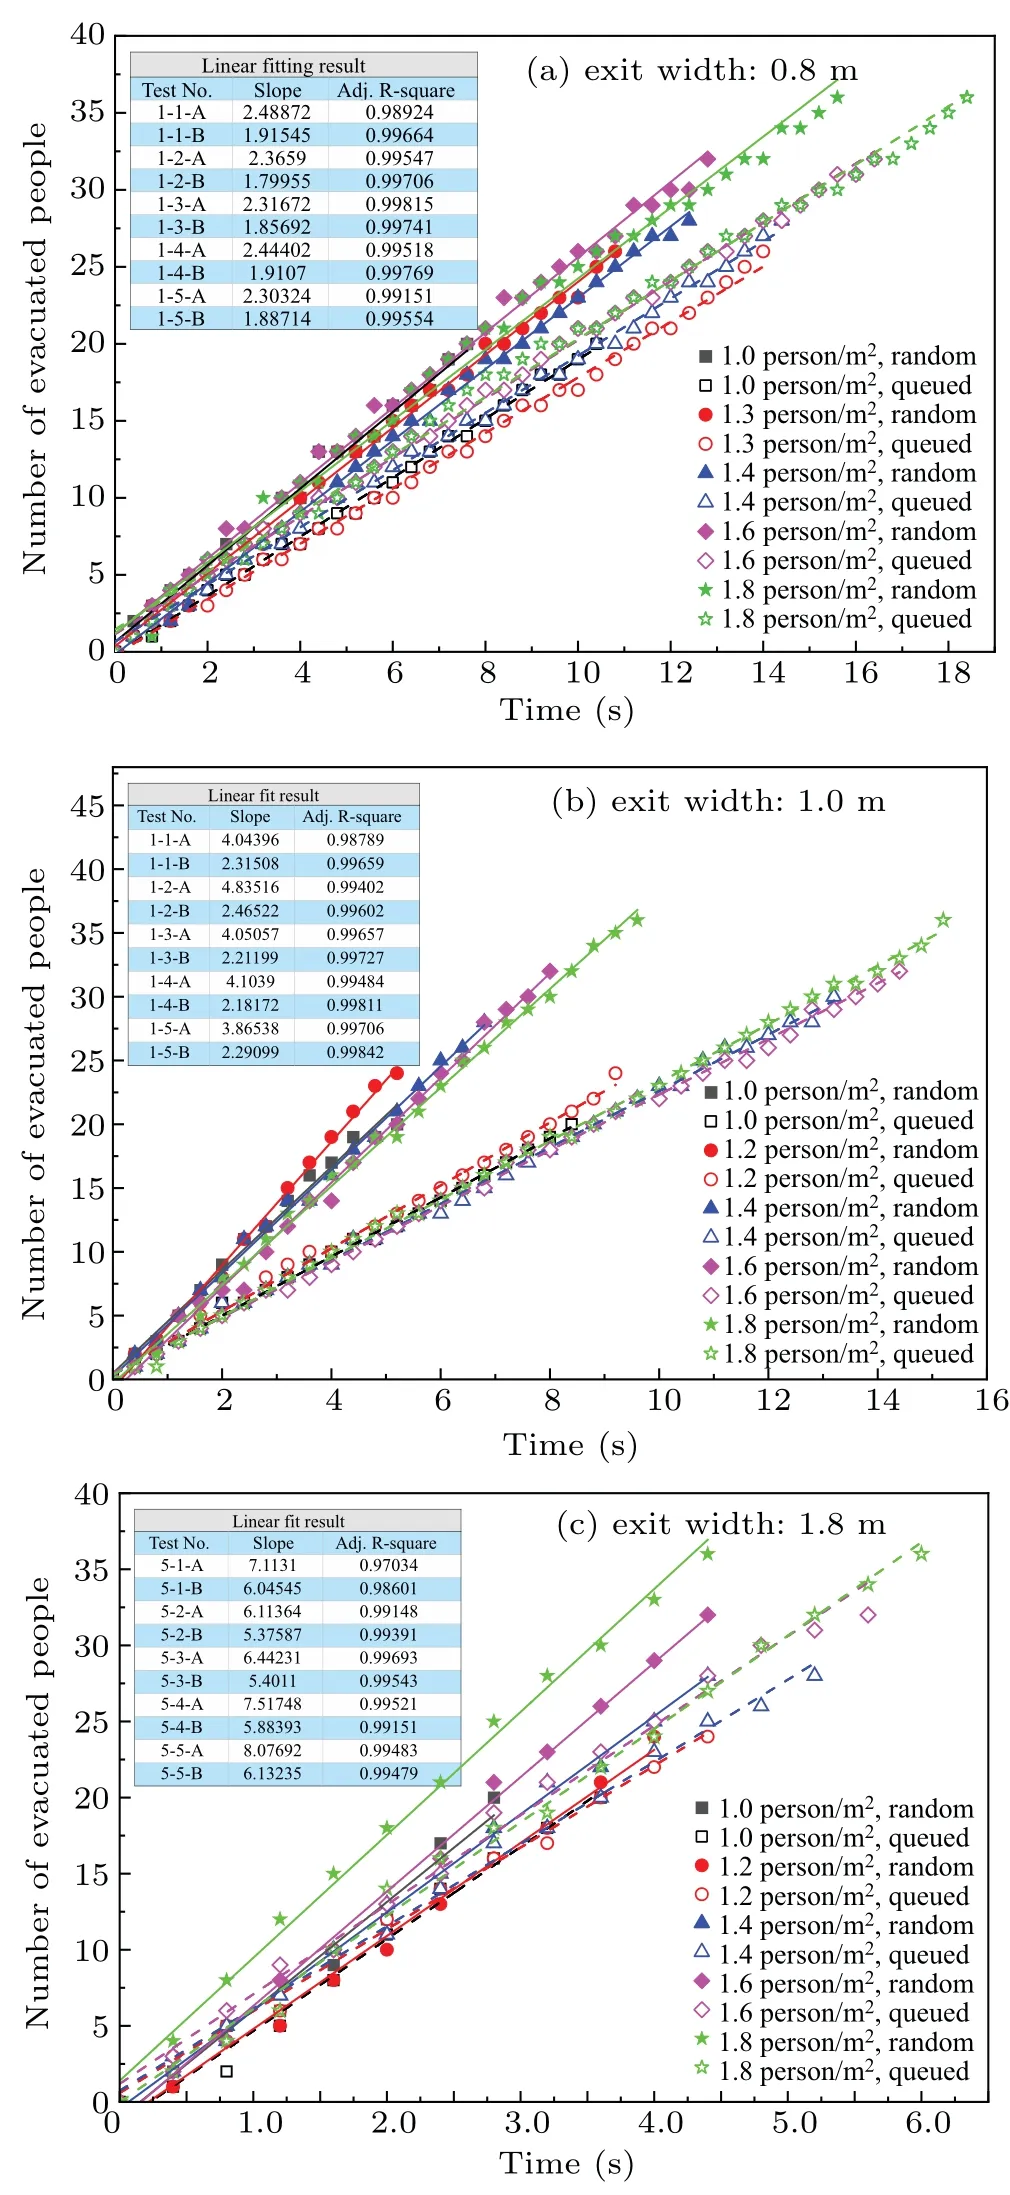
Fig.7.Number of evacuated people versus time and linear fitting results.
In Fig.7,a linear relationship exists betweenNeand time.Thus,linear fitting of the curves ofNeversus time is performed for all scenarios;the flow rate of pedestrians at the exit is denoted by the slope of the linear fitting.The flow rates of the people at the exit, derived by using the same method for all experiments, are summarized in Table 4.The meanings of R and Q in Table 4 are the same as those in Tables 2 and 3,which represent the random evacuation pattern and the queued evacuation pattern,respectively.LikeNand Δt,there is no obvious relationship between the flow rate of people at the exit and the density of people under the same evacuation pattern.With the increase ofW, the flow rate of people increases for the two evacuation patterns.
The flow rates of pedestrians at the exit in the random evacuation experiments are larger than in the queued evacuation experiments for all scenarios.This implies that the design value of the total exit width of a building,which is calculated based on the total number of evacuees andB(on the assumption that the evacuees pass through the exit in one queue or several queues),is conservative,even though not all evacuees evacuate in lines in emergency.It should be noted that the above conclusion is obtained through the controlled experiments on random evacuation under moderate crowding condition,and the extreme crowding condition and accident condition need further investigating.
As mentioned before, the difference in evacuation time(as well as the flow rate at exits)between the two evacuation patterns is mainly related to the differentNand Δt.The increase ofNand decrease of Δtare also the main reasons for the congestion at the exit in the random evacuation pattern.To some extent, the difference between the flow rates of the experiments with the random evacuation pattern ˙FRand queued evacuation pattern ˙FQcan represent the degree of crowdedness at the exit when the pedestrians evacuate through the exit randomly in panic.It can be seen from Table 4 that the difference between ˙FRand ˙FQis related to the difference betweenWand the total width of all accommodated people streams,which is defined as the surplus width of the exit in the present study.To represent this relationship, two dimensionless quantities are defined as
wherenis the accommodated number of people stream for a certain value ofW:n=1 withWof 0.8 m and 1.0 m;n=2 withWof 1.2 m and 1.5 m;n=3 withWof 1.8 m.These dimensionless quantities are used to represent the difference in flow rate between random evacuation pattern and queued evacuation pattern, and the surplus width of the exit, respectively.
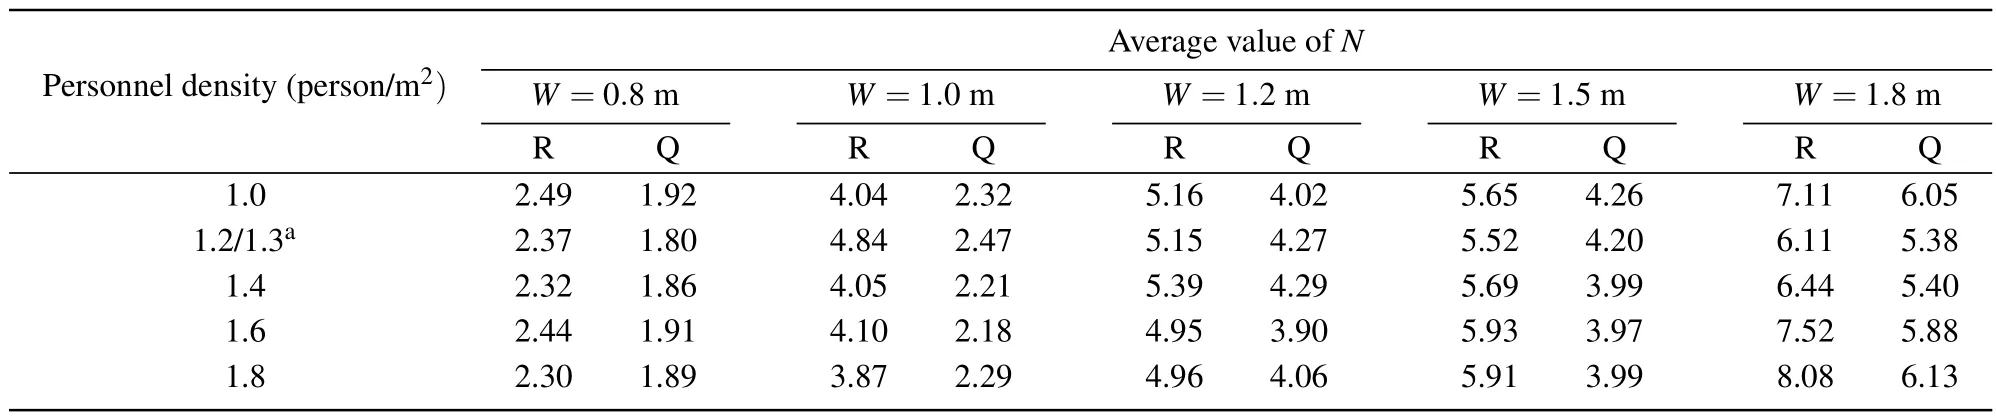
Table 4.Flow rate at exit with queued and random evacuation patterns.
The relationship betweenF?andW?is shown in Fig.8.The box plots represent the statistical results forF?in scenarios with different personnel densities with a certainW?.It should be noted that the personnel density of the second scenario is 1.3 person/m2whenW=0.8 m, and equals 1.2 person/m2in scenarios with other exit widths as mentioned before.Based on the mean value of each box,F?increases withW?increasing.WhenW?is less than 0.45,the variation range of the mean value ofF?is small, and all mean values ofF?are less than 0.28.This indicates that the difference in flow rate between the two evacuation patterns is relatively small(less than 28%of ˙FQ)when the surplus width of the exit is no more than 45%ofb.WhenW?is 0.73, the mean value ofF?increases to 0.408; the mean value ofF?reaches 0.82 whenW?increases to 0.73.This implies that the difference in flow rate between the two evacuation patterns increases significantly with the augment of twoW?values.
The conditions with two largeW?values (i.e.large surplus width of the exit) correspond to the scenarios withW=1.0 m and 1.5 m.According to Table 2,the differences in average value ofNbetween the random evacuation pattern and queued evacuation pattern are also significant in these scenarios.It means that the large surplus width of the exit leads the value ofNand the flow rate in the random evacuation experiment to increase compared with those in the queued evacuation experiment,but at the same time it also leads the crowdedness of the exit in the random evacuation experiments to increase,which can be verified from the process of the evacuation experiments.Therefore,the surplus width of exit should be limited especially when the exit is narrow in the evacuation design of building in case the pedestrians evacuate not all in a queued manner and the congestion of crowds is intensified.The relationship betweenF?andW?obtained in the present study can provide the design basis to some extent,that is,the surplus width of the exit should not exceed 45%of the width of a single pedestrian stream.
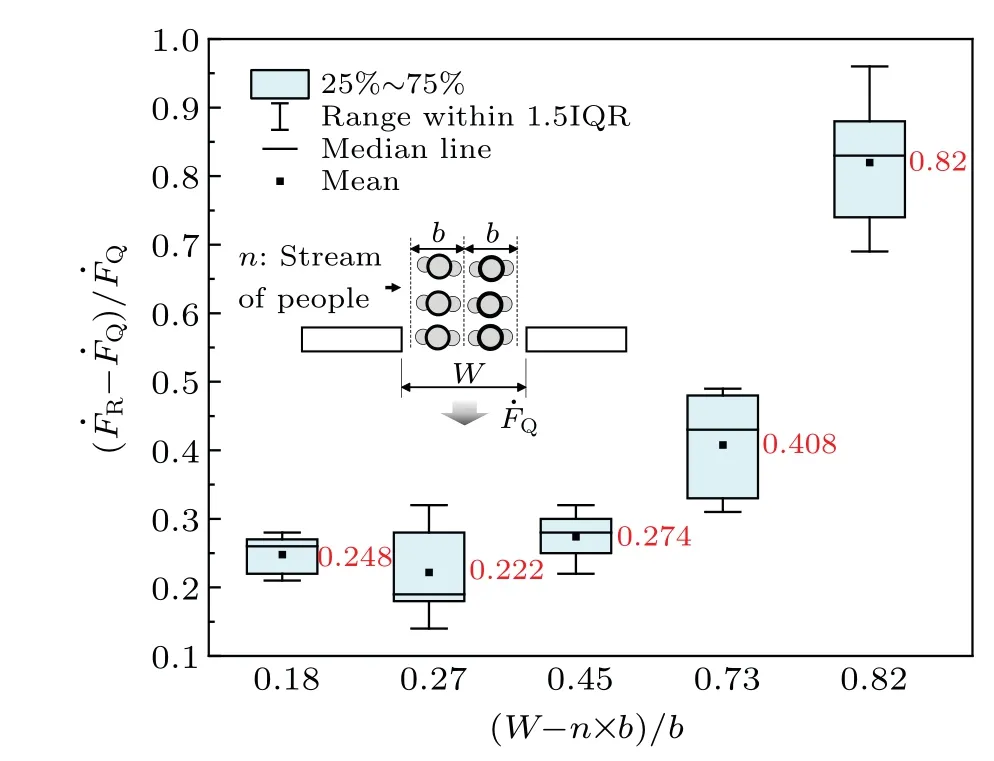
Fig.8.Plots of difference in flow rate with queued and random evacuation patterns versus surplus exit width.
4.Conclusions
A comparative study of pedestrian flow through exits with queued evacuation pattern and random evacuation pattern is conducted experimentally.Fifty experiments are conducted;typical behaviors of pedestrians in the evacuation process,walking characteristics of pedestrians at the exit,and the flow rate at the exit with the two evacuation patterns are studied.
The experimental result show that the number of people crossing the exit simultaneously,N, is greater in the random evacuation experiments than in the queued evacuation experiments.In the narrow-exit conditions,the relationship between the time interval between the front and rear rows of people,Δt, with the queued evacuation pattern and that with the random evacuation pattern is ambiguous.In the wide-exit condition, Δtis shortened when people can evacuate randomly through the exit.In all scenarios explored in this study, the flow rate of pedestrians at the exit is smaller in the queued evacuation experiment than in the random evacuation experiment.This implies that even though not all pedestrians comply with queued evacuation instructions in actual emergency conditions, the evacuation time is still shorter than the designed value, which is calculated on the assumption that all pedestrians evacuate in one queue or several queues, given that the extreme crowding and stampede accidents do not occur.The method of calculating the total evacuation width of building based onBis conservative but acceptable.It should be noted that the crowdedness of pedestrians at the exit is higher with the random evacuation pattern than with the queued evacuation pattern.So,the risk of stampede accident is high with the random evacuation pattern,which should be avoided in emergency.
Two dimensionless quantitiesF?andW?are defined to represent the difference in flow rates between random evacuation pattern and queued evacuation pattern and the surplus width of the exit which is greater than the total width of all accommodated people streams, respectively.The experimental results show thatF?is low whenW?does not exceed 0.45.In the conditions with the two largerW?(0.73 and 0.82),F?rises suddenly,which is mainly due to the increase of the difference inNbetween the random evacuation pattern and the queued evacuation pattern.Since the number of people streams specified in the queued evacuation experiments is the maximum number of queues than that the exit can accommodate,the increase ofNwith random evacuation pattern can increase the flow rate of pedestrians,but also enlarges the crowdedness of pedestrians at the exit as well.Therefore,the surplus width of the exit should be limited especially in narrow exit conditions,and the relationship betweenF?andW?derived in the present study can provide the the basis to some extent,that is,the surplus width of the exit should not exceed 45%of the width of a single pedestrian stream.
Acknowledgement
Project supported by the Special Funds for Basic Operating Expenses of the Centre University of China (Grant No.23ZYJS006).
猜你喜歡
現代裝飾(2022年5期)2022-10-13
風流一代·青春(2022年8期)2022-05-30
考試與評價·七年級版(2020年6期)2020-11-02
創新作文·初中版(2019年1期)2019-07-04
小哥白尼(軍事科學)(2018年8期)2018-09-12
海峽姐妹(2017年7期)2017-07-31
藝術評鑒(2017年9期)2017-07-06
意林(2015年18期)2015-05-14
快樂作文·低年級(2015年1期)2015-03-26
視野(2011年21期)2011-11-21

- Chinese Physics B的其它文章
- Photophysics of metal-organic frameworks: A brief overview
- Anelasticity to plasticity transition in a model two-dimensional amorphous solid
- Ab initio nonadiabatic molecular dynamics study on spin–orbit coupling induced spin dynamics in ferromagnetic metals
- Ultrafast dynamics in photo-excited Mott insulator Sr3Ir2O7 at high pressure
- Universal basis underlying temperature,pressure and size induced dynamical evolution in metallic glass-forming liquids
- Valley filtering and valley-polarized collective modes in bulk graphene monolayers