
Defect Detection Model Using Time Series Data Augmentation and Transformation
2024-03-13 13:19GyuIlKimHyunYooHanJinChoandKyungyongChung
Computers Materials&Continua 2024年2期
Gyu-Il Kim ,Hyun Yoo ,Han-Jin Cho and Kyungyong Chung
1Department of Computer Science,Kyonggi University,Suwon-si,16227,Korea
2Contents Convergence Software Research Institue,Kyonggi University,Suwon-si,16227,Korea
3Department of Energy IT Engineering,Far East University,Eumsung-gun,27601,Korea
4Division of AI Computer Science and Engineering,Kyonggi University,Suwon-si,16227,Korea
ABSTRACT Time-series data provide important information in many fields,and their processing and analysis have been the focus of much research.However,detecting anomalies is very difficult due to data imbalance,temporal dependence,and noise.Therefore,methodologies for data augmentation and conversion of time series data into images for analysis have been studied.This paper proposes a fault detection model that uses time series data augmentation and transformation to address the problems of data imbalance,temporal dependence,and robustness to noise.The method of data augmentation is set as the addition of noise.It involves adding Gaussian noise,with the noise level set to 0.002,to maximize the generalization performance of the model.In addition,we use the Markov Transition Field(MTF)method to effectively visualize the dynamic transitions of the data while converting the time series data into images.It enables the identification of patterns in time series data and assists in capturing the sequential dependencies of the data.For anomaly detection,the PatchCore model is applied to show excellent performance,and the detected anomaly areas are represented as heat maps.It allows for the detection of anomalies,and by applying an anomaly map to the original image,it is possible to capture the areas where anomalies occur.The performance evaluation shows that both F1-score and Accuracy are high when time series data is converted to images.Additionally,when processed as images rather than as time series data,there was a significant reduction in both the size of the data and the training time.The proposed method can provide an important springboard for research in the field of anomaly detection using time series data.Besides,it helps solve problems such as analyzing complex patterns in data lightweight.
KEYWORDS Defect detection;time series;deep learning;data augmentation;data transformation
1 Introduction
Time series data is complex and volatile,making it challenging to identify anomalies.Recently,deep learning technology has been widely used for anomaly detection [1].Deep learning can automatically learn complex patterns from large datasets,enabling more accurate and efficient anomaly detection.However,time series data presents several challenges.Most time series data consists of normal data,with abnormal data being relatively rare,leading to data imbalance issues.This imbalance can hinder the training of models and make it difficult to detect anomalies.Additionally,the sequential nature of time series data means that failing to properly reflect the temporal dependencies between data points can lead to missing important features.Lastly,data collected in real environments often contains noise,further complicating the detection of anomalous patterns.To address these challenges,new approaches such as data augmentation for time series and the transformation of time series data into images for analysis are gaining attention.Data augmentation increases the diversity of training data by transforming the original data or adding noise,enhancing the model’s generalization capabilities.It can also alleviate data imbalance issues by increasing the amount of abnormal data[2].Additionally,other challenges in time series data include variability in time scales and periodicity,which play a crucial role in the anomaly detection process.By transforming these complex temporal characteristics into a twodimensional image format through image transformation methods,anomalies can be identified more clearly.Moreover,this approach not only maintains the temporal dependencies of the time series data but also leverages image processing techniques for more efficient anomaly detection.This represents a significant approach to resolving the complexities of time series data and enhancing the accuracy of anomaly detection.
Transforming time-series data into images has many advantages[3].First,by transforming timeseries data into images,its complex patterns and structures can be intuitively examined.Second,outliers can be detected using patterns in a 2D space through image transformation.Through this,lightweight effects can be achieved.Third,by transforming data into image form,diverse technologies and models related to image processing can be applied to time-series data.Lastly,such transformation can be performed while preserving the temporal dependency and key patterns of time-series data.Time-series data transformed into image form has 2D patterns,and an unsupervised learning model is particularly useful in analyzing such patterns [4].Since an unsupervised learning model does not require labeled data,the labeling cost and time can be greatly reduced.In particular,it is often difficult to accurately label outliers when performing tasks such as anomaly detection.An unsupervised learning model explores hidden patterns or structures within data and detects outliers based on the explored patterns or structures.In particular,of all unsupervised learning models,PatchCore and models similar are being usefully utilized in anomaly detection[5].PatchCore analyzes patterns based on a small patch within an image.This enables the detection of detailed abnormal patterns as well.In addition,it can be applied to not only time-series data transformed into images but also diverse image data.Lastly,PatchCore shows robust performance in detecting noise or small changes within data,it is capable of maintaining stable anomaly detection performance despite the existence of temporary noise or changes within time-series data transformed into images.Therefore,transforming time-series data into images enables a better examination of the complex patterns and structures of data.In addition,by applying an unsupervised learning model such as PatchCore to time-series data transformed into image data,the restrictions on labeling can be minimized and better performance in anomaly detection can be expected.Such an approach provides stable anomaly detection performance even in rapidly changing environments and applies to diverse time-series data.
Concrete structures are one of the main factors constituting the infrastructures of modern society.Such structures are exposed to diverse environmental factors and physical burdens,which may lead to reduced durability,performance degradation,and defect occurrence as time progresses.The consequent accidents lead to big accidents and result in extensive casualties,property damage,and social loss [6].To resolve these problems,Electrical Waveform Logging (EWL),a technology that monitors the status of concrete structures on a real-time basis through sensors fixed to rebar,was developed.By analyzing time-series data measured by sensors,it is possible to early detect defect occurrences and respond to them promptly.An image-based deep learning model is proficient in more accurately learning diverse patterns of time-series data.In this study,a combination of a PatchCorebased image deep learning model and data augmentation is utilized to effectively learn time-series data as well as to enhance anomaly detection accuracy.In particular,concrete structures’defect detection data is used from the EWL sensor’s time-series data with complex patterns [7].To do so,noise injection is applied as the data augmentation method.By adding random noise to the original data,the model develops robustness against noise and thereby enhances its generalization performance[8].The contributions of the method proposed in this paper are as follows:
? The complex patterns and structures of data are intuitively examined using an approach that transforms time-series data into images,and outliers are effectively detected using 2D patterns.Therefore,it becomes possible to apply diverse technologies and models related to image processing to time-series data.
? Since a PatchCore-based image deep learning model is used to analyze patterns in detail based on a small patch within an image,it is possible to effectively detect detailed abnormal patterns.In addition,since the model shows robust performance against noise or temporary data changes,it is possible to perform stable anomaly detection.
? Of all data augmentation methods,a data augmentation method using noise injection is applied to enhance the generalization ability of the model as well as to alleviate the data imbalance problem.By doing so,the model becomes less sensitive to noise,and its generalization performance is enhanced.
? By transforming time-series data into images,it becomes possible to maximize lightweight effects on anomaly detection.
This paper is constructed as follows.In Section 2,techniques for transforming time-series data into images,and a method for detecting defects in concrete structures using deep learning are described.In Section 3,the proposed defect detection model using time-series data augmentation and transformation is described.In Section 4,the results and performance evaluation are described,and,in Section 5,the conclusion is described.
2 Related Work
2.1 Techniques for Transforming Time Series Data into Images
Time-series data consists of a series of data points aligned in time order.Although there are many conventional methods used to explore and analyze the hidden patterns and structures of such data,recently,a method that analyzes time-series data by transforming it into images has been attracting attention[9].Transforming time-series data into images contributes to visually understanding the data,and particularly enables utilizing advanced image processing techniques such as deep learning.The methods used to transform time-series data into images include the following 6 methods:
? Gramian Angular Field–The Gramian angular field method transforms time-series data into polar coordinates and constructs a matrix using the cosine and sine values[10].Through this,the patterns of the time domain can be emphasized in image form.It is advantageous in that the patterns of the time domain and the patterns of the frequency domain can be emphasized at the same time,but it has limitations in that it requires data pre-processing and in that,the interpretation of the transformed images may not be intuitive.
? Recurrence Plot–The recurrence plot method visualizes the repeated patterns of time-series data into 2D images.It creates a 2D plot that visualizes when certain patterns within time-series data will re-appear,and transforms such patterns into images [11].It is advantageous in that it is capable of visualizing the complex dynamic patterns of non-linear time-series data,but it has limitations in that it may result in a substantial amount of computational cost and complex images when massive data is used.
? Continuous Wavelet Transform–This method provides information on the time-frequency domains of time-series data[12].It expresses information on the time and frequency domains at the same time and analyzes the complex patterns of time-series data.It is advantageous in that it provides information on the time-frequency domains at the same time and in that it detects abnormal or short signals,but it has limitations in that its interpretation is complicated and requires selecting an appropriate wavelet.It is valuably used to analyze time-series data associated with various natural phenomena.
? Markov Transition Field–The Markov transition field method performs image transformation based on the Markov transition probability of time-series data[13].It is advantageous in that it is capable of accurate pattern recognition based on Markov transition,but has limitations in that the image size may increase depending on the size of state space.There are cases where this method is used in complex dynamic pattern detection,particularly in the field of finance.
? Grey Scale Encoding–This method transforms time-series data into images in the most intuitive manner [14].It creates images by directly mapping each value of time-series data into the pixel values of gray-scale images.It is a simple and intuitive transformation method but has limitations in that the complex patterns or correlations of data can be neglected.It is particularly useful in pattern recognition and classification problems.
? Spectrogram–This method is mainly used in audio data analysis,and uses FFT(Fast Fourier Transform)to visualize the frequency components of time-series data per time period[15].It is advantageous in that it displays the frequency components such as audio signals that change as time progresses,but has limitations in that its computational cost increases to achieve high resolution and in that it requires a trade-off between time and frequency resolution.
Fig.1 shows the results of the 6 image transformation methods applied to time-series data.
Fig.1 illustrates the results of applying the image transformation technique using the data employed in this research.Through the figure,it can be observed that the Markov Transition Field method most effectively captures the characteristics.Each method shown in Fig.1 emphasizes particular aspects or characteristics of time-series data and is suitable for diverse application fields and problem settings.In particular,image transformation has enabled the utilization of the potential of advanced image processing techniques such as deep learning in analyzing time-series data.Which transformation technique to select may vary depending on the purpose of the study,the characteristics of data,and the expected results,and it is important to select an appropriate method.

Figure 1:Six ways to transform time series data into images
2.2 A Method for Detecting Defects in Concrete Structures Using Deep Learning
As far as pre-existing methods for detecting concrete structure defects are concerned,in general,the NDT(Non-Destructive Testing)method is used.This method includes diverse technologies such as ultrasonic tests,radiographic tests,magnetic-inductive inspection,acoustic-impact methods,and infrared thermographic tests [16].Such methods are advantageous in that they can detect internal defects in concrete structures without causing physical damage.However,such methods have many limitations.Most of these methods find it difficult to detect defects in the case where it is difficult to approach the inside of concrete structures.In addition,defect detection and size estimation require high-degree expertise and experience,and people’s subjective decisions get involved from time to time.Therefore,such methods may achieve low accuracy and consistency.To overcome the limitations of such methods,recently,deep learning-based concrete structure defect detection methods have been studied.In general,such deep learning-based defect detection methods use image data or sensor data.
Image-based defect detection mainly uses CNN(Convolutional Neural Network).It is a method that detects defects by entering surface photos or radar images of concrete structures on CNN.Since CNN well captures the regional patterns within images,it is suitable for defect detection.However,Gaur et al.[17] proposed a concrete defect distinction method using image processing and deep convolutional neural networks.The proposed method is capable of identifying and classifying the attributes of 6 types of concrete defects such as cracks by integrating the features of the inceptionV3,VGG16,and AlextNet structures through a convergence-based deep convolutional network.However,it is mainly only capable of detecting surface defects and has limitations associated with dataset and computational cost.In addition,Zhang et al.[18]proposed a simultaneous pixel-level concrete defect detection and grouping method using a fully convolutional model.The proposed method integrates an optimized mask subnet with a box-level detection network.The mask subnet outputs a location detection rating map set for pixel-level defect detection,and the box-level detection network groups the detected pixels by predicting the bounding box for each defect.Therefore,this process enables enhancing the prediction speed and accuracy.However,since a high dependency on the bounding box has an influence on fragmentation accuracy,it is difficult to use ill-defined features to find the accurate location of a defect.
Sensor data-based defect detection monitors the status of structures and detects anomalies through the use of data collected from diverse sensors such as vibration,temperature,and humidity sensors[19].To process such time-series data,deep learning models such as RNN(Recurrent Neural Networks) and LSTM are used [20].Since such models learn time-series patterns and consider the previous status and the current data at the same time,they are advantageous in detecting detailed abnormal patterns from complex time-series data.Sensor data-based methods used for concrete defect detection are greatly advantageous in detecting internal defects[21].
3 Defect Detection Model Using Time Series Data Augmentation and Transformation
Since concrete structures are exposed to diverse environments,problems associated with durability,defects,etc.,occur as time progresses,and such problems lead to not only casualties but also losses such as property damage.Therefore,it is necessary to come up with a method that predicts defects through monitoring the internal and external statuses of concrete.Time-series data used for concrete defect detection is capable of early detecting internal defect occurrences that are difficult to directly confirm.However,since there is not enough defect data to sufficiently train a deep learning model,a data augmentation method is required.Fig.2 shows a PatchCore-based anomaly detection process performed through data augmentation and image transformation.
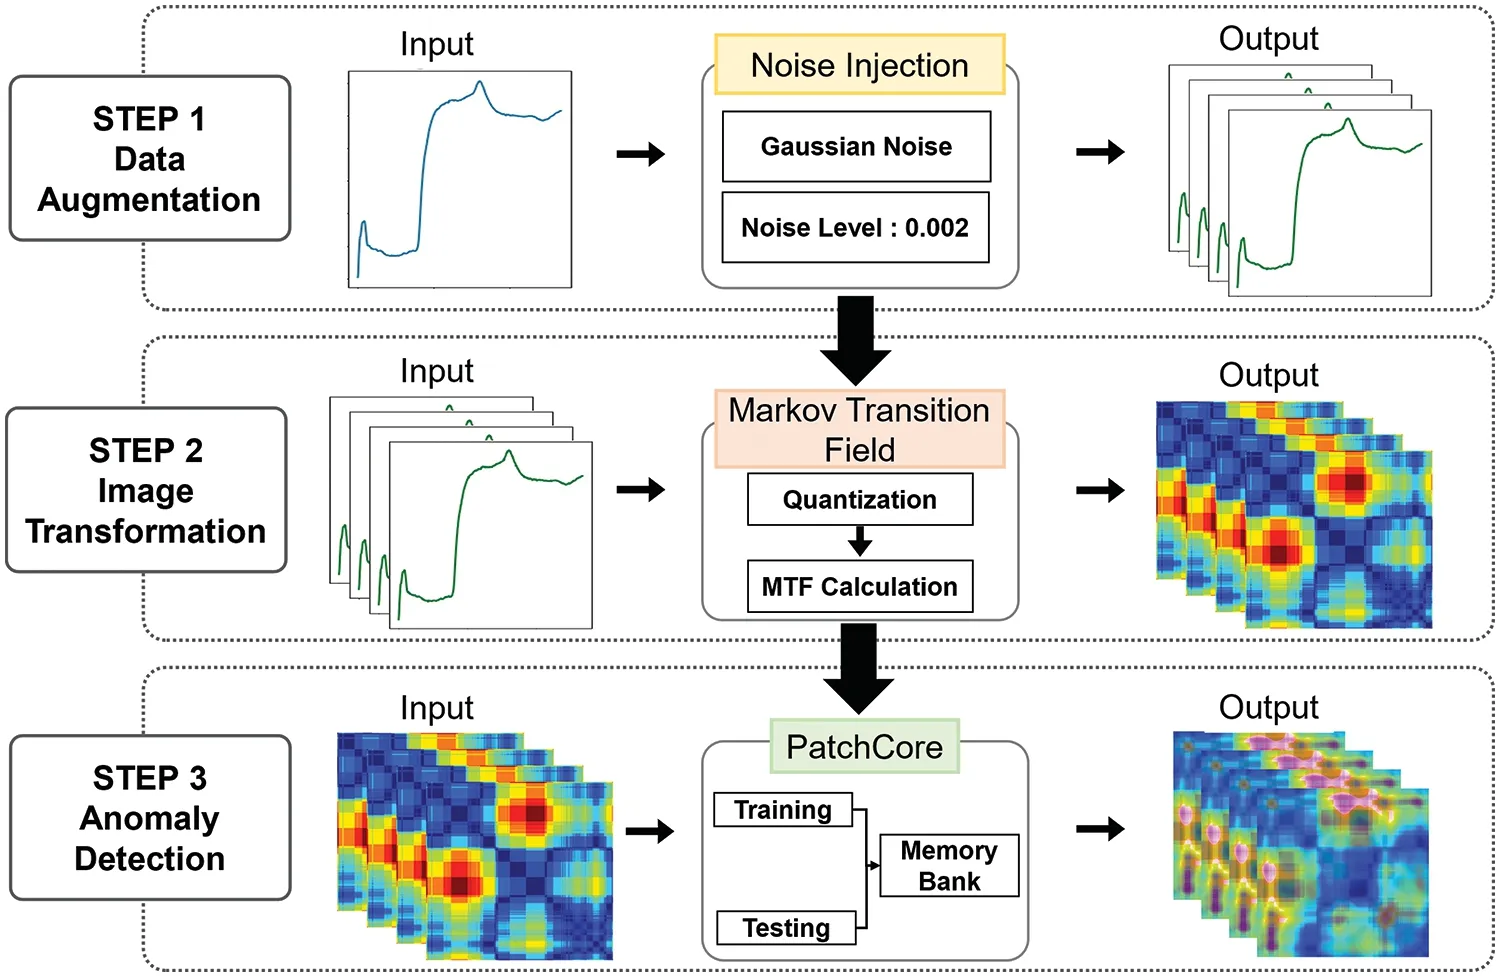
Figure 2:Process of defect detection model using time series data augmentation and transformation
In Fig.2,the model consists of three steps:time series data augmentation,time series data image conversion,and PatchCore-based anomaly detection.In the first step,the time series data is augmented using the noise injection method to solve the data sparsity problem.The Gaussian noise level is set to 0.002.In the second step,the augmented time series data is converted into images using the MTF method to lighten the model.The MTF method converts the time series data into images through Quantization and MTF Calculation.In the third step,anomaly detection is performed based on the PatchCore model using the image generated in the second step.
3.1 Data Collection and Data Preprocessing
The data used in this study is data obtained by simulating the external defects of model piles included in concrete,analyzing the propagation characteristics of the reflected electromagnetic pulses,and using the non-destructive method on the piles[22].In the involved test,a formwork with a length of 3 m and a fragment size of 0.2 ?0.2 m is manufactured,rebar and transmission lines are installed in the center of the formwork and are divided into 3 sections,concrete is placed on both ends,various media capable of calculating defects are inserted into the center section,and the reflection shapes of electromagnetic pulses are compared.The electromagnetic pulses start from the sensor,move through the signal path through which the released electromagnetic pulses pass,and return to the sensor through the return path that reflects and sends the electromagnetic pulses back to the sensor.The signal reflected at this point is indicated as the reflection coefficient.As far as the various media are concerned,media suitable for a total of 7 situations are used.This includes 1 normal situation and 6 abnormal situations.The 6 abnormal situations are as follows:air,dry soil,soil consisting of 10% water,soil consisting of 20% water,soil consisting of 30% water,and clay.The test data is created by confirming the reflection shapes of electromagnetic pulses per time domain through the use of wires.Therefore,the data used in this study is data measured using TDR (Time Domain Reflectometry).This includes the reflection coefficient measured at approximate intervals of 0.01–0.02 s as well as the round trip.The round trip represents the time point the reflection coefficient is measured.In addition,the reflection coefficient can be indicated by dividing the reflected voltage by the incident voltage.In addition,it can be indicated by the difference in impedance between the two media.Eq.(1)shows the reflection coefficient.
In Eq.(1),Vr,andVirepresent the reflected voltage and incident voltage,respectively,andZrepresents the impedance of medium 0 and the impedance of medium 1.
Table 1 shows the test data collected through TDR(Time Domain Reflectometry).ROUNDTRIP is a unit indicating time and its unit is seconds.It indicates the round trip starting from 0 s to approximately 81 s.Normal represents a normal situation,Air represents air,Dsoil represents dry soil,Wsoil10 represents soil consisting of 10% water,Wsoil20 represents soil consisting of 20% water,Wsoil30 represents soil consisting of 30% water,and Clay represents clay.

Table 1:Experimental data collected through time domain reflectometry(TDR)
In Table 1,when the time is 0 s,Normal’s reflection coefficient is,Air is 0.00328,Dsoil is 0.00397,Wsoil10 is 0.03703,Wsoil20 is 0.00111,Wsoil30 is 0.02824,and Clay is 0.01774.Fig.3 shows the visualized results of the reflection coefficient over time of each data.

Figure 3:Reflection coefficient graph according to the experimental situation
Since there are 1 normal situation and 6 abnormal situations,data imbalance exists.In addition,an absolute insufficiency in the number of data exists.Therefore,data augmentation is necessary.In addition,a difference in measured time exists between individual tests.Therefore,each time-series data has a different time.To perform proper learning,it is necessary to standardize the time difference.To standardize each data’s time difference,the file with the lowest number of lines is set as the standard,and the other data are adjusted to use the same number of lines as that of the standard file.The last part of the measured value is unnecessary since it is a value measured past the piles.Therefore,the shortest line is set as the standard,and the last part of the other lines is deleted to have the same length as that of the standard line.
3.2 Data Augmentation
Data augmentation is a method that increases the diversity of training data by applying diverse transformations or adding noise to the given original data to enhance the generalization performance of a model.In addition,in the field of anomaly detection,since the amount of abnormal data is significantly less than that of normal data,the data imbalance problem occurs.Therefore,generalization performance and accuracy can be enhanced through data augmentation.In this study,taking into consideration the attributes of time-series data,the following 6 augmentation methods are applied:time slicing,window slicing,noise injection,time warping,smoothing,and trend/cycle shifting.Fig.4 shows a reflection coefficient time graph obtained through these 6 augmentation methods.

Figure 4:Six ways to augment normal data
In Fig.4,time slicing is a method that extracts the middle part of the original time-series data.It is a method that selects a part of time-series data according to the start-to-end ratio.It can be confirmed that the start and end points partially disappeared in comparison to those of the original data.Window slicing is a method that extracts a part with a certain size from the end of time-series data.A collapsed augmented appearance of the patterns of the original data can be confirmed.Time warping is a method that distorts and slows down the time of time-series data.Smoothing is a method that smoothens time-series data through the use of moving averages.Trend/Cycle shifting is a method that moves up the overall time-series data.It can be confirmed that the results obtained through the application of all 3 methods have a similar appearance to that of the original data.Although the timeslicing and window-slicing methods can be used to capture diverse parts of data,they may be limited in preventing overfitting or enhancing the generalization ability of a model.The time-warping and shifting methods have limitations in imitating the noise of actual data.The smoothing method might not help enhance the robustness of a model against noise or volatility in an actual environment.Noise injection is a method that adds Gaussian noise to the original time-series data.As a result of applying the noise injection method,it can be confirmed that sways are caused by the added noise.Therefore,noise injection is capable of enhancing the generalization ability of a model without requiring the model to excessively depend on the subtle attributes of data.This especially contributes to preventing overfitting.In addition,in actual time-series data,volatility caused by noise or other external factors always exists.By adding noise,a model can be trained on diverse data situations and its performance under complex conditions of the real world can be enhanced.The visualization of the experimental results shows that the noise injection method is robust to the model and provides good augmentation.Therefore,in this study,the noise injection method is selected and applied.By adding random noise to the original data,the model develops robustness against noise and is enabled to reflect uncertainties that may occur in an actual environment.
For noise injection,it is necessary to set the level of Gaussian noise.Taking into consideration the size of the actual data,a level of noise of 0.002 is appropriate for adding sufficient volatility to the data without distorting the original attributes.In addition,an excessive level of noise may distort the original attributes of data.Therefore,through a low level of noise,diversity in the learning process is guaranteed without excessively responding to the minute volatility of data.Lastly,data measurement in an actual environment includes small noise.Therefore,a low level of noise is suitable for imitating minute volatility in such an actual environment.Therefore,in this study,the level of Gaussian noise is set as 0.002,and this contributes to enhancing the generalization ability of a model by adding sufficient volatility while preserving the original attributes of data.Fig.5a shows the original data,and Fig.5b shows the augmented data.These are the results obtained by setting the level of noise as 0.002 and making a comparison between the original data and the augmented data.

Figure 5:Results of augmenting normal data to 0.002 noise level
The result in Fig.5 shows that the original data and the augmented data are similar in shape,so it is difficult to accurately judge the difference.However,if you look at(b)Augmented Data,you can see that the noise has been added normally and well,so you can see that the augmentation is done correctly.Since it is difficult to analyze patterns and features based on visualizations alone,we need a method to extract patterns and features by converting time series data into images.
3.3 Defect Detection Model Using Time Series Data Augmentation and Transformation
Transforming time-series data into images intuitively visualizes the complex patterns and structures of data,and such a process enables utilizing the advantages of advanced image processing techniques such as CNN.In addition,since the dimensions and shapes of data are diversified through transformation,enhancement and lightweight effects on the learning performance of a model can be expected.Due to such reasons,time-series data is transformed into images.To transform timeseries data into images,the following methods can be taken into consideration:Gramian angular field,recurrence plot,continuous wavelet transform,MTF(Markov Transition Field),grey-scale encoding,and spectrogram[3].In this paper,time-series data is transformed into images using the MTF method[19].The reasons for selecting the MTF method are as follows.First,the MTF method is capable of intuitively visualizing the dynamic transition of time-series data.Therefore,it is robust in detecting patterns or anomalies of time-series data.In addition,the Markov transition is useful in capturing the sequential dependencies of data.Lastly,the MTF method is relatively robust against the temporary noise of time-series data.Fig.6 shows images of time-series data per test situation after the application of MTF.Normally represents a normal test situation,and Air,Dsoil,Clay,Wsoil10,Wsoil20,and Wsoil30 represent 6 abnormal test situations.

Figure 6:Applying MTF to normal time series data
Transforming time-series data into images enables anomaly detection through the transformed images.In this paper,anomaly detection is performed using a PatchCore model [6].Fig.7 shows the PatchCore model used as the defect detection model using time series data augmentation and transformation for PatchCore.As shown in Fig.7,in the learning process,features are extracted using a pre-trained network based on normal images only.The extracted features are made into locally aware patch features.Then,the patch features to be loaded on the memory are selected through coreset sampling.In the test process,normal and abnormal images are used.Like the learning process,the extracted features are made into locally aware patch features through a pre-trained network.Then,the anomaly score is measured by comparing the distance between the patch features made and the patch features loaded on the memory.A PatchCore model is a model that uses a pre-trained model to detect abnormal images by extracting the features of normal data without requiring the training process.In addition,its structure enables effectively saving the features of normal data,demonstrating high performance even with only a small number of normal images,and applying images with a solution different from that of normal data.In this paper,a pre-trained Wide ResNet-50-2 network is used.The final anomaly detection results are obtained through the learning and testing process.

Figure 7:Defect detection model using time series data augmentation and transformation for patchCore
Fig.8a shows normal images,Fig.8b shows abnormal images,and Fig.8c shows an anomaly map of abnormal images detected by the PatchCore model.In the anomaly map,the darker the color,the higher the anomaly score,and,the lighter the color,the lower the anomaly score.

Figure 8:Abnormal image anomaly map
Fig.9 shows the final results of the PatchCore model used in this study.It shows how the anomaly map is applied to the original photo of the images determined to be abnormal by the model.These are 4 randomly selected abnormal images,and the parts determined to be abnormal can be captured through the anomaly map.

Figure 9:Apply anomaly map to source abnormal image
When measuring the anomaly score based on the distance between patches,the pivot point is based on the closest distance to the learned patch.In particular,the measurement is performed using the distance to the first neighbor.Through this,the anomaly score and anomaly map for each image are obtained.The anomaly score indicates the intensity of abnormal patterns within the image.The higher the score,the higher the number of abnormal patterns within the image.On the other hand,since an anomaly map visually expresses anomalies at specific locations within an image,users can easily confirm the specific domains where abnormal patterns occur within that image.
4 Result and Performance Evaluation
An accuracy evaluation is performed to evaluate the model.For a relative evaluation,a comparison of performance between noise levels,a comparison of performance before and after the transformation of time-series data into images,and a comparison of performance before and after data augmentation are performed.As aforementioned,data collected in Section 3.1 is used as the evaluation data.Intel?Xeon Silver,128 GB Memory,and NVIDIA GeForce RTX 3090 are used as the hardware for model evaluation.
The performance evaluation is performed through measuring accuracy and F1-score.Accuracy and F1-score are measured based on the confusion matrix.Eqs.(2) and (3) are the formulas for calculating accuracy and F1-score,respectively[23].
TP stands for True Positive,which is the case where observation is predicted positively and is positive.FP stands for False Positive,which is the case where observation is predicted positively and is negative.FN stands for False Negative which is the case where observation is predicted negative and is positive.TN stands for True Negative,which is the case where observation is predicted negatively and is negative.F1-score’s precision is the percentage of actually true images out of the images predicted true by the model.Recall is the percentage of images predicted true by the model out of the true images.F1-score is the harmonic mean between precision and recall and is advantageous in that it is capable of accurately evaluating the performance of a model when the data label is imbalanced,and in that it is capable of expressing the performance as one number.
4.1 Performance Comparison Based on Noise Level
To examine the effects of time-series data anomaly detection depending on diverse levels of Gaussian noise,levels of Gaussian noise of 0.001,0.002,0.003,0.004,0.005,and 0.01 are used to perform the test.Since combining the advantages of LSTM with the re-construction ability of AE is known to demonstrate high efficiency and performance in learning the continuity and patterns of time-series data,the test is performed using an LSTM-AE(Long Short-Term Memory AutoEncoder)model.Table 2 shows a comparison of the performance of LSTM-AE among levels of noise.

Table 2:Performance comparison based on noise level
Through the test,it is confirmed that the highest performance is shown when the level of Gaussian noise is set as 0.002.Through this,to which extent a level of noise enables the model to effectively perform anomaly detection can be confirmed,and how the changes in noise conditions have an effect on stability can be confirmed.
4.2 Performance Comparison of Data Augmentation
To evaluate the effects of data augmentation,a comparison of performance before and after data augmentation is performed.Data augmentation increases the diversity of a training dataset and is a methodology that plays an important role in enhancing the generalization performance of a model.The test was performed using the two models of LSTM-AE and PatchCore.Table 3 shows a comparison of the F1-score of the two models before and after data augmentation.

Table 3:Performance comparison before and after data augmentation
Based on the performance evaluation results before data augmentation shown in Table 3,the LSTM-AE and PatchCore models show performances of 0.7793 and 0.8757,respectively.On the other hand,after data augmentation,the two models show performances of 0.88 and 0.9898,respectively.Based on a comparison of performance before and after augmentation,it can be confirmed that data augmentation had a positive influence on the performance of the models.It is interpreted that such performance enhancement resulting from data augmentation is mainly due to the increased diversity of the training dataset.Training a model with data containing diverse modified patterns that are artificially created through data augmentation enables that model to develop its ability to respond to diverse situations and patterns in the actual test data.In particular,such diversity of data plays an important role in enabling a model to enhance its generalization ability while reducing the risk of overfitting.As a result,data augmentation overcomes the limitations of limited training data,helps a model effectively learn a wider range of data distribution,and eventually leads to that model’s performance enhancement.
4.3 Comparison of LSTM-AE and PatchCore Lightweight Effects
The difference in performance between the two different models of LSTM-AE and PatchCore is compared,and the lightweight effects are evaluated as well.In particular,such comparison is focused on the changes in the training time and amount of data of the models.Table 4 shows the comparison results of the two models’lightweight effects.
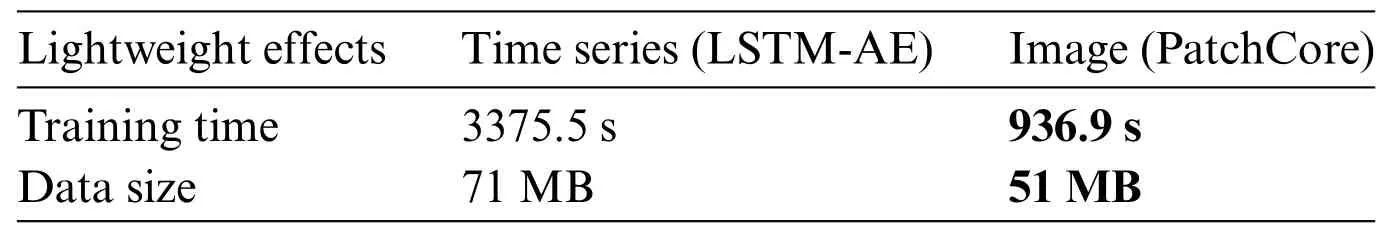
Table 4:Comparison of LSTM-AE and PatchCore lightweight effects
Based on the test results shown in Table 4,the measured training time of LSTM-AE is 3375.5 s,but the measured training time of PatchCore is 936.9 s faster than that of LSTM-AE.In addition,it can be confirmed that the amount of data used for training is substantially reduced for PatchCore.An amount of data of 71 MB is measured when LSTM-AE is used,but an amount of data of 51 MB is measured when PatchCore is used.Since time-series data consists of a sequence of consecutive values,it is mostly associated with huge computation and memory consumption.On the other hand,transforming it into images enables the expression of such sequence information as patterns in a spatial dimension,resulting in simplified structures.It is interpreted that this reduced the computational burdens of the learning algorithms.Since time-series data must process consecutive sequences,its memory usage may be high.The amount of data can be reduced through image transformation,and it becomes possible to apply techniques that optimize the memory usage of algorithms specialized in image processing.Based on such results,it is confirmed that transforming time-series data into images brought lightweight effects that shortened the training time and reduced the volume of data,and this signifies that the models can operate more effectively in resource-limited environments.
4.4 LSTM-AE vs.PatchCore Performance Indicators
To make a quantitative comparison of performance between LSTM-AE and PatchCore,two main indicators are used.Fig.10 shows a comparison of performance between LSTM-AE and PatchCore.
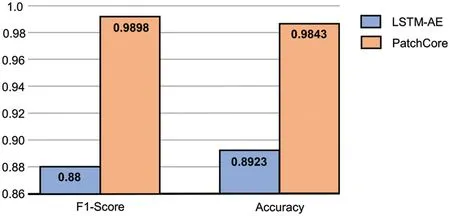
Figure 10:LSTM-AE vs.patchcore performance indicators
Based on the test results,LSTM-AE showed an accuracy of 0.8923 and an F1-score of 0.88.On the other hand,PatchCore showed an accuracy of 0.9843 and an F1-score of 0.9898.We can see that both F1-score and Accuracy are higher for the PatchCore model than the LSTM-AE model.Based on such results,it can be confirmed that PatchCore showed relatively higher performance indicators than those of LSTM-AE.As one of the causes of such performance enhancement,the information compression and pattern recognition ability in the process of transforming time-series data into images can be mentioned.Transforming time-series data into images enables PatchCore to capture the unique patterns and features of data more,and this leads to the model’s performance enhancement.In particular,transforming time-series data into images enables taking into consideration diverse dimensions and patterns of data at the same time,and this results in an increase in performance indicators such as F1-score.As a result,PatchCore uses a special approach that transforms timeseries data into images and shows higher performance than that of LSTM-AE.The research results demonstrate the efficiency of anomaly detection by converting time series data into images.However,the model’s performance heavily depends on the characteristics and noise level of the data used.For instance,further research is necessary regarding the model’s applicability in real-world settings with various types of noise.The approach of this study can be applied in numerous fields,such as industrial process monitoring,defect detection in architectural structures,and medical data analysis.It can play a crucial role in effectively analyzing complex patterns and structures in time series data and detecting anomalies in these areas.Nonetheless,it is important to acknowledge that the model’s performance may vary depending on the characteristics and environment of the data in these application domains.
5 Conclusion
To effectively detect defects within concrete,in this study,a defect detection model using timeseries data augmentation and transformation is proposed.The proposed method used time-series data measured using TDR(Time Domain Reflectometry).Since such data had a class imbalance between its normal data and abnormal data,it was augmented using the noise injection method.Therefore,by applying diverse levels of Gaussian noise to the time-series data,to which extent a level of noise enables the model to effectively perform anomaly detection was confirmed.Through experimentation,this paper found that a Gaussian noise level of 0.002 performed best,so this paper applied it.By doing so,it was confirmed that the model shows high robustness against uncertainties or potential external noise in an actual environment and is capable of maintaining stable performance.However,since the shape of the augmented data was similar to that of the original data,methods to effectively detect and visualize abnormal patterns were proposed through the transformation of time-series data into images using MTF(Markov Transition Field)and through the application of the anomaly detection model PatchCore.In addition,through a study on heat map techniques for visual expression of abnormal domains,the users’understanding was enhanced while improving the actual availability at the same time.This paper has presented a new methodology for analyzing complex patterns and features in time series data.Through a performance evaluation,the effects of image transformation on timeseries data were confirmed.Compared to the test results obtained using the LSTM-AE model,the test results obtained using the PatchCore model through image data showed higher performance both in F1-score and accuracy.This paper also experimented with converting time series data to images to see how lightweight it can be.Therefore,it is possible to detect anomalies such as defects within concrete through the proposed method.However,this method has limitations in that it is limited to concrete data and is difficult to generalize.
In future work,the proposed methods will be applied to various environments and datasets to enhance generalization performance.The PatchCore model exhibits strengths in transforming the unique patterns and characteristics of time series data into images,but it may not be equally effective for all types of time series data.Therefore,it is necessary to further explore the applicability and limitations of the model across various datasets.In particular,future research will focus on the model’s performance with datasets that have high variability or rapidly changing data,as well as any potential performance degradation when using long-term data.Finally,the study will explore methods to analyze the transformed images and apply them to various deep learning models.
Acknowledgement:Not applicable.
Funding Statement:This research was financially supported by the Ministry of Trade,Industry,and Energy (MOTIE),Korea,under the“Project for Research and Development with Middle Markets Enterprises and DNA(Data,Network,AI)Universities”(AI-based Safety Assessment and Management System for Concrete Structures)(Reference Number P0024559)supervised by the Korea Institute for Advancement of Technology(KIAT).
Author Contributions:The authors confirm contribution to the paper as follows:study conception and design:G.I.Kim,K.Chung;data collection:G.I.Kim;analysis and interpretation of results:G.I.Kim,H.Yoo;draft manuscript preparation:G.I.Kim,H.J.Cho.All authors reviewed the results and approved the final version of the manuscript.
Availability of Data and Materials:Data available on request from the authors.The data that support the findings of this study are available from the corresponding author,G.I.Kim,upon reasonable request.
Conflicts of Interest:The authors declare that they have no conflicts of interest to report regarding the present study.
 Computers Materials&Continua2024年2期
- Computers Materials&Continua的其它文章
- ASLP-DL—A Novel Approach Employing Lightweight Deep Learning Framework for Optimizing Accident Severity Level Prediction
- A Normalizing Flow-Based Bidirectional Mapping Residual Network for Unsupervised Defect Detection
- Improved Data Stream Clustering Method:Incorporating KD-Tree for Typicality and Eccentricity-Based Approach
- MCWOA Scheduler:Modified Chimp-Whale Optimization Algorithm for Task Scheduling in Cloud Computing
- A Review of the Application of Artificial Intelligence in Orthopedic Diseases
- IR-YOLO:Real-Time Infrared Vehicle and Pedestrian Detection