
The ALMA-QUARKS Survey.I.Survey Description and Data Reduction
2024-03-22 04:11XunchuanLiu劉訓川TieLiuLeiZhuGuidoGarayHongLiLiuPaulGoldsmithNealEvansKeeTaeKim7ShengYuanLiuFengweiXuXingLuAnandmayeeTejXiaofengMaiLeonardoBronfmanShanghuoLiDiegoMardonesAmeliaStutzKenichiTatematsuKeWangQizhouZhang
Xunchuan Liu (劉訓川) , Tie Liu, Lei Zhu, Guido Garay, Hong-Li Liu, Paul Goldsmith, Neal Evans, Kee-Tae Kim7,,Sheng-Yuan Liu, Fengwei Xu,0, Xing Lu , Anandmayee Tej , Xiaofeng Mai, Leonardo Bronfman, Shanghuo Li,Diego Mardones, Amelia Stutz, Ken’ichi Tatematsu , Ke Wang, Qizhou Zhang , Sheng-Li Qin, Jianwen Zhou,Qiuyi Luo,7, Siju Zhang, Yu Cheng, Jinhua He,,, Qilao Gu , Ziyang Li,, Zhenying Zhang,, Suinan Zhang,Anindya Saha , Lokesh Dewangan0, Patricio Sanhueza,, and Zhiqiang Shen
1 Shanghai Astronomical Observatory, Chinese Academy of Sciences, Shanghai 200030, China; liuxunchuan@shao.ac.cn, liutie@shao.ac.cn
2 Chinese Academy of Sciences South America Center for Astronomy,National Astronomical Observatories,Chinese Academy of Sciences,Beijing 100101,China lzhupku@gmail.com
3 Departamento de Astronomía, Universidad de Chile, Las Condes, 7591245 Santiago, Chile; guido@das.uchile.cl
4 School of Physics and Astronomy, Yunnan University, Kunming 650091, China; hongliliu2012@gmail.com
5 Jet Propulsion Laboratory, California Institute of Technology, 4800 Oak Grove Drive, Pasadena CA 91109, USA 6 Department of Astronomy, The University of Texas at Austin, TX 78712-1205, USA
7 Korea Astronomy and Space Science Institute, 776 Daedeokdae-ro, Yuseong-gu, Daejeon 34055, Republic of Korea
8 Institute of Astronomy and Astrophysics, Academia Sinica, Roosevelt Road, Taipei 10617, China
9 Kavli Institute for Astronomy and Astrophysics, Peking University, Beijing 100871, China
10 Department of Astronomy, School of Physics, Peking University, Beijing 100871, China
11 Indian Institute of Space Science and Technology, Thiruvananthapuram 695 547, Kerala, India
12 Max Planck Institute for Astronomy, K?nigstuhl 17, D-69117 Heidelberg, Germany
13 Departamento de Astronomía, Universidad de Concepción, Casilla 160-C, Concepción, Chile
14 Nobeyama Radio Observatory,National Astronomical Observatory of Japan,National Institutes of Natural Sciences,462-2 Nobeyama,Minamimaki,Minamisaku,Nagano 384-1305, Japan
15 Center for Astrophysics | Harvard & Smithsonian, 60 Garden Street, Cambridge, MA 02138, USA
16 Max-Planck-Institut für Radioastronomie, Auf dem Hügel 69, D-53125 Bonn, Germany
17 School of Astronomy and Space Sciences, University of Chinese Academy of Sciences, Beijing 100049, China
18 National Astronomical Observatory of Japan, 2-21-1 Osawa, Mitaka, Tokyo, 181-8588, Japan
19 Yunnan Observatories, Chinese Academy of Sciences, Kunming 650216, China
20 Physical Research Laboratory, Navrangpura, Ahmedabad-380 009, India
21 Astronomical Science Program, The Graduate University for Advanced Studies, SOKENDAI, 2-21-1 Osawa, Mitaka, Tokyo 181-8588, Japan
22 University of Science and Technology, Korea (UST), 217 Gajeong-ro, Yuseong-gu, Daejeon 34113, Republic of Korea
Abstract This paper presents an overview of the QUARKS survey,which stands for“Querying Underlying mechanisms of massive star formation with ALMA-Resolved gas Kinematics and Structures.”The QUARKS survey is observing 139 massive clumps covered by 156 pointings at Atacama Large Millimeter/submillimeter Array(ALMA)Band 6(λ ~1.3 mm).In conjunction with data obtained from the ALMA-ATOMS survey at Band 3 (λ ~3 mm),QUARKS aims to carry out an unbiased statistical investigation of massive star formation process within protoclusters down to a scale of 1000 au.This overview paper describes the observations and data reduction of the QUARKS survey,and gives a first look at an exemplar source,the mini-starburst Sgr B2(M).The wide-bandwidth(7.5 GHz) and high-angular-resolution (~0 3) observations of the QUARKS survey allow for the resolution of much more compact cores than those could be done by the ATOMS survey, and to detect previously unrevealed fainter filamentary structures.The spectral windows cover transitions of species including CO, SO, N2D+, SiO,H30α, H2CO, CH3CN, and many other complex organic molecules, tracing gas components with different temperatures and spatial extents.QUARKS aims to deepen our understanding of several scientific topics of massive star formation, such as the mass transport within protoclusters by (hub-)filamentary structures, the existence of massive starless cores, the physical and chemical properties of dense cores within protoclusters, and the feedback from already formed high-mass young protostars.
Key words: stars: formation – stars: kinematics and dynamics – ISM: clouds – ISM: molecules
1.Introduction
As the principal sources of heavy elements and UV radiation, high-mass stars (M>8 M☉) play a major role in the evolution of galaxies.However, the formation mechanism of high-mass stars is still under intense debate (e.g.,Zinnecker& Yorke 2007; Pineda et al.2023).A variety of models have been proposed, contending with each other or focusing on different aspects of high-mass star formation.Early models disagreed about how a massive protostar obtains its initial mass and subsequently accretes additional mass.The competitive accretion scenario (e.g., Bonnell et al.2004; Bonnell &Bate 2006)assumed initial fragmentation of a molecular cloud into low-mass cores each with mass approximately equal to the thermal Jeans mass.In contrast, the “turbulent core accretion model” (e.g., McKee & Tan 2003) suggested that high-mass stars form directly from turbulent massive gas cores.These idealized models depict protostars forming and accreting from their natal gas reservoirs which are treated as unstructured and obeying isotropic dynamics.Therefore, models that explained the presence of star-forming regions in/on hierarchical structures, or more specifically filamentary structures, were put forward (e.g., the global hierarchical collapse model, the inertial-inflow model; Heitsch et al.2008; Vázquez-Semadeni et al.2009; Padoan et al.2020).These models were partly supported by the observations of far-infrared dust continuum by the Herschel space observatory and other ground-based single-dishes,which demonstrated that filaments are ubiquitous and closely correlated with star formation in nearby molecular clouds as well as massive clumps in the Galactic Plane (e.g.,André et al.2010;K?nyves et al.2015;Li et al.2016;Liu et al.2018,2021b;Kumar et al.2020;Schisano et al.2020;Ge et al.2023; Hacar et al.2023).
Observations show that high-mass stars are rare, and mostly born in massive clumps within the Galactic plane that are much denser than low-mass star-forming clouds (e.g., Schuller et al.2009).Considering their large distances (~kpc) and high dust extinction, studies of those massive clumps need high resolution interferometric observations that can resolve their internal gas structures and kinematics.The Atacama Large Millimeter/submillimeter Array (ALMA) provides an opportunity to investigate the inner hierarchical structures of highmass star-forming regions in great detail.There is growing evidence of the existence of filaments within massive clumps giving rise to hub-filamentary structures (HFSs; e.g., Peretto et al.2013; Yuan et al.2018; Kumar et al.2022; Liu et al.2023a;Morii et al.2023;Yang et al.2023).However, most of these have been the results of case studies.The“ALMA Threemillimeter Observations of Massive Star-forming regions”(ATOMS) survey (Liu et al.2020a) observed 146 active starforming regions with ALMA at Band 3(λ ~3 mm),aiming to systematically investigate the gas distribution,stellar feedback,and filaments inside massive clumps.The ATOMS survey revealed, in a statistical way, that HFSs are common within massive clumps(Zhou et al.2022).Case studies of HFSs based on the ATOMS survey (Liu et al.2022a, 2022b; Xu et al.2023b)confirmed that HFSs at scales from 0.1 pc to several pc play a key role in high-mass star formation, and the stellar feedback would in turn regulate the shapes and evolution of HFSs (e.g., Peretto et al.2013; Kumar et al.2022; Liu et al.2023a).A higher-resolution (~1000 au) survey would enable to systematically establish whether the hierarchical structures remain common down to a protocluster scale, and to provide for theoretical studies the observational constraints onto the detailed process of gas mass transport down to the protocluster scale.
Inspired by the ATOMS survey, we initiated the “Querying Underlying mechanisms of massive star formation with ALMA-Resolved gas Kinematics and Structures (QUARKS)”survey program at ALMA(PIs:Lei Zhu,Guido Garay,and Tie Liu).The QUARKS survey selected the densest kernels of the massive clumps in the ATOMS survey, forming an unbiased sample (139) of protoclusters, and observed them at Band 6(λ ~1.3 mm) of ALMA with much improved angular resolution than the ATOMS survey.The QUARKS survey aims (1) to statistically investigate the star formation process(e.g., fragmentation, outflows, disks) within an unbiased sample of protoclusters, (2) more specifically, to explore how(hub-)filamentary structures feed individual protostars within protoclusters, (3) to investigate the physical and chemical evolution of dense cores, and (4) to study various feedback mechanisms within protoclusters.
In this paper, we present an overall description of the QUARKS survey.The paper is structured as follows: In Section 2, we introduce the source sample and ALMA observations of the QUARKS survey.In Section 3, we describe the data reduction processes of both the continuum maps and spectral cubes.In Section 4, a first look at Sgr B2(M), a source within the sample of this survey, is presented to check the data quality and to explore in a preliminary fashion how the data can be linked to some of the science objectives of the QUARKS survey.In Sections 5 and 6, we present more science topics that can be addressed by the QUARKS survey and compare the QUARKS surveys with other ALMA programs.A summary is provided in Section 7.
2.Sample and Observations
2.1.Sample
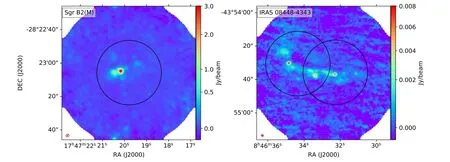
Figure 1.Example of the targets of the QUARKS survey.In each panel, the background is the Band 3 continuum of the ATOMS survey.The black circle is the primary beam of the ALMA 12 m array in Band 6.The red ellipse and the black dot in the lower-left corner show the angular resolutions of the ATOMS and QUARKS surveys, respectively.
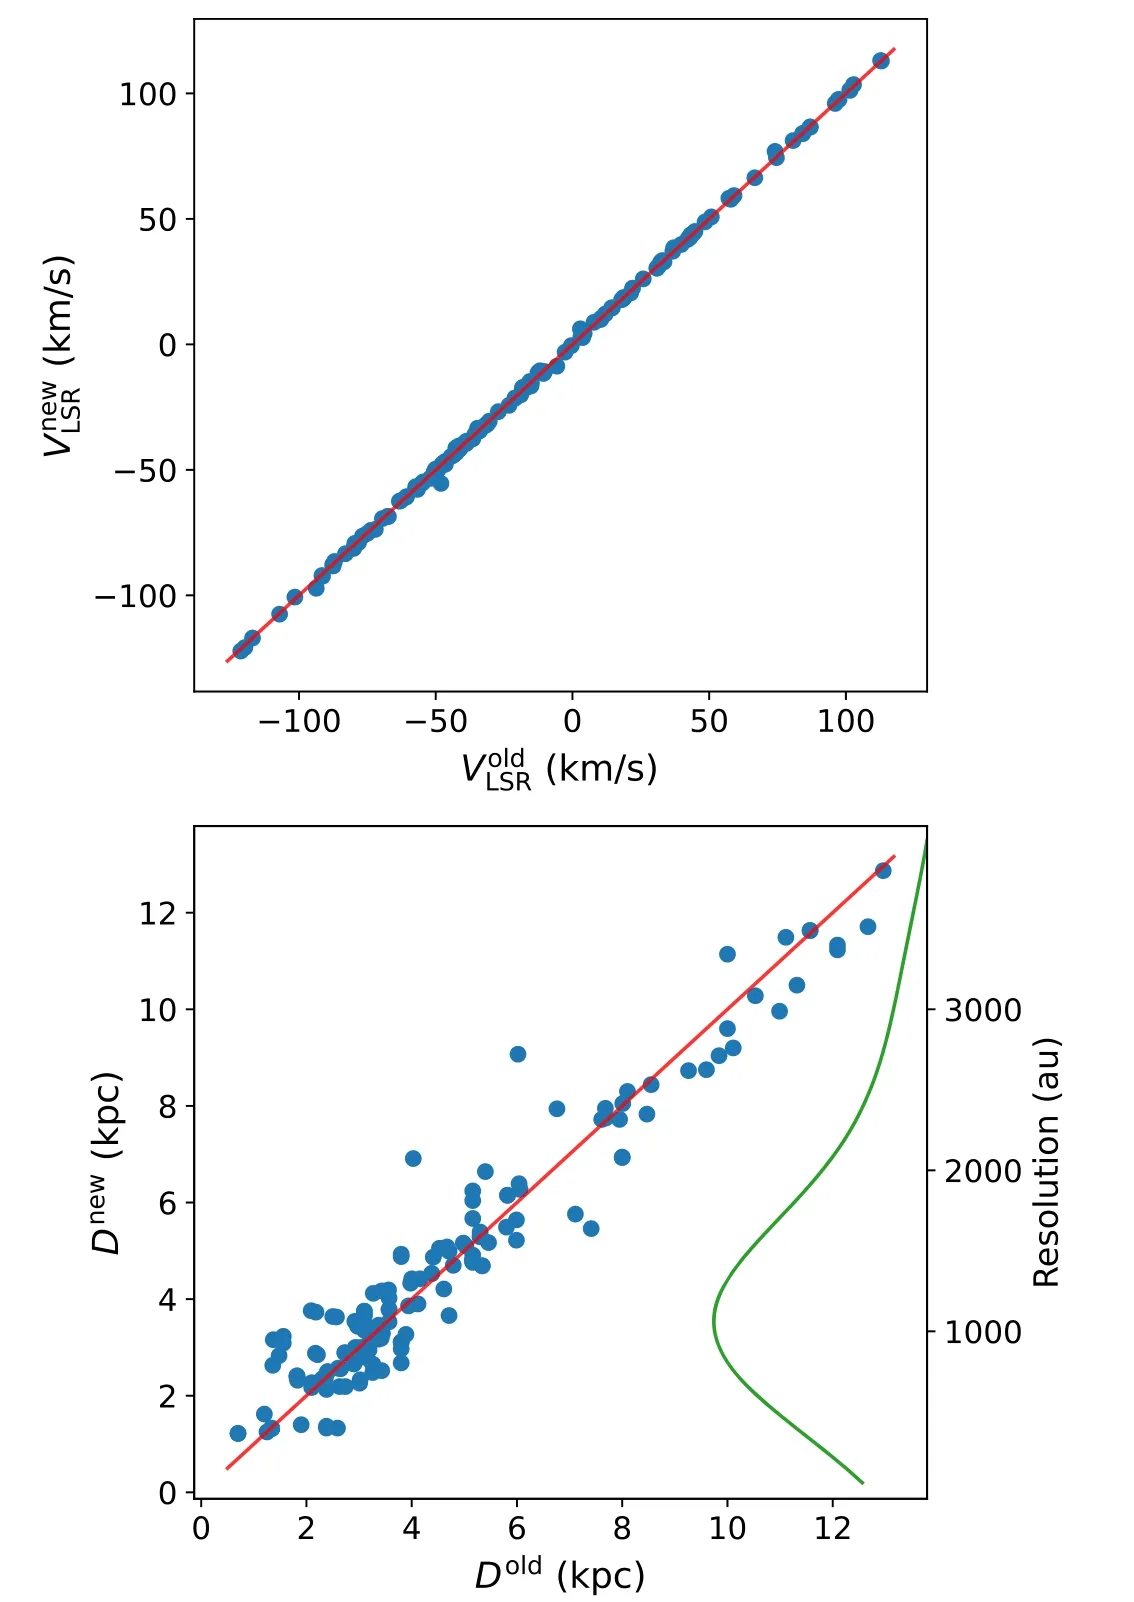
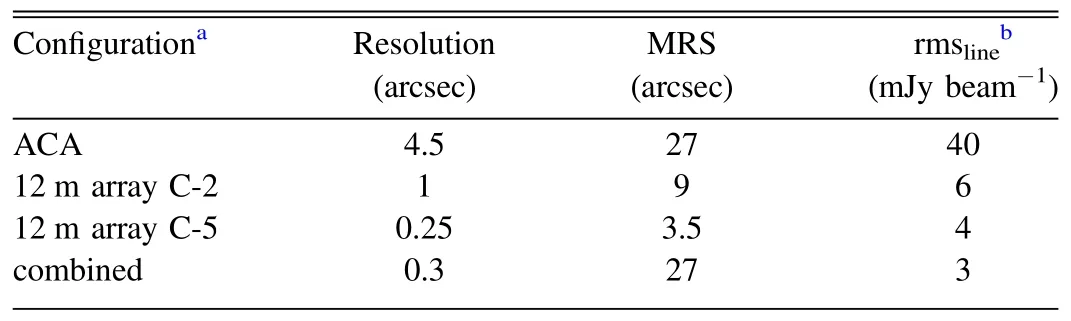
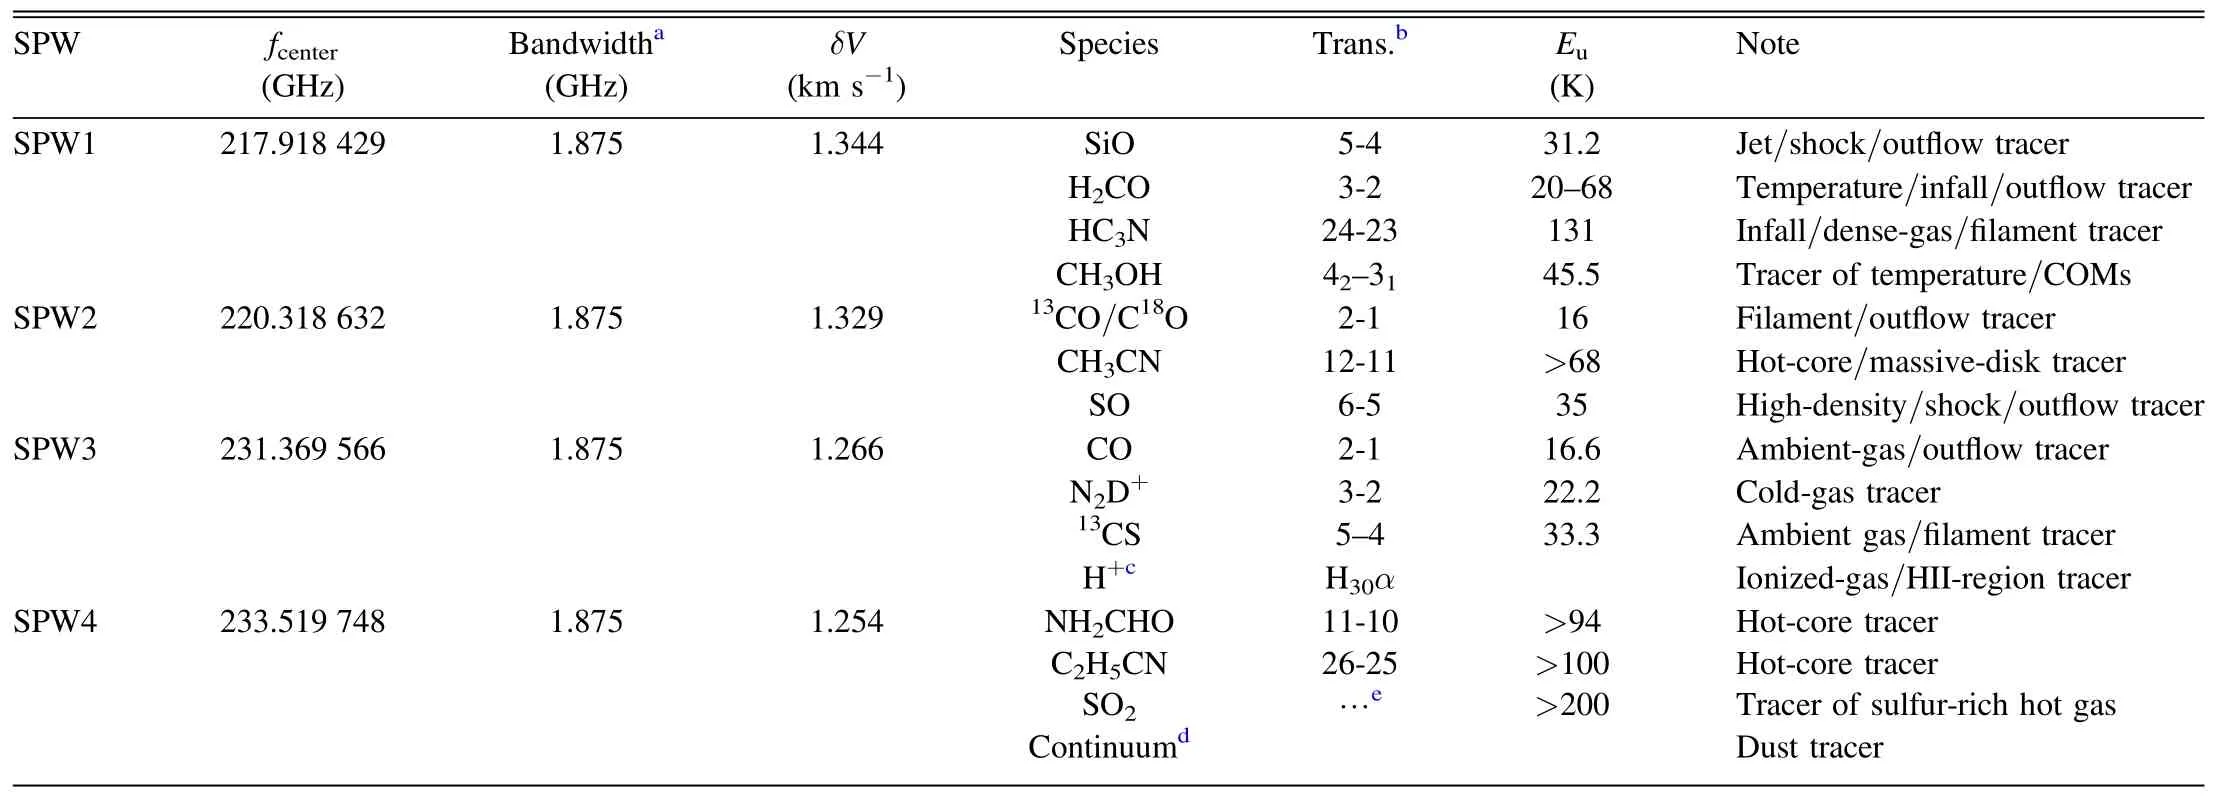
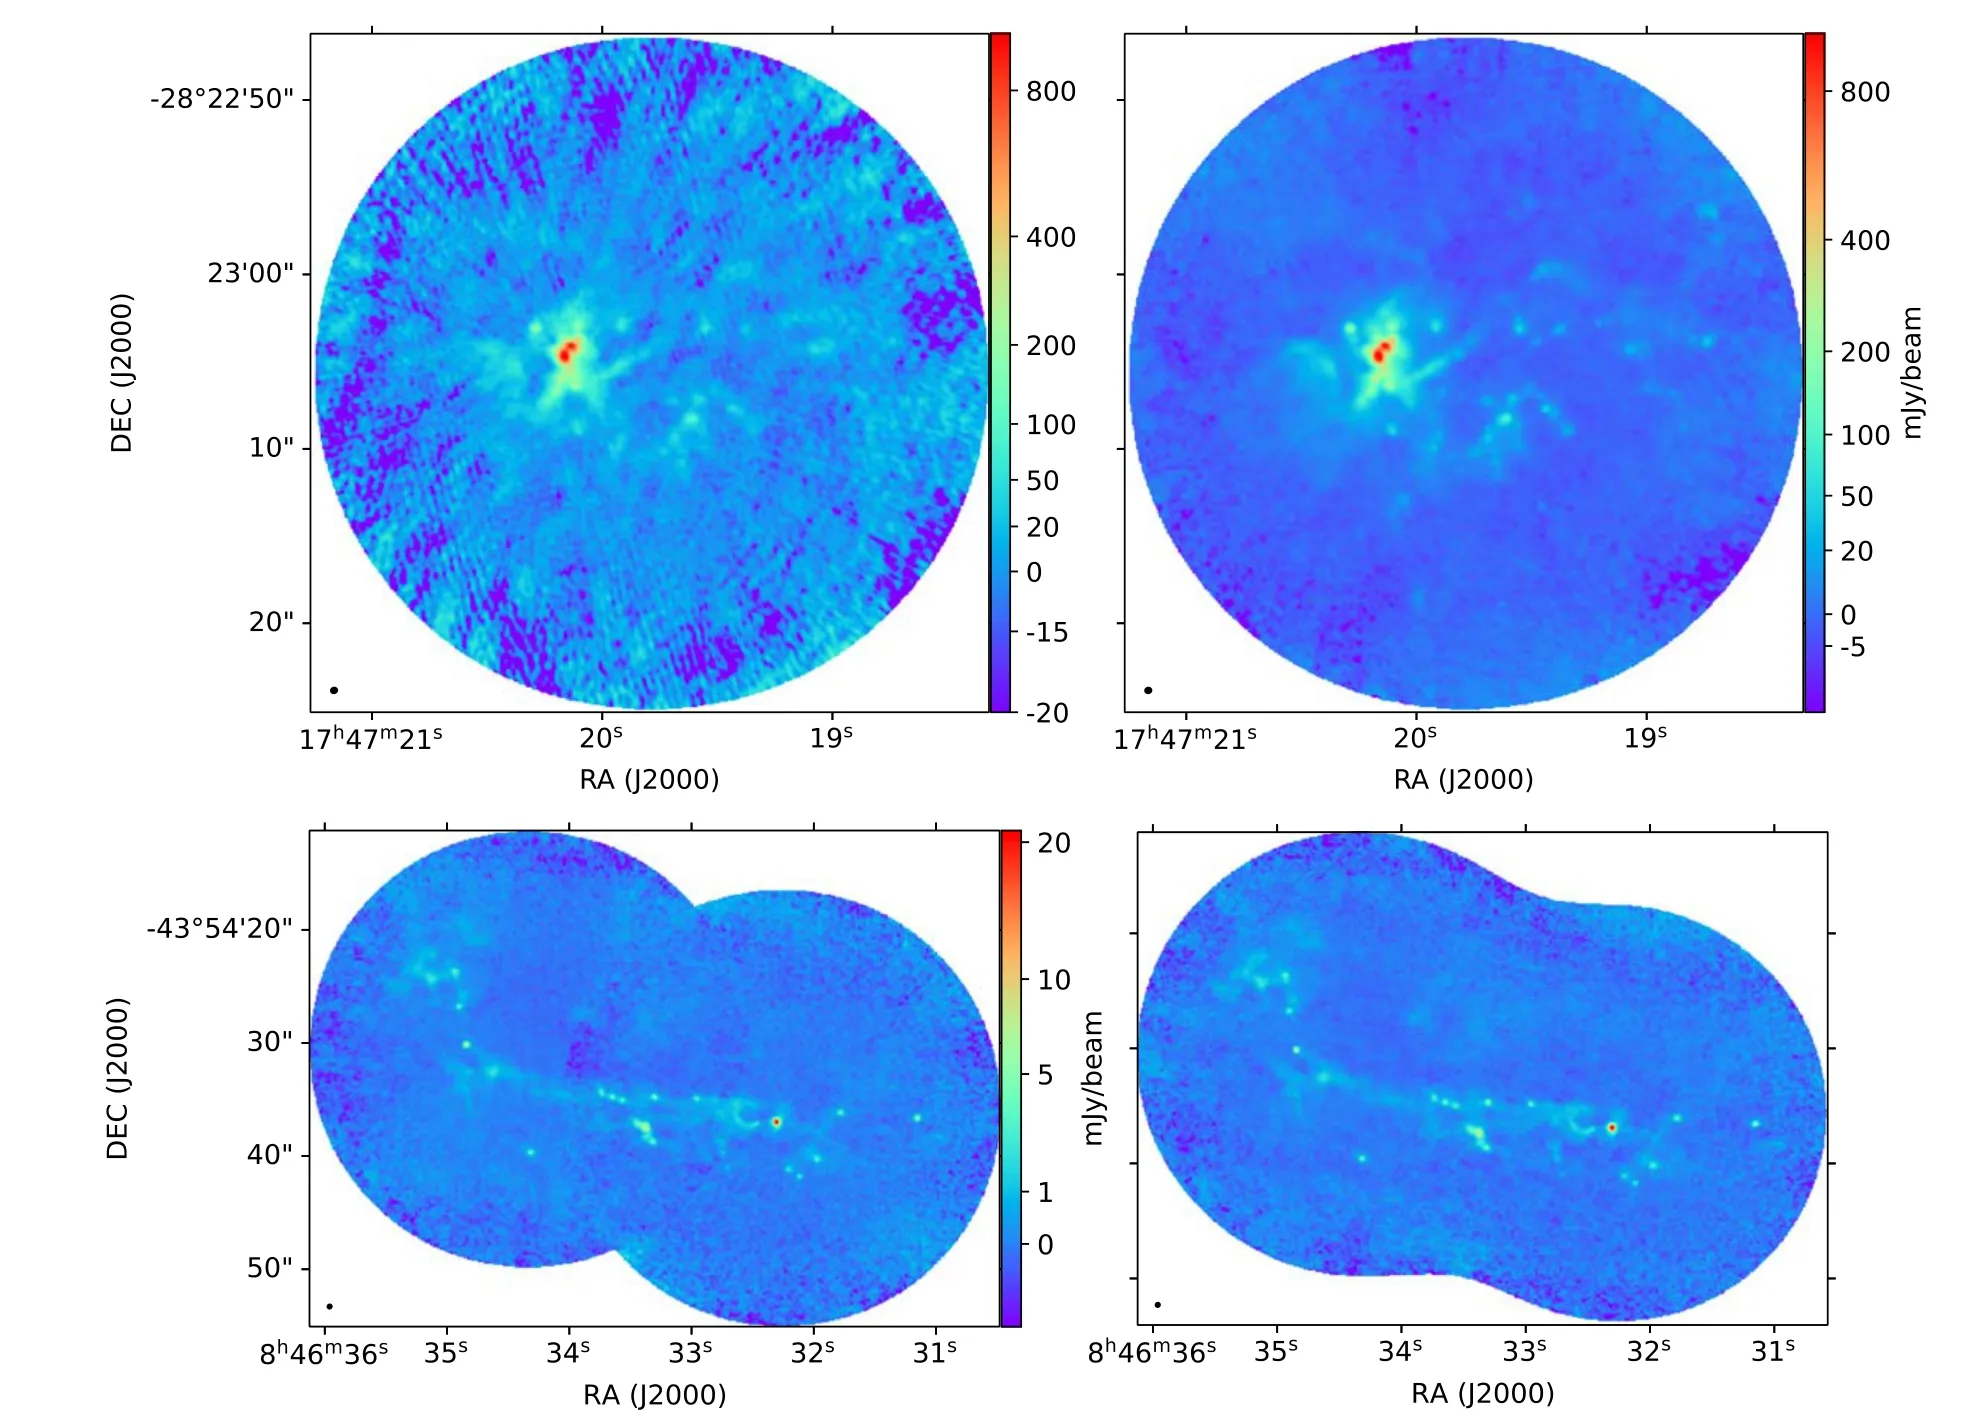
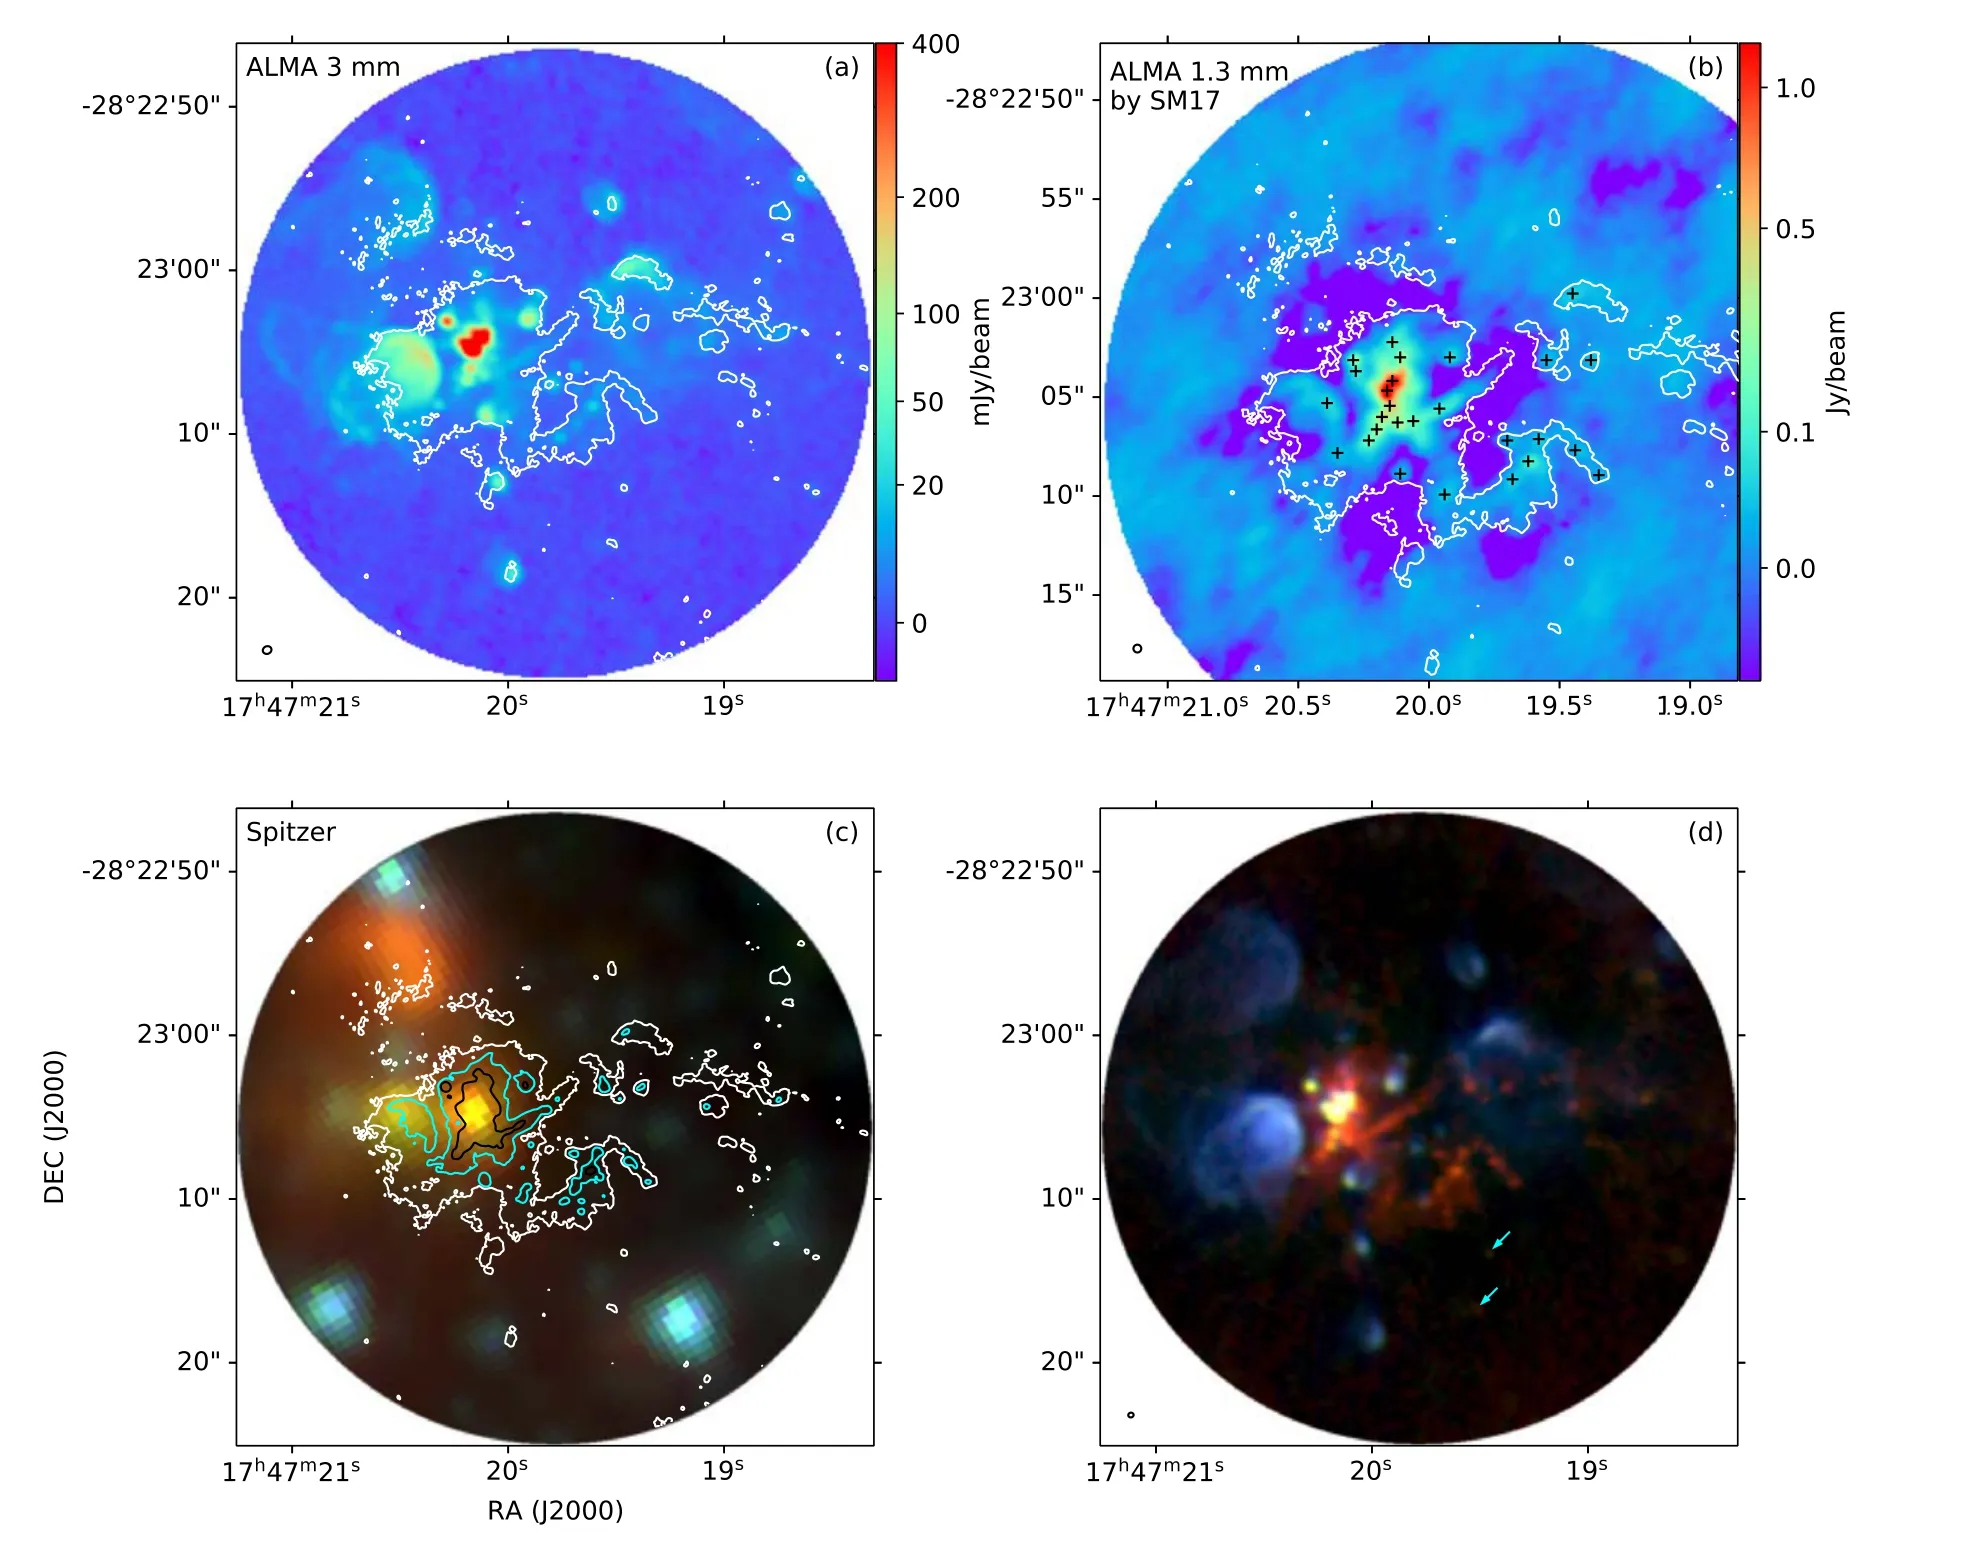
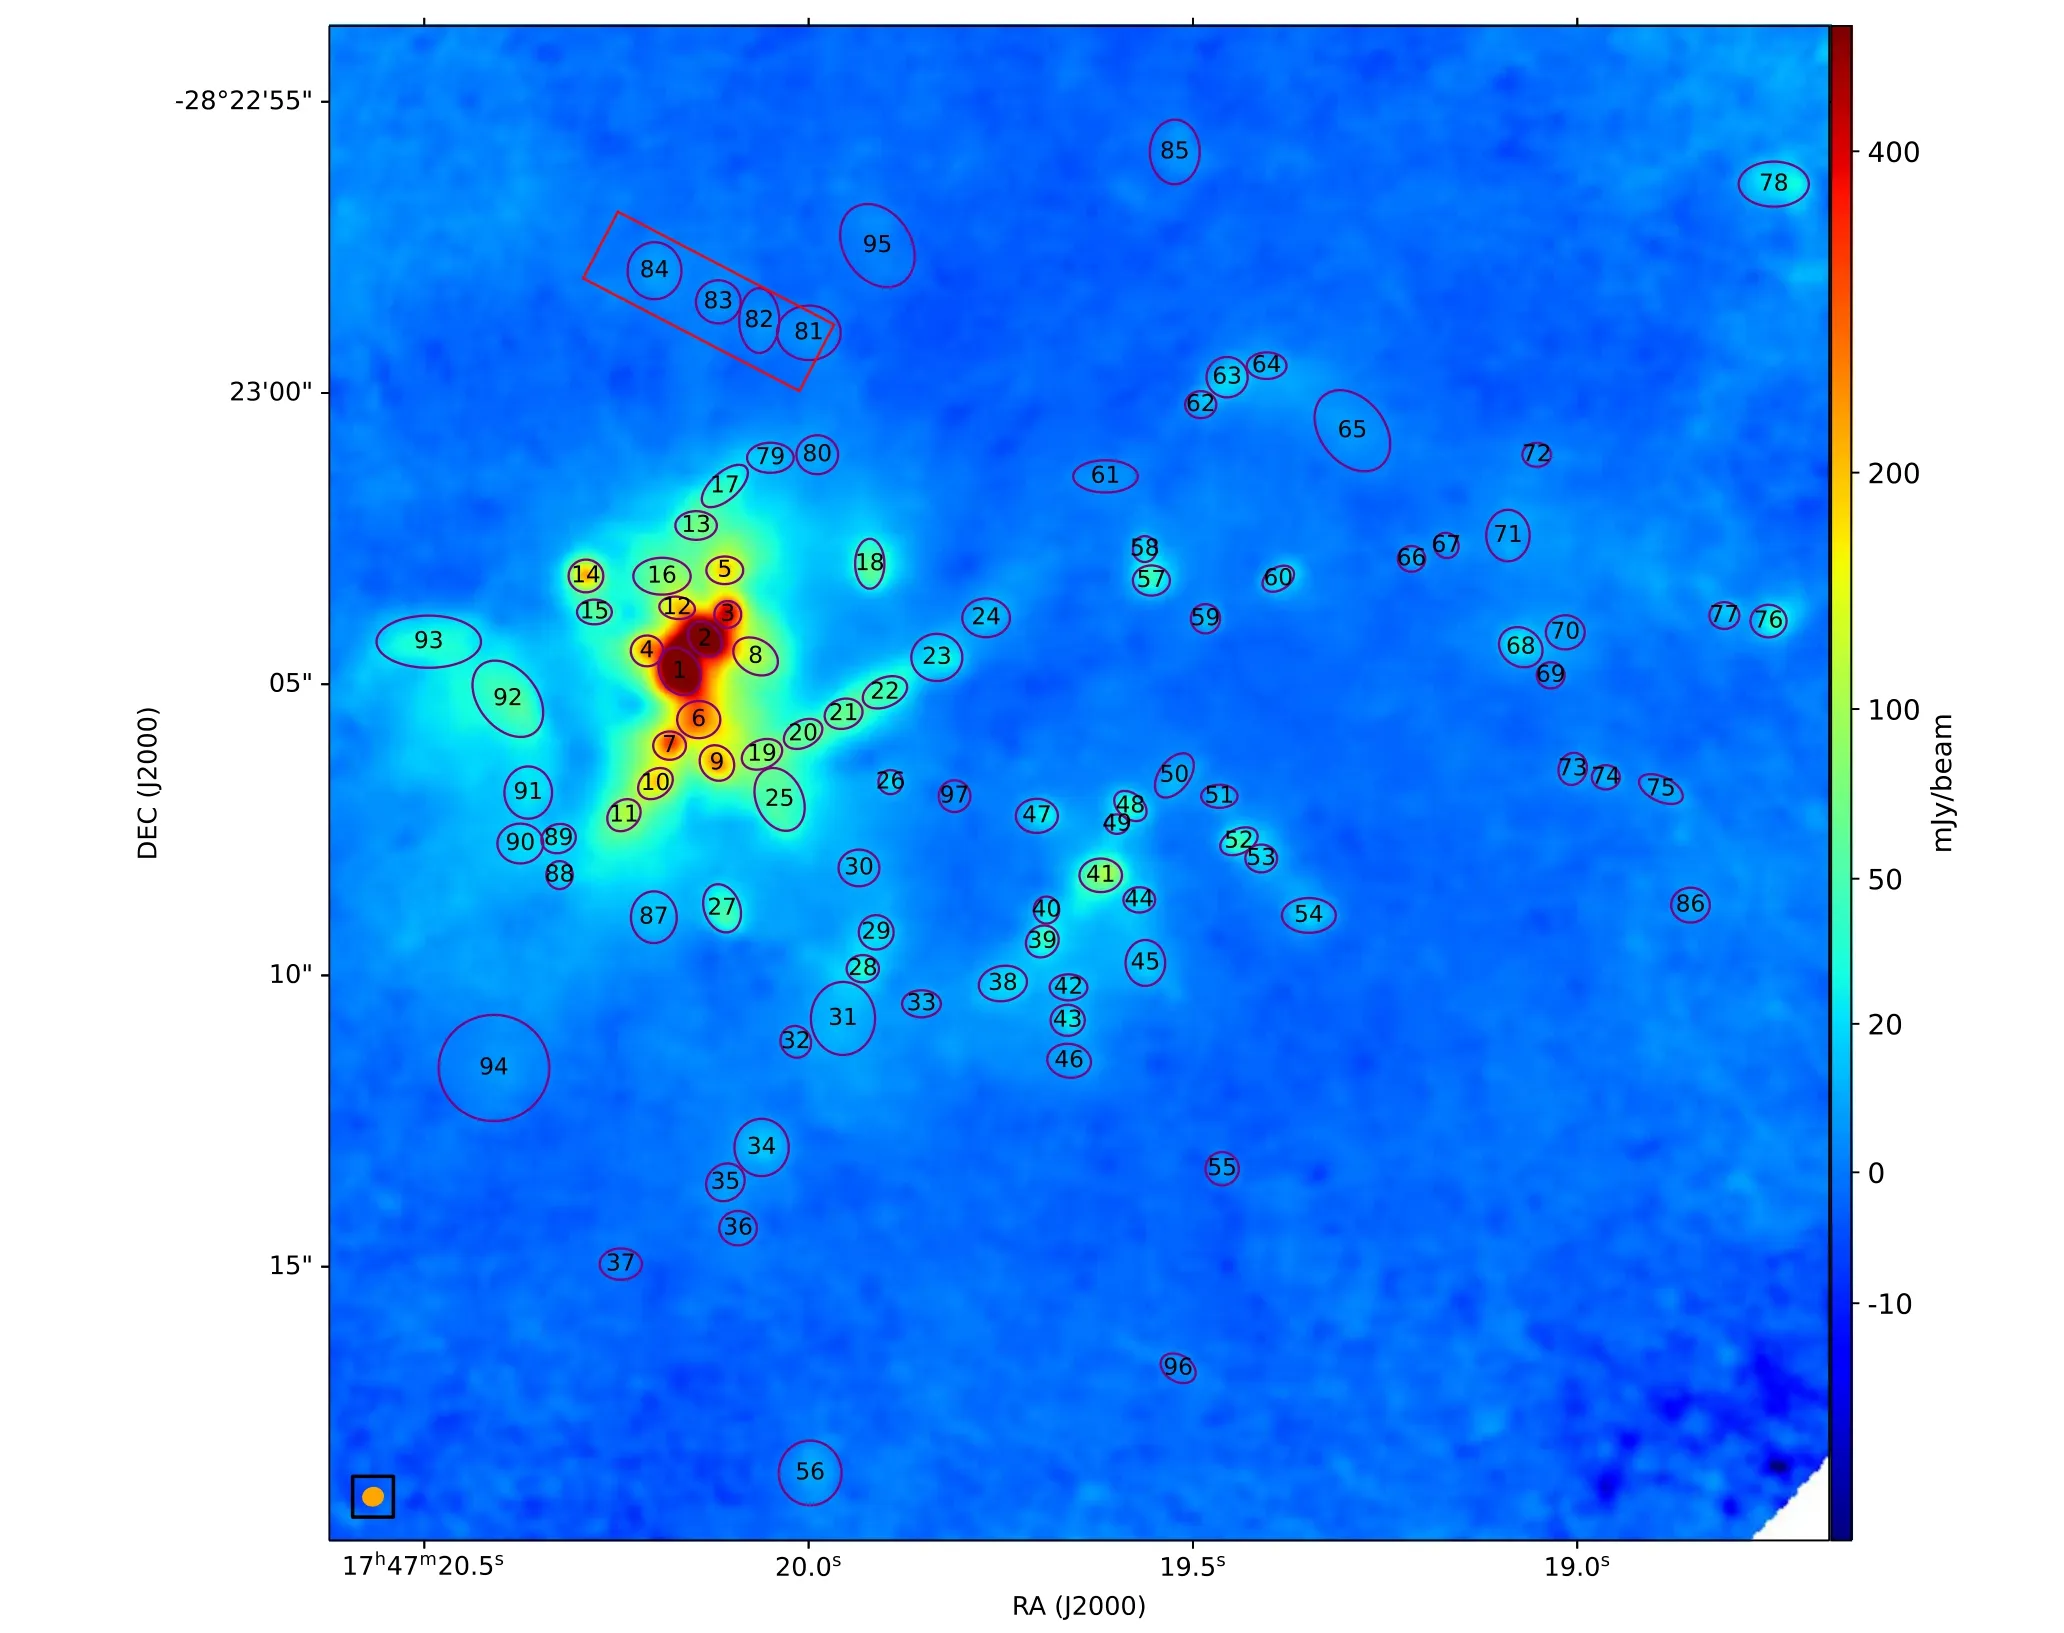
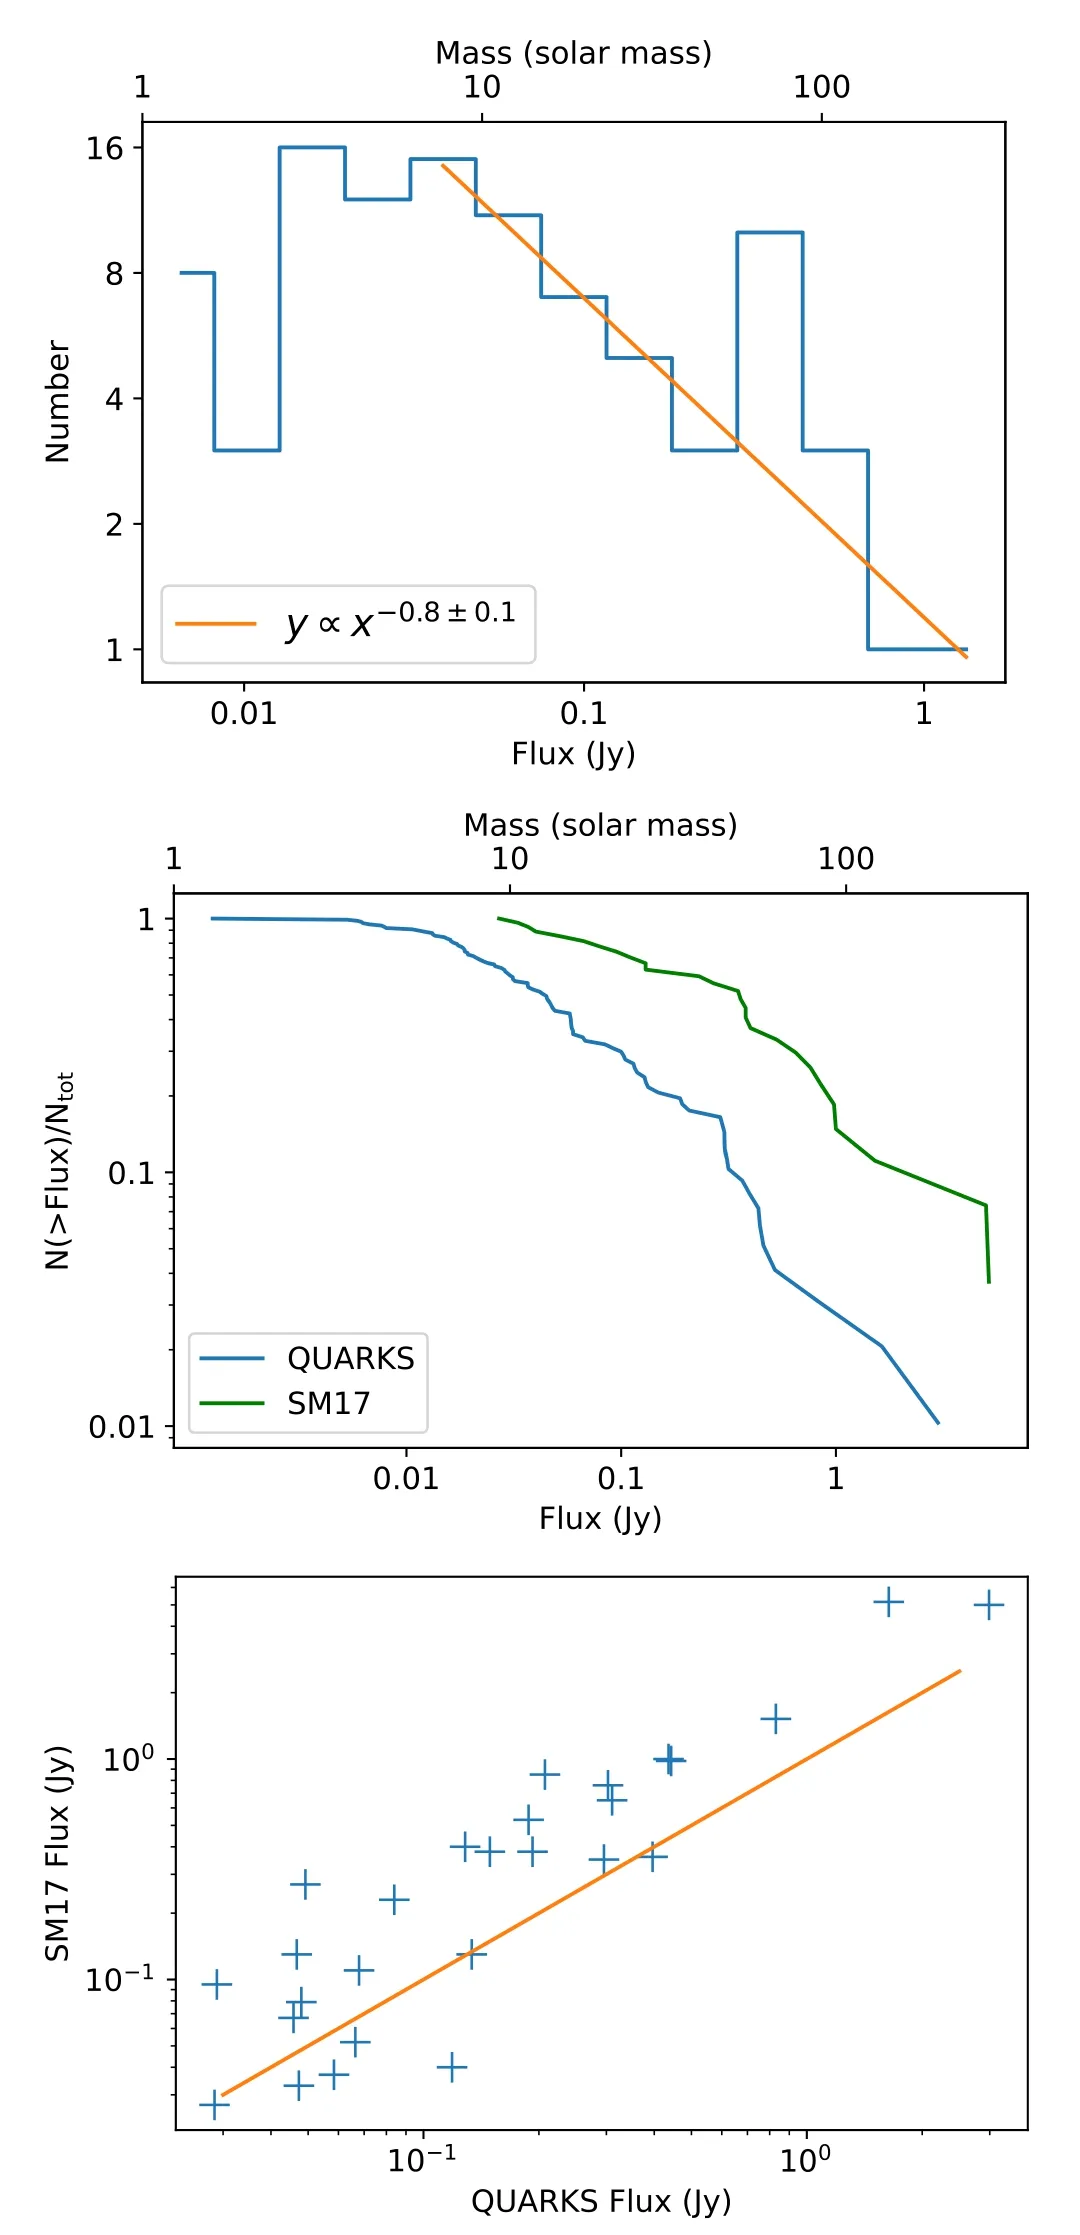
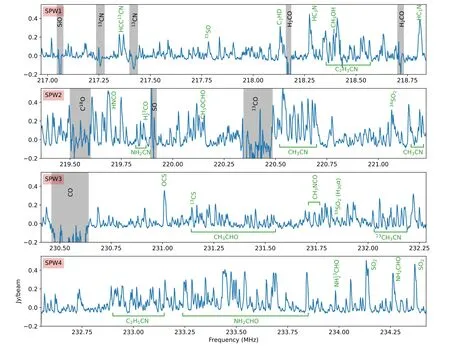
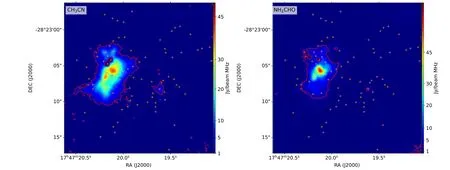
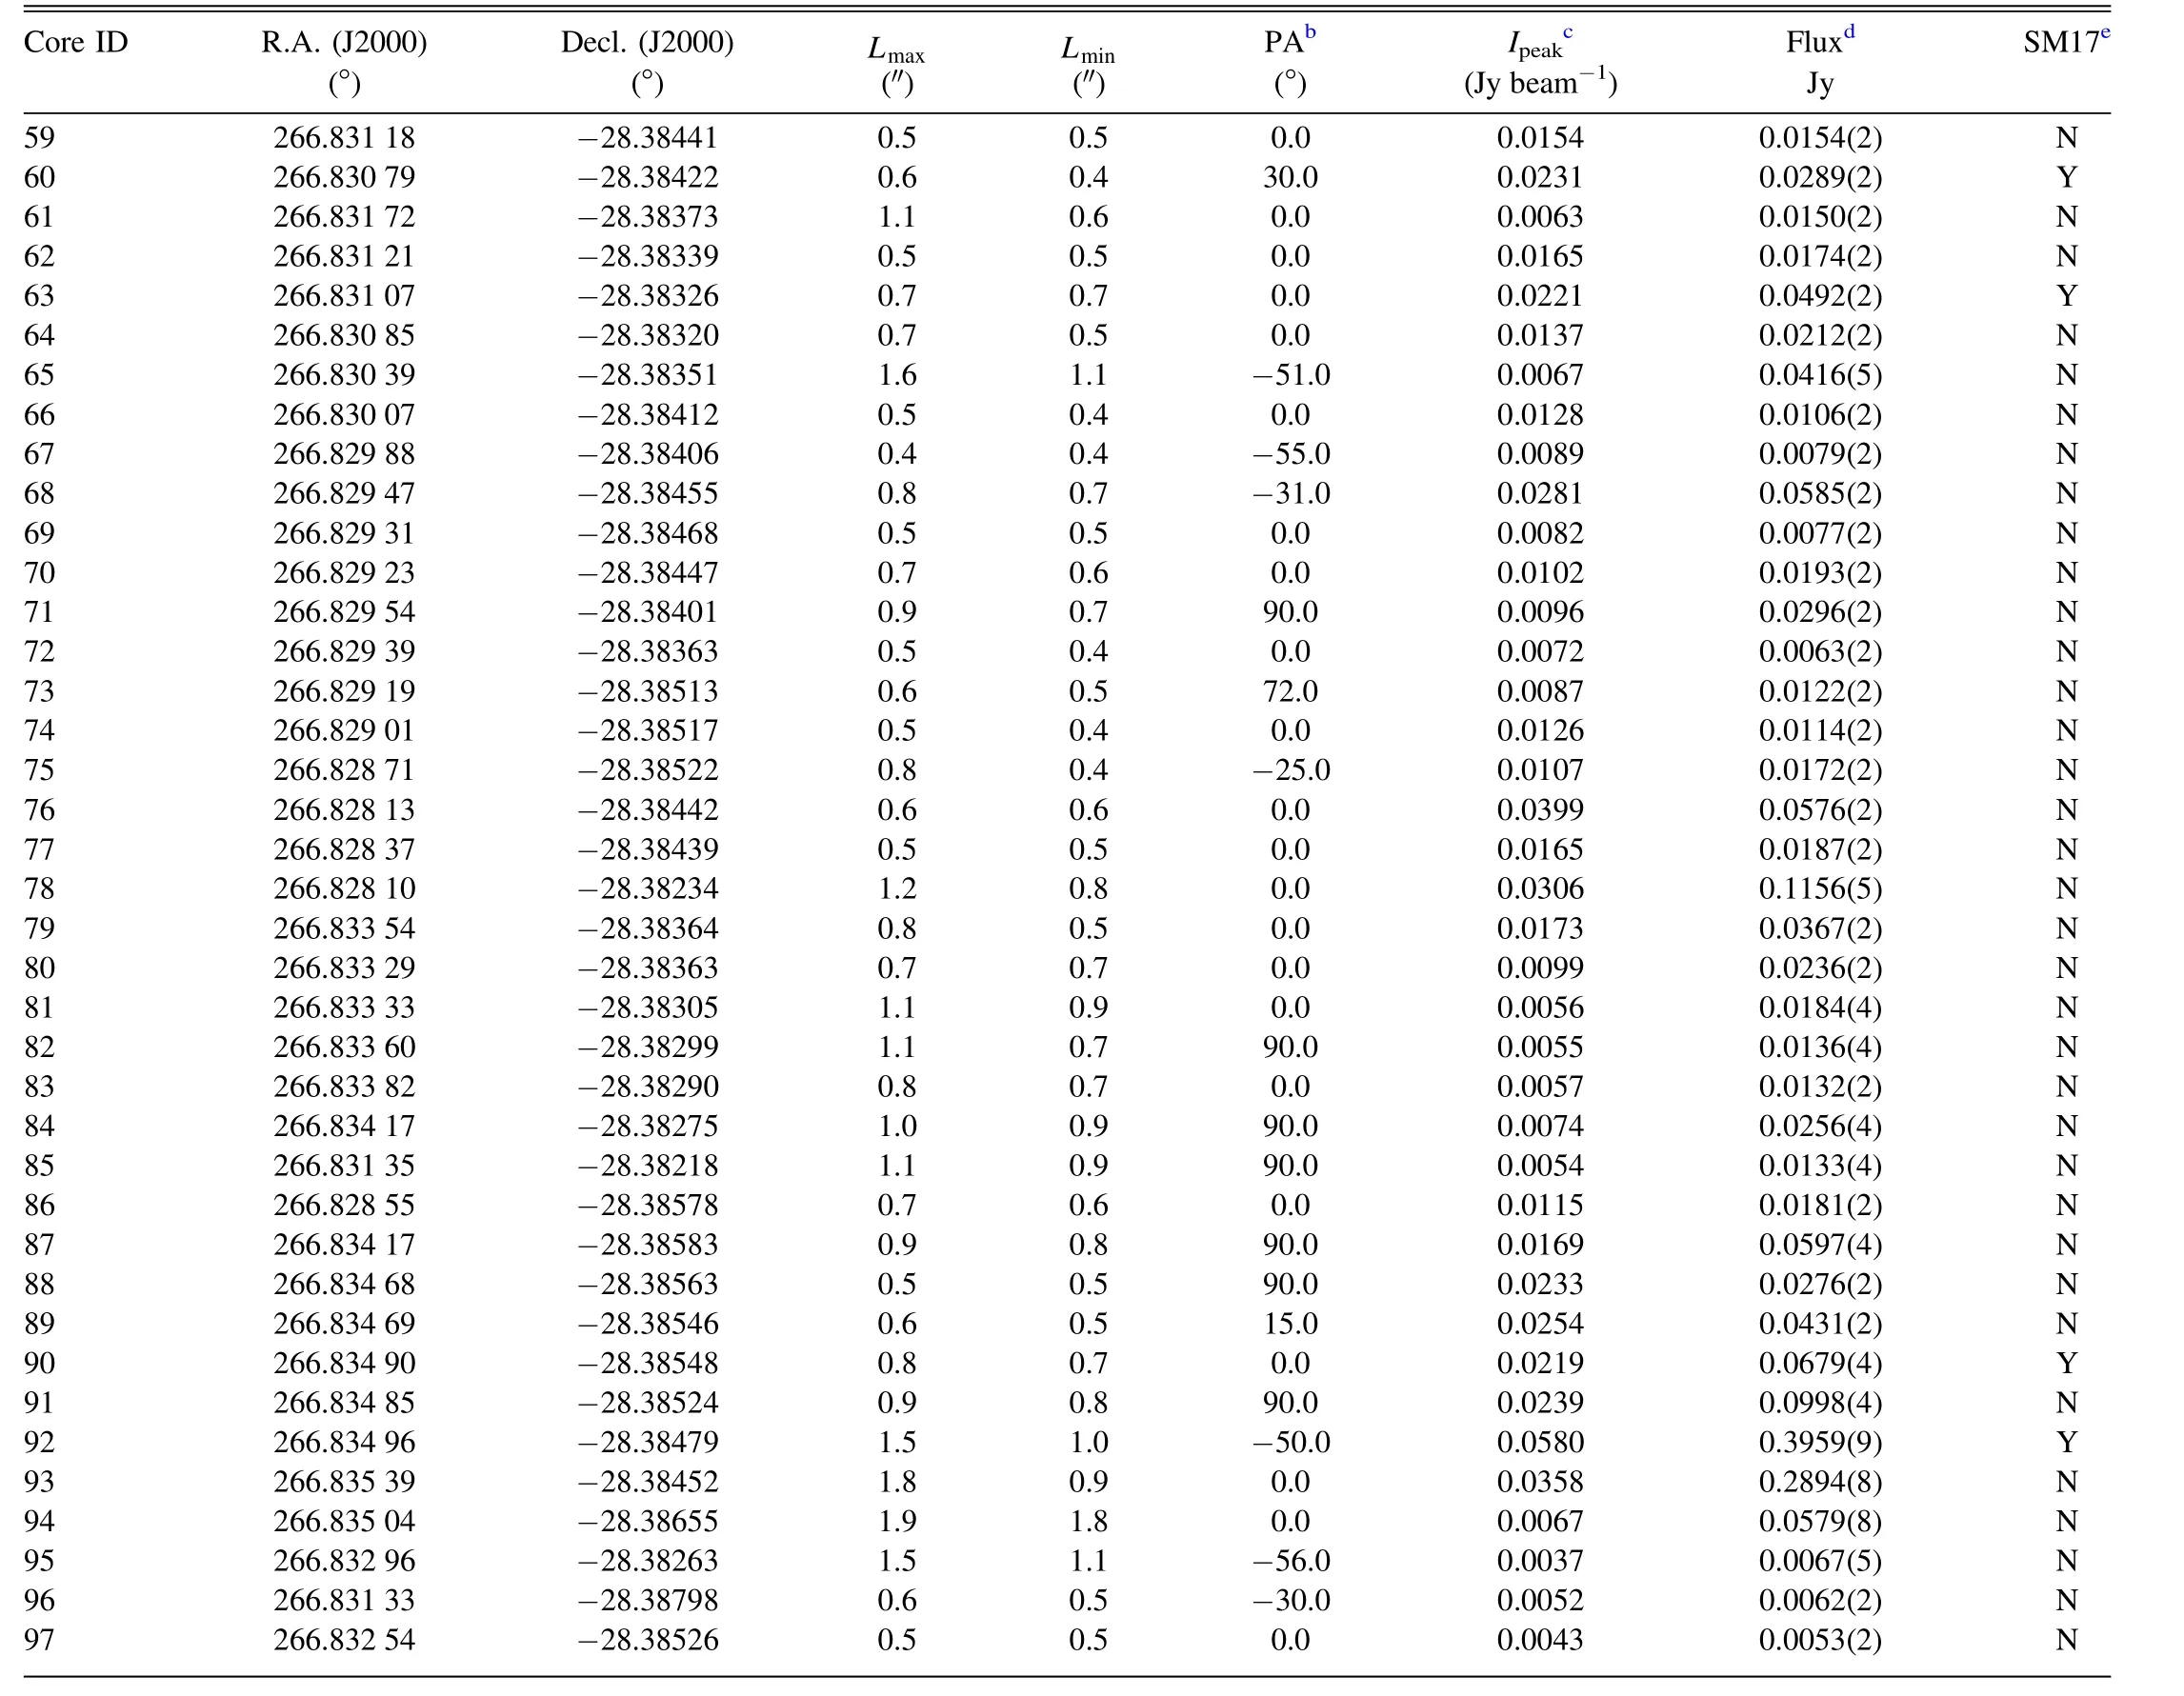
The QUARKS sample contains 139 protoclusters, selected as the densest kernels of high-mass star-forming regions revealed by the ATOMS survey(Liu et al.2020a).Among the 146 sources of the ATOMS, two sources are low-mass clumps(<15 M⊙),four sources are dominated by extended H II regions with angular sizes larger than the primary beam at Band 6,and one source has no detection of continuum emission by ATOMS.The seven sources show no massive and compact kernels under the view of ATOMS and were thus excluded in the QUARKS sample.The ATOMS sources were selected as the bright sources (Tb>2 K) of the CS J=2-1 survey of Bronfman et al.(1996), a complete and homogeneous molecular line survey of UC H II region candidates in the Galactic plane.The ATOMS sample was also observed in the SIMBA survey,a 1.2 mm continuum emission survey using the SEST telescope by Faúndez et al.(2004), and the survey of HCN(4-3)and CS(7-6)using the ASTE telescope by Liu et al.(2016).The ALMA primary beam size at Band 6 is about 0.4 times the value in Band 3,hence the field of view(FoV)of the QUARKS survey can only cover part of the FoV of the ATOMS survey(Figure 1).For 17 sources with elongated and filamentary structures revealed by the 3 mm continuum emission of the ATOMS survey, two pointings for each were requested to entirely cover their dense kernels (e.g., IRAS 08 448-4343 as shown in the right panel of Figure 1).In total,QUARKS has 156 single-pointings to observe 139 protoclusters.The clump masses (Mclump), quoted from Liu et al.(2020a), range from 40 to 2.5×10⁵M☉.These sources are located on the Galactic plane within a range of |b|<2°.1 and-98°.4 The distances of the QUARKS sample(Dold)adopted by the ATOMS survey were initially derived from the velocities of CS J=2-1 with an old Galactic rotation curve model(Bronfman et al.1996).We updated the distances(Dnew)using the distance calculator of Reid et al.(2016), based on the new systemic velocities of H13CO+(VLnSeRw) measured from the ATOMS survey(Liu et al.2020b).The distance calculator constrains the probability density function (PDF) of distance based on four types of information: kinematic distance (KD), the spiral arm model (SA), Galactic latitude (GL), and parallax source (PS)with different weights, which were assumed to be 0.85, 0.15,0.85, 0.15, respectively (Reid et al.2016).The velocities and distances of the sample are listed in Table A1. As shown in Figure 2,VLoSlRdandVLnSeRware consistent with each other, and the standard deviation of their differences is~1 km s-1, much smaller than the virial velocity (σvir) of~5 km s-1of giant molecular clouds (Chevance et al.2023).Thus, the new calculated distance should not be influenced much by the new velocity employed.Moreover, we compared Dnewand Dold, and found that they are consistent with each other with a 1σ deviation of 0.7 kpc(Figure 2).The distribution of the QUARKS survey linear resolutions (estimated adopting an angular resolution of 0 3; see Section 2.3) is shown as the green line in the lower panel of Figure 2.The distances(Dnew)of the sample of the QUARKS survey range from 1.2 to 12.9 kpc.The median value of distances is 3.7 kpc, at which a linear resolution of 1100 au can be achieved.The resolutions for most sources are within the range of 500–2000 au(Figure 2). We conducted single-pointing observations for the 156 targets of the QUARKS survey using the ALMA.The observations started from late 2021 October (Project IDs:2021.1.00095.S, 2022.1.00298.S, and 2023.1.00425.S; PI: Lei Zhu) with both the Atacama Compact 7 m Array (ACA) and the 12 m array of the ALMA at Band 6.Observations with the ACA were completed in late 2022 May.Observations with the 12 m Array have been partly executed in Cycles 8 and 9 and are expected to be completed in ALMA Cycle 10 (from 2023 October to 2024 September). Figure 2.Comparison between VLnSeRw and VLoSlRd is shown in the upper panel and between Dnew and Dold (Lower) in the lower panel.The red lines represent y=x.The green curve represents the kernel distribution estimation of the source distances (with respect to the left Y-axis) or of the Band-6 spatial resolution (with respect to the right Y-axis) of the QUARKS sample. For each source, observations in three different ALMA configurations were proposed.The observations in low,moderate and high resolution configurations were conducted by the ACA,ALMA 12 m array C-2 and C-5 configurations, respectively.In the ACA, C-2 and C-5 observations, the on-source time for one science target was approximately 5, 1, and 5 minutes,respectively.The typical values of the angular resolution,maximum recovering scale(MRS),and the sensitivity of spectral lines(rmsline)for different configurations,including the combined configuration, are summarized in Table 1.The continuum sensitivity (rmscont) is not listed, because the rmscontof the combined data varies in a wide range from 0.1 to several mJy beam-1for different sources, mostly because of the phase calibration and dynamic range limitations.Self-calibration was conducted for sources containing strong continuum (with peak value ?50 mJy beam-1) cores (Section 3).We note that for 1.3 mm continuum 1 mJy beam-1corresponds to a gas mass of 0.3 M☉at a distance of 5 kpc, derived assuming a median dust temperature of 30 K, a dust opacity per unit dust mass of1 cm2g-1at 1.3 mm(Ossenkopf&Henning 1994),and a gas-todust mass ratio of 100.The angular resolutions of the combined images are typically better than 0 35,which is about one-sixth of the resolution of the ATOMS survey(typically better than 2″)in Band 3 (Liu et al.2020a).The significantly improved angular resolution of the QUARKS survey enables us to resolve dense cores,including massive starless core candidates and protostellar ones(star-forming dense cores,hot molecular cores,and UC H II regions)within protoclusters,down to a physical scale of 3500 au in the most distant sources at a distance of ~10 kpc.For sources at a distance smaller than 3 kpc, the QUARKS survey can achieve a linear resolution better than 1000 au,and thus enable us to search for massive disk candidates(e.g.,Johnston et al.2015;Chen et al.2016; Olguin et al.2022). Table 1 ALMA Configurations of the QUARKS Survey The observations employed the Band 6 receivers in dualpolarization mode.Four spectral windows (SPW 1–4) were configured,and the frequency setups are shown in Table 2.The second, third, and fourth columns of Table 2 list the central frequency, bandwidth, and velocity resolution (δV) of each SPW (column 1).For the observations of the 12 m array and the ACA,each of the four SPWs has a bandwidth of 1.875 GHz and 2 GHz,respectively.The 5th to 7th columns of Table 2 list the parameters of the main transitions covered by each SPW,including the species name, transition labels, and upper-level energy (Eu).The four SPWs were configured to cover some commonly used lines including tracers for ambient gas (e.g.,CO,13CO, C18O), cold gas (N2D+), filament and infall (e.g.,HC3N), hot core (e.g., CH3OH, C2H5CN, NH2CHO), ionized gas (H30α), shocked gas (e.g., SiO, SO, H2CO), and massive protostellar disk(CH3CN),as listed in Table 2.SPW4 does not cover any low-energy strong lines (with upper-level energies Eu<100 K) and thus is good for measuring the continuum emission.The Band 6 continuum is mainly produced by dust emission.However, the Band-3 continuum emission of the ATOMS survey arises from a blend of thermal dust emission and free–free emission from ionized gas (Zhang et al.2023a).Combining the data of the QUARKS and ATOMS surveys,the dust emission and the free–free emission can be partly decoupled. Table 2 Set up of the Spectral Windows and the Main Targeted Lines in the QUARKS Survey The channel widths of the four SPWs are 976.563 kHz,corresponding to a δV of 1.25–1.35 km s-1, depending on the rest frequency.The spectral resolution is better than that of the two wide-band SPWs (SPWs 7 and 8) of the ATOMS survey,~1.6 km s-1(Liu et al.2020a).The velocity resolution of the QUARKS survey is high enough to spectrally resolve the emission lines of the outflows and ionized gas whose line wings or line widths are typically larger than 10 km s-1(Liu et al.2021a, 2022c; Zhang et al.2022), and the emission of complex organic molecules (COMs) from hot cores(ΔV ~5 km s-1; Qin et al.2022; Taniguchi et al.2023).The velocity gradients along the longest branches of HFSs were systematically revealed in the ATOMS survey to be 8.7 km s-1pc-1on average(Zhou et al.2022),corresponding to a velocity difference of ~5 km s-1at the maximum recovering scale(0.6 pc at a distance of 5 kpc) of the QUARKS survey.Thus,spectral lines of species such as HC3N can be used to trace the multi-scale structures and gas kinematics within the clumps(Liu et al.2022a; Xu et al.2023b).The massive starless core candidates found so far tend to show no emission lines or narrow lines(with linewidths<1 km s-1)of cold gas tracers at Band 6 (e.g., Cyganowski et al.2014; Kong et al.2017).The N2D+data of the QUARKS survey do not have sufficient spectral resolution to fully resolve the internal gas kinematics of possible massive starless cores found by this survey,but can provide us the spatial distribution of cold gas.The line widths of the (sub-)Keplerian disks around massive stars are typically 5–10 km s-1(Johnston et al.2015; Chen et al.2016; Sanna et al.2019).The velocity resolution of the QUARKS survey is high enough to spectrally resolve the massive disks,if detected.In a word,for most purposes,the spatial and spectral resolution in the QUARKS survey should be high enough for resolving the gas structures and kinematics in massive protoclusters. The 12 m array data and the ACA data of the QUARKS survey were combined to reveal both compact and extended emission.Sgr B2(M), also named I17441-2822 in this survey,is one of the QUARKS sources with most complex and richest line emission.It is very complicated to reduce the data and produce high-quality images for this object.In this work, we take Sgr B2(M)as an example for evaluating our data reduction procedure.The imaging was carried out using the CASA software package of version 6.5 (McMullin et al.2007). To separate the emission of continuum and spectral lines,the emission line channels need to be flagged.The spectral lines mainly contain the extended strong emission (e.g., the transitions with Eu<100 K listed in Table 2) and the forest of COM lines from hot cores.First, we identified all the transitions of strong lines within the four SPWs through matching the ALMA pipeline reduced data cubes and the laboratory databases for spectral lines(e.g.,the CDMS;Müller et al.2001).Since VLSRof the source is already known(Section 2.1),the observed frequencies of those strong lines can be roughly determined.Because of the possible existence of multiple velocity components and of foreground absorption,an aggressive strategy was adopted for strong lines by flagging out all the channels within±50 km s-1of them. For the line forest in hot cores,we first checked the fits cube of the ALMA pipeline products of the C-5 data, and manually extracted the spectra of hot cores.We calculated the rms of the unflagged channels, and then channels with intensity greater than 5×rms were flagged in our reduction.This procedure is repeated until we can no longer flag any more channels.Since the influence of the line forest is limited to hot cores, a relatively conservative strategy was adopted by flagging out the channels of±10 km s-1around those lines.For a source with no fits cube produced by the ALMA pipeline, the channel flag of Sgr B2(M) was adopted as a template flag.We shifted the template flag before applying it to other sources according to their velocities (Table A1).If the image quality of a source is not good because of an improper flag of emission line channels,we update the flag through checking the hot-core spectra extracted from its fits cube obtained in the first round of imaging and then conducted a second round of imaging. To increase the sensitivity of the continuum image, data of all the four SPWs were used.The line-free channels (channels that have not been flagged out by the procedures described in Section 3.1) of both the ACA and 12 m array data were fed to CASA-tclean to make the continuum maps.The Multi-scale Multi-Frequency Synthesis(mtmfs;McMullin et al.2007)with an nterm of 2 was chosen as the deconvolving algorithm.This algorithm is appropriate for cleaning on the combined visibility data of multiple configurations and multiple SPWs.The briggs weighting with a robust of 0.5 was adopted.For a source with strong continuum emission such as Sgr B2(M),self-calibration is necessary to improve the image quality(Section 3.2.1).For a source observed by two pointings such as the IRAS 08 448-4343(see Figure 3),we combined the visibility data of the two pointings before imaging. 3.2.1.Self-calibration of Sgr B2(M) The 1.3 mm continuum of the Sgr B2(M)is very strong with a peak intensity (Ipeak) of ~1.2 Jy beam-1and a total flux of>23 Jy.A threshold of 20 mJy beam-1was adopted for the first iteration of the cleaning process of the continuum image.A lower threshold resulted in divergence.With that threshold,the reduced 1.3 mm continuum image of Sgr B2(M)show apparent fuzzy artifacts(left panel of Figure 3).This result agrees with a low dynamic range (Ipeak/rmscont~180) for sources having complicated and strong continuum emission, implying that the systematic errors of the calibrations of phase and amplitudes dominate over the thermal noise.Self-calibration is a technique for correcting the visibility phases and/or amplitudes of a source by comparing the visibility data with a model of the source itself (e.g., Richards et al.2022).For strong continuum sources like Sgr B2(M), self-calibration must be applied to improve its dynamic range. The phases of the visibility data were self-calibrated based on the model of the first round of cleaning, following the CASA manual.23https://casaguides.nrao.edu/index.php?title=First_Look_at_Self_Calibration_CASA_6A solint of 20 s was adopted for the gaincal task.Adopting a lower threshold (5 mJy beam-1for Sgr B2(M)), the continuum image was cleaned in the second round,and the model was updated accordingly.Then,both the phases and amplitudes of the visibility data were self-calibrated based on the updated model.Finally, adopting an even lower threshold (1.5 mJy beam-1for Sgr B2(M)), the cleaning process was conducted again to obtain the final continuum image.An rms of the residual map of 0.5 mJy was achieved through self-calibration for Sgr B2(M), corresponding to a dynamic range of greater than 2000.The final self-calibrated image greatly improves the quality compared with the non selfcalibrated image.Extended structures that can only be marginally seen in previous observations (Figure 4) can be clearly recognized in the self-calibrated continuum image of the QUARKS survey, e.g., the north arc of Sgr B2(M) marked by the red rectangle in Figure 5 (see Section 3.2.2 for the discussion about the reliability of this structure).Approximately a hundred cores or compact substructures can be identified in Sgr B2(M) from the Band 6 self-calibrated continuum image of this survey (see Figure 5 and Section 4.1 for details).Note that some of compact cores have weak continuum emission,which will be carefully scrutinized below for their reliability (see Section 3.2.2). There is no general rule for choosing the thresholds of selfcalibration, and we conducted self-calibration manually and iteratively to optimize the thresholds that can avoid divergence while yielding good sensitivity.The continuum sensitivity of the QUARKS survey was expected to be 0.06 mJy beam-1,according to the proposed observation design (Section 2.3).The final threshold of the continuum image of Sgr B2(M) is still higher than the expected sensitivity, mostly because (1)emission of Sgr B2(M) in Band 6 is dominated by strong spectral lines and thus the selection of line-free channels is difficult; (2) possible contamination comes from antenna sidelobes; (3) the strong and complex emission of Sgr B2(M)does not allow the self-calibration to further improve the dynamic range.Here we have conducted only two rounds of self-calibrations and additional rounds with more carefully chosen thresholds may further improve the image quality.For a weak source, such as I08448-4343, a final threshold of 0.2 mJy beam-1can be achieved without self-calibration,approaching the proposed 3σ sensitivity, and thus selfcalibration is not required for it (lower panels of Figure 3). Figure 3.The ALMA Band 6 continuum of Sgr B2(M)(upper)and IRAS 08 448-4343(lower).For Sgr B2(M),the upper right and upper left panels are the images with and without self-calibration,respectively.For IRAS 08 448-4343,the lower left panel shows the image stitched from two independently cleaned images,and the lower right panel shows the image cleaned from the combined visibility data.The two lower panels share the same color bar.In each panel,primary beam correction has been applied, and the black small ellipse in the lower-left corner represents the synthesized beam. 3.2.2.Reliability of the Self-calibration To evaluate the reliability of our self-calibration, we examined the self-calibrated continuum image of Sgr B2(M)from the QUARKS survey through comparing it with observations from different frequency bands (Figure 4).Sgr B2(M) was observed with ALMA at Band 6 by SM17(Sánchez-Monge et al.2017) in Cycle 2, with a resolution of~0 4, similar to the resolution of the QUARKS survey of~0 3.However, the sensitivity of SM17 is 8 mJy beam-1,which is about 16 times lower than that of the QUARKS survey for Sgr B2(M) (~0.5 mJy beam-1).The peak intensities of the Band 6 continuum of Sgr B2(M) are about 1.8 and 1.2 Jy beam-1by SM17 and QUARKS, respectively, and are consistent with each other considering the different beam sizes and frequencies.All the cores of Sgr B2(M)identified by SM17 can be successfully recognized in the QUARKS continuum map (Section 4.1). Two isolated cores, numbered 55 and 96 in Figure 5, are visible in the self-calibrated continuum map of the QUARKS survey, but would be overwhelmed by noise if self-calibration were not applied (Figure 3).These cores are not visible in the continuum map of SM17 (see panel (b) of Figure 4), but are present in the ALMA Band 3 (λ ~3 mm) continuum map observed by Ginsburg et al.(2018) with signal-to-noise ratios(S/Ns)greater than 5 at a resolution of ~0 5 (see panel (a)of Figure 4).The long-baseline Band-6 observations by Budaiev et al.(2023) have also revealed these two cores at an angular resolution of ~0 06.Thus, these two cores seen in the selfcalibrated continuum map of the QUARKS survey should be reliable. Figure 4.(a) Image of the ALMA Band 3 continuum emission of Sgr B2(M) with a resolution of ~0 5 by Ginsburg et al.(2018).The beam size is shown as an ellipse at the lower-left corner.The white contour shows the ALMA Band 6 (at 1.3 mm) continuum emission from the QUARKS survey at the level of 5σ(2.5 mJy beam-1).(b) Image of the ALMA Band 6 continuum emission from SM17 (Sánchez-Monge et al.2017).The fields of view of SM17 and the QUARKS survey are not identical,but all 27 cores identified by Sánchez-Monge et al.(2017)marked by the black crosses are shown in this panel.The contour is the same as in panel (a).Note that the color map (rainbow with a power-law normalization with a power index of 0.4) is similar to that of Figure 3, where the ALMA Band 6 continuum of the QUARKS survey is shown.(c)Three-color image composed by the Spitzer 8(red),4.5(green),3.4(blue)μm continuum.The white,cyan,and black contours show the ALMA Band 6 continuum of the QUARKS survey,at the levels 2.5,15,and 50 mJy beam-1,respectively.(d)Three-color image composed of the ALMA Band 6 continuum of the QUARKS survey in red, the ALMA Band 3 continuum by Ginsburg et al.(2018) in green, and the VLA Band C (at ~6 GHz)continuum by Meng et al.(2022)in blue.The cyan arrows pinpoint Cores 55 and 96(see Figure 5 and Section 3.2.2).The beam size of the QUARKS survey is shown as an ellipse at the lower-left corner. Core 97,with a weak peak intensity of 5 mJy beam-1at Band 6 measured from the self-calibrated continuum image of the QUARKS survey,is located near the central crowded regions of Sgr B2(M).This core is not visible on the continuum map of SM17, but can be seen on the ALMA Band 3 (Ginsburg et al.2018) and VLA Band C (6 GHz; Meng et al.2022, see also panel (d) of Figure 4) continuum maps.Therefore, core 97 is considered reliable and could be an embedded UC H II region. The north arc marked as a red rectangle in Figure 5 has not been reported previously.We checked the 3 mm continuum (Ginsburg et al.2018) and the 1.3 mm continuum (Sánchez-Monge et al.2017) from earlier observations and found tentative detection of the north arc (Figure 4), confirming its reliability.In conclusion,most, if not all, compact cores and extended structures in the continuum emission of the QUARKS survey can be reliably recovered by self-calibration in our data reduction. Figure 5.Zoom in the image of the right panel of Figure 3.The purple ellipses and black numbers marked the cores and substructures of Sgr B2(M)detected in the Band-6 continuum image(Section 4.1).The red rectangle marks the north arc of the Sgr B2(M).The orange ellipse in the lower-left corner represents the synthesized beam size. The calibration tables calculated from the self-calibration of continuum data were applied to all the channels, including the emission line channels.Subsequently, polynomial fitting was conducted to the data of the line-free channels in the visibility domain, and the continuum components were subtracted using the uvcontsub task of CASA.The visibility data of each SPW were then fed to CASA-tclean to generate cube of spectral lines.Thus,all the spectral cubes we generated are continuumsubtracted.The deconvolution algorithm of tclean was chosen as multiscale.Since the dynamic ranges of the spectral images are overall lower than that of continuum images, in practice, a uniform threshold of 15 mJy beam-1(corresponding to a brightness temperature, Tb, threshold of 3.8 K for a beam size of 0 3)was chosen to optimize the performance of the cleaning of spectral cubes for most sources.As a result, the rms of the spectral cube of the QUARKS survey is ~3 mJy beam-1per channel, equivalent to an rms of Tbof 0.8 K per channel. The giant molecular cloud Sgr B2 is the most massive(~107M☉; e.g., Goldsmith et al.1990) region with ongoing high-mass star formation in the Galaxy.It is an exceptional region in the Central Molecular Zone(CMZ),which appears to be deficient in star formation (e.g., Guesten & Downes 1983;Kauffmann et al.2017).Its distance,estimated from the newest version of the distance calculator of Reid et al.(2016), is 8.3 kpc (Table A1), consistent with the values adopted by previous studies (e.g., Ginsburg et al.2018; Meng et al.2019)based on the results of Reid et al.(2014).Sgr B2(M) is one of the two most well-studied “hot cores” (Sgr B2(M) and Sgr B2(N))located in the central part of Sgr B2,which are actually high-mass protoclusters containing hundreds of protostellar cores (Ginsburg et al.2018; M?ller et al.2023).Sgr B2 has also provided the detection of most molecules discovered so far in the interstellar medium, and thus is considered a very good target for studying astrochemistry (e.g., Belloche et al.2008;McGuire 2022).In this section, we explore the continuum(Section 4.1)and spectral(Section 4.2)data, and present some links between the data and science topics of the QUARKS survey through a brief case study of Sgr B2(M). Figure 6.Upper: The fluxes distribution of the cores in Sgr B2(M) (Figure 5).The orange line represents the power-law fitting of data at the high-flux end.Middle: The cumulative fluxes distribution of the cores in Sgr B2(M) by QUARKS(blue)and SM17(green;Sánchez-Monge et al.2017).For reference,the corresponding mass estimate as the first order of approximation(Section 4.1)is displayed at the top axis of the upper and middle panels.Lower:Comparison between the core fluxes measured by QUARKS and SM17.The orange line represents y=x.Note that QUARKS detected more fragmented cores than SM17 because of better angular resolution and sensitivity (Section 4.1). First, we manually identify the cores and core-like substructures in the continuum map using the image viewer CARTA.24https://cartavis.org/The criteria of a core are (1) it should have peak intensity larger than 5σ;(2)it is isolated or the major part of its emission region should not merge into its neighboring cores.In total, 97 cores were recognized.We then fitted these cores using 2D Gaussian functions,using the optimization algorithm provided by the Python package, lmfit.25https://pypi.org/project/lmfit/The catalog of the cores, including the position, FWHMs of the major (Lmaj) and minor (Lmin) axes, position angle (PA), peak intensity (Ipeak),and integrated flux are listed in Table A2.The 1.3 mm observation of Sánchez-Monge et al.(2017) revealed 27 cores in Sgr B2(M), which are marked by the black crosses in panel(b)of Figure 4.We crosschecked the two core catalogs,and the results are listed in the last column of Table A2.All the cores of Sánchez-Monge et al.(2017)can be identified in the QUARKS continuum image.The QUARKS survey has better angular resolution and continuum sensitivity compared with that of Sánchez-Monge et al.(2017),and thus our survey is capable of resolving many smaller-scale cores and identifying more weak entities.For example, the cluster of protostars located in the southwest of the central part of Sgr B2(M), which cannot be well resolved by Sánchez-Monge et al.(2017), is revealed in our survey as a collection of grape-like cores.These cores may have evolved from a hub-filamentary structure, but their intrinsic characteristics are to be further explored. Figure 7.The QUARKS spectra of core 6, the line-richest core among those in Figure 5.The gray-shaded regions mark the strong lines showing absorption.The species of strong emission line or group of lines are labeled in green.Each of the labeled line groups is assigned to one species that dominates the spectral emission within the corresponding frequency range.The velocity (VLSR) of core 6 is 67 km s-1. The fluxes of the cores identified in the QUARKS continuum image range from 5 mJy to 1 Jy.Assuming a uniform dust temperature of 100 K(the typical value of Sgr B2(M)by M?ller et al.2023)and a gas-to-dust mass ratio of 100,this corresponds to a mass range of approximately 1–100 M☉.For the brightest two cores(i.e.,Cores 1 and 2 having Ipeak?0.5 Jy beam-1),the optically thin assumption could underestimate the core mass.For the remaining cores, their peak fluxes correspond to peak brightness temperatures lower than 100 K, suggesting that their mass estimate could not be severely affected by that assumption.The total mass of the cores in Sgr B2(M)is 2800 M☉,yielding a mean mass of 30 M☉, much lower than the value of Sánchez-Monge et al.(2017)which is 150 M☉.This is expected since the QUARKS survey can probe smaller fragmented scales of Sgr B2(M)due to higher sensitivity.The high-mass(>5 M☉)end of the core mass function (CMF) show a power-law distribution(dN dlog (m) ∝m-α) with a power index of 0.8±0.1(Figure 6), implying a top-heavy shape as compared to the canonical initial mass function (Bastian et al.2010; Sanhueza et al.2019;Motte et al.2022).The brightest cores may be even more massive if taking into account the effects of optical depths(Sánchez-Monge et al.2017),which would result in a more topheavy CMF.The kink in the high mass end result from the interference of dust shells of ionized regions(e.g.,Cores 92 and 93 in Figure 5),which are extended and thus have relative large fluxes.The emission of the shells at 1.3 mm is probably highly contaminated by free–free ionized gas emission (Sánchez-Monge et al.2017).The CMF of Sgr B2(M) is similar to that of Sgr B1-off, the mass range and power index of which are 0.3–230 M☉and 0.83±0.21,respectively(Lu et al.2020).Note that Sgr B1-off is less evolved than Sgr B2(M), and a dust temperature of 20 K was adopted by Lu et al.(2020).These results may imply that the evolutionary tracks of the two regions may be regulated by some shared parameters of the environments, although the varying dust temperatures provide challenges for precisely deriving the core masses.On the other hand,the similarity of the CMFs between Sgr B2(M) and other highmass star-forming regions (with α<1;e.g., Cheng et al.2018;Lu et al.2020;Pouteau et al.2023)implies that the QUARKS is sensitive enough to find out most of the high-mass cores in Sgr B2(M).The core density of Sgr B2(M) is then derived to be~100 pc-2.This value is much higher than the value(19 pc-2)of the mini-starburst ridges of W43(Pouteau et al.2022,2023),implying stronger mini-starburst activities in Sgr B2(M)compared with the W43 mini-starburst region, an analog of a forming super star cluster (Bally et al.2010). Figure 8.Left: The intensity map integrated from 220.52 to 220.7 GHz, which contains a line group of CH3CN as shown in Figure 7.Right: The intensity map integrated from 233.24 to 233.85 GHz, which contains a line group of NH2CHO.In each panel, the red contour is for the intensity map with a level of 2 Jy beam-1 MHz, and the orange crosses mark the continuum cores of this work. Among the 97 cores, core 6 has the richest spectral line features(Figure 7).The spectra of core 6 are shown in Figure 7 as a gallery of the spectral lines that can be detected in the four SPWs of the QUARKS survey.Note that the spectra of core 6 do not contain all transitions that can be detected by the QUARKS survey.Some important lines listed in Table 2 cannot be seen in the spectra of core 6.For example,no broad(ΔV>20 km s-1) line feature contributed by H30α was detected.A weak and narrow (ΔV ~6 km s-1) line feature can be seen at a frequency close to that of H30α, and this line feature can be assigned to a transition of33SO2through LTE fitting as described in Liu et al.(2022d).It implies that core 6 is a “pure” hot core and does not harbor a UC H II region that is detectable by the QUARKS survey based on the data of H30α.The emission of N2D+,a cold gas tracer,is also not detected in core 6, a COM-rich hot core. We integrated the line groups of CH3CN from 220.52 to 220.7 GHz and NH2CHO from 233.24 to 233.85 GHz (see Figure 7), and the integrated intensity maps of the two line groups of Sgr B2(M) are shown in Figure 8.CH3CN and NH2CHO are both COM species,and the two line groups trace COM-rich hot gas.The emission of the two line groups is concentrated on a similar region,the central part of Sgr B2(M)with a size of ~8″ (0.3 pc).Therefore, the central part of Sgr B2(M)can be treated as a single“big hot core”.The molecular gas inside and among individual dense cores within this “big hot core”is all COM-rich hot gas.The line group of NH2CHO is more centrally peaked than that of CH3CN, implying different excitation states or chemical segregation within the“big hot core.” The integrated intensity of the two line groups show another peak around core 41,which is more like a normal hot core heated by the massive protostars within it. More than half of the continuum cores are not located within the COM-rich emission regions(Figure 8).Those cores can be divided into three types according to their spectral features,including(1) line-poor cores with no emission lines other than the strong lines of common species such as CO and13CS, (2)cores associated with H II regions showing strong emission of H30α, and (3) sulfur-rich cores with very strong emission of sulfur-bearing species such as SO, SO2, and their isotopologues. We show the spectra of cores 60, 93, and 84 in Figure 9 as examples of types 1, 2, and 3, respectively.Core 60 of this work is one of the 27 cores identified by Sánchez-Monge et al.(2017) in Sgr B2(M).Sánchez-Monge et al.(2017) treated all those 27 cores as hot cores.However,some of these cores,such as their core A23(core 60 in this work),exhibit a deficiency in spectral lines.The dust temperatures of these 27 cores of Sánchez-Monge et al.(2017) span a range of 46–162 K, as reported by M?ller et al.(2023), with core A23 having a dust temperature of 72±38.Considering the diversity of dust temperatures,we classify cores with COM-rich line features as hot cores,specifically those enclosed within the red contours in Figure 8.The sulfur-rich cores also tend to have high temperatures but are mainly located on the faint north arc(Figure 5), with a very different spatial distribution compared with other gas components of Sgr B2(M)(X.Liu et al.2023,in preparation). Some scientific objectives(such as fragmentation,core mass function, astro-chemistry) of the QUARKS survey have been briefly mentioned above (Section 4), through looking at an exemplar source, the Sgr B2(M).There are, however, more science topics that can be addressed by the QUARKS survey data but have not been fully discussed, as discussed below. Hunting for massive starless cores is an important topic of this project.Whether or not massive starless cores exist serves as a key discriminator between star formation theories,but still in dispute (e.g., McKee & Tan 2003; Bonnell et al.2004;Heitsch et al.2008).However, hunting for high-mass starless cores has proven to be very challenging, and only a few promising candidates have been reported (e.g., Cyganowski et al.2014; Wang et al.2014; Kong et al.2017).Most of the efforts in the search for massive starless cores have been focused on the early stages of massive clumps (e.g., infrared dark clouds).However, observations indicated that gas accretion inside protoclusters (e.g., through hub-filamentary structures) would continue before being destroyed by stellar feedback(e.g.,Sanhueza et al.2021;Zhou et al.2022;Xu et al.2023a).Several numerical simulations suggest that thermal feedback from OB protostars and the strong magnetic field of proto-stellar clusters can play a crucial role in reducing the level of fragmentation and producing massive dense cores(e.g.,Krumholz et al.2007; Offner et al.2009; Myers et al.2013).Thus, it is possible that the newly assembled gas within evolving protoclusters could form massive starless cores.During the pioneer exploration of the QUARKS data,we have found a massive starless core candidate in I18507+0121,which shows no emission lines except for the line of N2D+(X.Mai et al.2023,in preparation).The QUARKS survey can provide the high-mass star formation community additional samples of massive pre-stellar cores to explore. How stellar feedback from outflows, H II regions and stellar winds from formed OB protostars influences the formation of new generation of stars and reshapes gas distribution in clouds is highly debated(e.g.,Krumholz et al.2014;Peters et al.2017;Schneider et al.2020; Zhang et al.2023b; Herrington et al.2023; Pouteau et al.2023).The ATOMS survey studied the impact of UC H II regions(S.Zhang et al.2023,in preparation)on their surrounding molecular gas, but detailed investigation was limited by sensitivity, and resolution.The high resolution of the QUARKS survey could help to study how the feedback of UC H II regions (traced by H30α) influence the surrounding star formation activities,e.g.,the core masses under the impact of H II region on a scale of thousands au.The thermal feedback(e.g., shocks) from the ionized gas of the young H II regions could be reflected in the velocity and temperature distributions over the surrounding dense cores, which could be revealed by molecular transitions such as CH3CN, CH3OH and their isotopologues (Moscadelli et al.2018).The outflow tracers such as12CO J=2-1,13CO J=2-1 and SiO J=5-4 included in the QUARKS survey are very helpful for detecting molecular outflows and investigate the role of outflow feedback in maintaining turbulence(e.g.,Li et al.2020;Baug et al.2021)or heating gas (Wang et al.2012) in gas clumps. For protocluster within 3 kpc, a resolution of better than 1000 au would enable us to search for massive disks(Chen et al.2016) and large-scale (>10,000 au) gas streamers or spiral arms that may feed the disks (Pineda et al.2020; Lee et al.2023) with various gas tracers(e.g., CH3CN, SO). Simulations and recent observational studies revealed timedependent co-evolution between clump and core masses (e.g.,Bonnell et al.2004;Sanhueza et al.2019;Anderson et al.2021;Xu et al.2023a).The QUARKS survey would help to reveal the co-evolution between protoclusters and protostars in different environments.Species such as N2D+, H2CO,CH3CN, and SO2are good tracers of gas temperature ranging from 10?s to hundreds Kelvin, enabling the QUARKS survey to investigate the evolution of cores in different stages and other substructures found inside protoclusters.We expect that the QUARKS survey can help the study of the co-evolution of the multi-scale structures of/within protoclusters, through case studies of typical sources, and, more importantly, through unbiased statistical studies. High-resolution follow-up studies of the discoveries and investigations carried out in the ATOMS survey (Liu et al.2020a) is an important goal of the QUARKS survey.How the protostars in protoclusters accumulate mass and in turn affect their natal clumps and regulate new star formation is an important topic for both projects.The ATOMS survey has revealed ubiquitous filaments as well as filament-hub systems(HFSs) in protoclusters from dense core scales (~0.1 pc) to clump/cloud scales (~1–10 pc), and has found evidences for filamentary accretion at all scales (Zhou et al.2022).The QUARKS survey can be used to check whether HFSs will further fragment down to a scale of 0.01 pc, and can inspect how they feed individual protostars within protoclusters.The QUARKS survey could also be used to establish the sample of hot cores.The ATOMS survey found 60 hot cores,contributing so far the largest uniform sample of hot cores observed with similar angular resolution and spectral coverage (Qin et al.2022).The QUARKS survey, with much higher resolution,will resolve these hot cores, and help to statistically study the chemical diversities of COMs and the evolution of hot cores. Some large programs of ALMA, e.g., the ALMA-IMF(Motte et al.2022)and ALMAGAL(PI:Sergio Molinari),have science goals similar to or overlapping with that of the QUARKS survey.Compared with those programs, the QUARKS survey has some unique advantages.The ALMAIMF observed 15 extreme (Mclump>2500 M☉) and nearby(2–5.5 kpc)protoclusters in mosaic mode at a spatial resolution of ~2000 au, aiming to make breakthroughs in studying the origin of the initial mass function (IMF) of stars.The single pointing mode of the QUARKS survey enables to generate quickly observe a relatively larger (139) and unbiased(Section 2.1) sample of protoculsters.Guided by the observations of the ATOMS survey in Band 3 (Liu et al.2020a),QUARKS focuses on the dense kernels of the protoclusters that harbour majority of the massive protostars.In Sgr B2(M),only 5 compact cores were detected by the ATOMS survey,and the number by the QUARKS survey is more than 15 times that value.In the weak-continuum source,IRAS 08 448-4343,more than 20 dense cores have been revealed by the QUARKS survey(Figure 3).The ATOMS survey identified 453 compact cores, and it is reasonable to expect that the QUARKS survey would detect at least 10 dense cores for each source on average and 1500 ones in total.The total bandwidth (7.5 GHz) of the QUARKS survey is twice the total bandwidth (3.75 GHz) of the ALMA-IMF.The wide bandwidth makes the QUARKS survey ideal for studying the chemical properties of individual protostars and of the protoculster as a whole,e.g.,investigating the chemical differentiation between O- and N-bearing COMs(e.g.,Wyrowski et al.1999;Peng et al.2022;Qin et al.2022),and exploring the formation mechanisms for individual complex organic molecules (e.g., CH3COCH3and CH3CHO).The QUARKS survey can help to statistically study the properties of protostars in an unbiased sample of protoclusters,and thus fully investigate the CMF at the high-mass end in widely different Galactic environments and at different evolutionary stages, bined by distances and protocluster properties. ALMAGAL observed more than 1000 dense clumps with M>500 M☉and d<7.5 kpc with a linear resolution of~1000 au and a mass sensitivity of 0.3 M☉at 1.3 mm, similar to the QUARKS survey.All the four SPWs of ALMAGAL are located within the frequency range of 216.9–221 GHz,corresponding to the SPWs 1 and 2 of the QUARKS survey.Emission lines of some important species, such as12CO and N2D+,and strong recombination lines(the α lines of hydrogen)were not covered by ALMAGAL.QUARKS covered the transtions of all the three isotologues of carbon monoxide(CO,13CO and C18O),and in combination with the ATOMS survey,we can study the large-scale kinematics and structures up to 1 pc (30″ at a distance of 8 kpc).N2D+is very helpful for searching massive starless cores (Kong et al.2017).Furthermore,the SPW4 of the QUARKS survey is free of strong lines,and it is very useful for searching and studying COMs in hot cores(Figure 7),while recombination lines could help identify H II regions. We have presented an overview of the ALMA-QUARKS survey.The survey is observing 139 protoclusters, consisting of 156 pointings with the ALMA at Band 6.These protoclusters were selected as the dense kernels of massive clumps revealed by the ATOMS survey.The primary goal of the QUARKS survey was to investigate the star formation process within protoclusters down to a scale of 1000 au in an unbiased and statistical manner.This paper has outlined the observations and data reduction of the QUARKS survey, and provides a first look at Sgr B2(M).The QUARKS surveys wide bandwidth (7.5 GHz) and high resolution (~0 3) allow us to resolve more compact cores than the ATOMS survey, and detect previously unrevealed fainter filamentary structures.The spectral windows cover transitions of species such as CO, SO,N2D+, SiO, H30α, and many complex organic molecules,tracing gas components with varying temperatures and spatial extents.The unique observing setups of the QUARKS survey offer an opportunity to enhance our understanding of several scientific topics of star formation, including the mass transfer process inside protoclusters by hub-filamentary structures, the existence of massive starless cores, the physical and chemical properties of dense cores within protoclusters, and protocluster feedback.Preliminary analysis toward Sgr B2 (M2) indicates that our data reduction ensures high-quality continuum and spectral line data for realizing these scientific objectives.Specifically, the self-calibration approach can further improve data quality particularly for targeted sources with strong emission. Acknowledgments This work has been supported by the National Key R&D Program of China(No.2022YFA1603100),the National Natural Science Foundation of China (NSFC) through grants Nos.12 203 086,12 033 005,12 073 061,12 122 307,and 12 103 045.Moreover, X.L.has also been supported by CPSF No.2022M723278; T.L by the international partnership program of Chinese Academy of Sciences through grant No.114231K YSB20200009, Shanghai Pujiang Program 20PJ1415500, the science research grants from the China Manned Space Project with no.CMS-CSST-2021-B06; H.L.by Yunnan Fundamental Research Project (grant No.202 301AT070118).This research was carried out in part at the Jet Propulsion Laboratory,which is operated by the California Institute of Technology under a contract with the National Aeronautics and Space Administration(80NM0018D0004).This work has been sponsored by Natural Science Foundation of Shanghai (No.23ZR1482100).X.L.acknowledges support from the National Natural Science Foundation of China (NSFC) through grants Nos.12 273 090& 12 322 305, and the Chinese Academy of Sciences (CAS)‘Light of West China’ Program (No.xbzgzdsys-202212).A.S.,G.G., L.B., and D.M.acknowledge support from the ANID BASAL project FB210003.A.S.also acknowledges support from the Fondecyt Regular (project code 1 220 610).P.S.was partially supported by a Grant-in-Aid for Scientific Research(KAKENHI Number JP22H01271 and JP23H01221)of JSPS.K.T.was supported by JSPS KAKENHI(grant No.JP20H05645).This work is sponsored (in part) by the Chinese Academy of Sciences (CAS), through a grant to the CAS South America Center for Astronomy (CASSACA) in Santiago, Chile.This paper makes use of the following ALMA data: ADS/JAO.ALMA#2019.1.00685.S, 2021.1.00095.S and 2023.1.00425.ALMA is a partnership of ESO(representing its member states),NSF (USA) and NINS (Japan), together with NRC (Canada),MOST and ASIAA (Taiwan, China), and KASI (Republic of Korea), in cooperation with the Republic of Chile.The Joint ALMA Observatory is operated by ESO, AUI/NRAO and NAOJ.We show warm thanks to the anonymous referee for providing helpful comments for improving the paper. Appendix Source Catalogue Table A1 lists all the observed targets of the QUARKS survey, including the target names, coordinates, velocity(VLSR), and distance (D).For velocity and distance, both of the values adopted by the ATOMS survey (marked by a superscript of “old”) and the QUARKS survey (marked by a superscript of “new”) are listed.Table A2 lists the continuum cores of Sgr B2(M) revealed by the QUARKS survey. Table A1 The Targets of the QUARKS Surveya Table A1(Continued) Table A1(Continued) Table A2 The Continuum Cores in Sgr B2(M) Detected by the QUARKS Surveya Table A2(Continued) ORCID iDs Xunchuan Liu (劉訓川) https://orcid.org/0000-0001-8315-4248 Xing Lu https://orcid.org/0000-0003-2619-9305 Anandmayee Tej https://orcid.org/0000-0001-5917-5751 Ken’ichi Tatematsu https://orcid.org/0000-0002-8149-8546 Qizhou Zhang https://orcid.org/0000-0003-2384-6589 Qilao Gu https://orcid.org/0000-0002-2826-1902 Anindya Saha https://orcid.org/0000-0002-9793-30392.2.Re-evaluation of Sample Distance
2.3.ALMA Observations
3.Data Reduction
3.1.Flagging of Emission Line Channels
3.2.Imaging and Self-calibration of Continuum Data
3.3.Spectral Cube
4.A First Look at Sgr B2(M)
4.1.Mini-starburst in the Protocluster Sgr B2(M)
4.2.COM-rich Hot Cores in Sgr B2(M)
5.Scientific Objectives of the QUARKS Survey
6.Link to Other ALMA Large Survey Programs
7.Summary


 Research in Astronomy and Astrophysics2024年2期
- Research in Astronomy and Astrophysics的其它文章
- A Fermi-LAT Study of Globular Cluster Dynamical Evolution in the Milky Way: Millisecond Pulsars as the Probe
- Application of Regularization Methods in the Sky Map Reconstruction of the Tianlai Cylinder Pathfinder Array
- Effect of Cosmic Plasma on the Observation of Supernovae Ia
- Variable Stars in the 50BiN Open Cluster Survey.III.NGC 884
- Free Energy of Anisotropic Strangeon Stars
- Data-driven Simulations of Magnetic Field Evolution in Active Region 11429:Magneto-frictional Method Using PENCIL CODE