
Period–Luminosity Relationship for δ Scuti Stars Revisited
2024-03-22 04:11AtilaPoroJavadJafarzadehRoghayeHarzandjadidiMohammadMadaniElnazBozorgzadehEsfandiarJahangiriAhmadSarostadAilarAlizadehsabeghMaryamHadizadehandMohammadEsmaeiliVakilabadi
Atila Poro , S.Javad Jafarzadeh , Roghaye Harzandjadidi , Mohammad Madani , Elnaz Bozorgzadeh ,Esfandiar Jahangiri , Ahmad Sarostad , Ailar Alizadehsabegh , Maryam Hadizadeh , and Mohammad EsmaeiliVakilabadi
1 The Raderon AI Laboratory, Astronomy Department, Burnaby, BC, Canada; poroatila@gmail.com
2 Department of Physics, University of Texas at Dallas, 800 W.Campbell Rd., Richardson, TX 75080, USA
3 Department of Theoretical Physics and Astrophysics, University of Zanjan, Zanjan, Iran
4 Independent researcher, Tehran, Iran
5 Department of Electronics and Telecommunications, Politecnico Di Torino, Turin, Italy
6 Independent researcher, Isfahan, Iran
7 Yazd Desert Night Sky Astronomy Institute, Yazd, Iran
8 Department of Photonics, Tabriz University, Tabriz, Iran
9 Khayyam Astronomy Association, Fars, Fasa, Iran
Abstract The Gaia DR3 parallax approach was used to estimate the absolute parameters of 2375 δ Scuti stars from the ASAS catalog.The selected stars have a variety of observational characteristics, with a higher than 80% probability of being δ Scuti stars.We have displayed all the stars in the Hertzsprung–Russell diagram along with the δ Scuti instability strip,the Zero Age Main Sequence and the Terminal Age Main Sequence.Then,we determined which fundamental and overtone modes each star belongs to using pulsation constant (Q) calculations.In addition, we evaluated the parameters in the Q calculation equation using three machine learning methods, which showed that surface gravity and temperature have the greatest effect on its calculation.The Period–Luminosity (P-L)relationship of the δ Scuti stars was also revisited.Eventually,using least squares linear regression,we made four linear fits for fundamental and overtone modes and updated their relationships.
Key words: stars: variables: delta Scuti – stars: fundamental parameters – methods: data analysis
1.Introduction
δ Scuti stars are a sort of variable star with a pulsation period range of 0.02–0.25 day that are mainly located in the lower part of the Cepheid instability strip along with SX Phe variables,which are mostly in the main sequence of a star’s life.Their spectral type ranges from A to F (McNamara 2000).The two main groups of δ Scuti stars are the High Amplitude δ Scuti Stars (HADS) and the Low Amplitude δ Scuti Stars (LADS).HADS are distinguished by their amplitude variations in brightness higher than 0.3 mag (Jafarzadeh & Poro 2017); and LADS are known for having brightness amplitude variations less than 0.1 mag in V-band (Rodríguez et al.1996).
One of the fundamental properties of pulsating variable stars is the Period–Luminosity (P–L) relationship, as it was mentioned for the first time by Leavitt & Pickering (1912).The first P–L relation for δ Scuti stars was determined due to the stars’ compliance with the same P–L relation as Cepheids.In order to improve the P–L relationship and be used as standard candles, Fernie (1992) examined combining a few Cepheids and δ Scuti stars.In the following decades, other studies made an effort to improve the P–L relationship for δ Scuti stars, such as Laney et al.(2002), McNamara et al.(2004, 2007), McNamara (2011), Ziaali et al.(2019),Jayasinghe et al.(2020), Poro et al.(2021), Barac et al.(2022), and Martínez-Vázquez et al.(2022).
In this work, we aim to update the four relations for fundamental and three overtone modes with a large sample whose absolute parameters were estimated through one method.This paper is structured as follows:Section 2 introduces the data set used in this study; Section 3 describes how to calculate the absolute parameters of the stars; Section 4 discusses pulsation modes and pulsation constants;Section 5 focuses on the update of the P–L relationships; and Section 6 is the conclusion.
2.Dataset
The δ Scuti stars, which were used as samples in this study,are from the All Sky Automated Survey(ASAS)catalog.These stars are classified as δ Scuti stars in the ASAS catalog, with a probability exceeding 80%.Consequently, a total of 2375 δ Scuti stars form the basis of this sample.The periods of these stars in the ASAS catalog are between 0.031 and 0.199 day,while their apparent magnitudes span from 10.14 to 15.57.
Considering that Gaia’s parallax was used in this study to estimate the absolute parameters,we checked the Re-normalized Unit Weight Error (RUWE) from Gaia Data Release 3 (DR3)10https://gea.esac.esa.int/archive/for these stars.All of the stars were in the appropriate range and below 1.4 (Lindegren et al.2018).
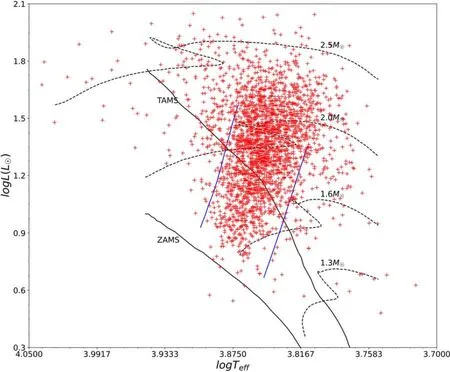
Figure 1.Location of 2375 stars on the H-R diagram.A Monte Carlo process was employed to evaluate the parameters’ average uncertainty.
3.Absolute Parameter Estimation
The Gaia parallax method was utilized to estimate the absolute parameters of these stars (Poro et al.2021).First, we calculated the absolute magnitudes of the stars using the apparent magnitude (V) from the ASAS catalog, the distance in parsec units(d)from Gaia DR3 and the extinction coefficient(AV)using the dust-maps Python package of Green et al.(2019).Then, the bolometric correction (BC) from Flower (1996)?s study, as corrected by Torres(2010),was applied to derive the bolometric absolute magnitude(Mbol)for each star.Using Pogson’s relation(Pogson 1856), we computed the luminosity (L).The temperature (T) reported by Transiting Exoplanet Survey Satellite(TESS) results for these stars allowed us to calculate the radius(R) using T and L.Additionally, we determined the mass (M)based on the relationship presented in Cox(2015).We estimated the surface gravity on a logarithmic scale log(g) using M and R parameters, which were in good agreement with the surface gravity provided by TESS for each star.The relations used in the order mentioned in the text are as follows:
We placed all sample stars on the Hertzsprung–Russell(H-R) diagram based on the estimated luminosity in this study and TESS temperature (Figure 1).The H-R diagram displayed the instability strip of the δ Scuti stars (Dupret et al.2005;Murphy et al.2019), the evolutionary paths of the stars(Kahraman Ali?avu? et al.2016),as well as the Zero Age Main Sequence(ZAMS)and Terminal Age Main Sequence(TAMS).As shown in Figure 1, the stars are distributed across most of the δ Scuti stars’ region.
4.Pulsation Modes
There are two categories of δ Scuti stars: radial and nonradial.The pulsation mode is classified as radial if the star maintains its spherical shape during pulsation; otherwise, the pulsing is non-radial.Additionally, pulsation modes are distinguished in terms of the quantum numbers (n, l and m)that identify the star’s geometry,where n is the radial order,l is the angular degree and m is the azimuthal value(Bowman 2017;Poro et al.2021).
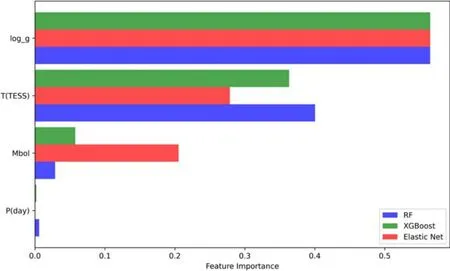
Figure 2.Histogram of measuring the importance of four parameters in the Q relation using three machine learning methods.
The modes’ pressure (p) and gravity (g) describe the two different pulsation types identified in the δ Scuti stars.In the pmode, pressure acts as a restoring force by sound waves with vertical movements for a star that has lost its equilibrium condition, and in the g-mode, gravity functions as a restoring force with horizontal movements for the star (Joshi &Joshi 2015).Identifying the p-mode order is necessary for studying the interior structure of δ Scuti stars.The pulsation constant is a crucial variable in this process.
The theoretical predictions for Q were first made by Cox et al.(1972) and Fitch (1981).Comparing measured periods to theoretically expected Q values allows us to pinpoint certain radial and non-radial pulsation modes.These periods relate to the time a sound wave takes to travel from the star’s center to its surface, expressed as, known as the dynamic timescale(Aerts et al.2010).The pulsation constant Q is defined as
where P is period of pulsation in days,andρˉ is the mean stellar density.Therefore, the pulsation modes in δ Scuti stars correspond to specific Q values.According to Breger (1990)and Poro et al.(2021), Q can be calculated by
The calculation of the Q value greatly depends on the stellar parameters.Due to this dependence, Q values may have a fractional uncertainty of up to 18%(Breger 1990).The internal structure and evolution of δ Scuti stars can be studied using the Q value, although doing so requires precise measurements and careful interpretation.
The Q value for the sample stars was determined using Equation(8).Then,we made an effort to evaluate Equation(8)?s four parameters(P,Mbol,T and log(g))in terms of how they would impact the determination of Q.It should be noted that we used the value of temperature from TESS, the period from ASAS and the values of bolometric absolute magnitude and surface gravity from the estimations of this study.
We leveraged various methods, including Random Forest,XGBoost and Elastic Net, to determine the relative importance of features in a machine learning problem.Before applying these techniques,we performed feature scaling on both the dependent variable,denoted as Q,and four independent variables using the StandardScaler.For each model, we conducted a thorough grid search Cross-Validation(CV)to identify the optimal hyperparameters that yield the highest accuracy.Subsequently, we fitted each model with these selected hyperparameters.Finally, we visualized the feature importance rankings.Since different models may provide results on varying scales, and our primary concern lies in the relative importance of these features, we standardized the value of the most crucial feature across all models.This standardization allows for a more straightforward comparison.Analyzing the results in Figure 2, we observe a consistent feature ranking across all models.Notably, log(g), T,Mboland P are consistently listed in descending order of importance across the models.
5.Updated P–L Relationship
To find the P–L relationship for each of the three overtones and the fundamental, it is essential to categorize each star into its respective group.So, we utilized the histogram of the distribution of our calculated Qs for all stars, as illustrated in Figure 3.In this histogram, dashed lines represent the fundamental and three overtones, as detailed in Figure 3 in North et al.(1997).Except for the second overtone, which corresponds to a local minimum, the remaining three (two overtones and the fundamental) correspond to local maxima.The specific range of each group is outlined below
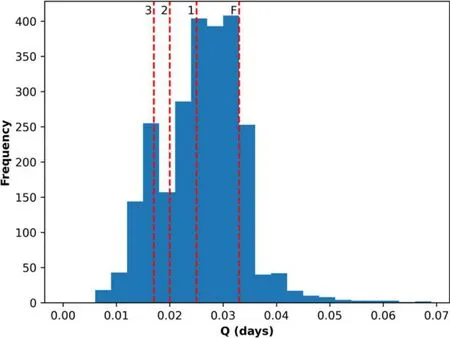
Figure 3.Histogram of the calculated Qs.Dashed lines show the fundamental and three overtones, which are consistent with North et al.(1997).
After finding the regions of Q,each star can be visualized in a two-dimensional(2D)histogram based on its MVand logP as in Figure 4.In this histogram, fundamental, first, second and third overtone stars are represented by black, blue, red and green dots, respectively.Their population is visualized using a gray color map, with 35 bins and a peak near MV=1.25 and logP= -0.9.We applied least squares linear regression to fit the best line to each of these four groups represented by the same color as the data points in Figure 4.Moreover, the fitted P–L relations from previous studies for the fundamental are presented as a blue dashed line for Poro et al.(2021), orange dashed line for Jayasinghe et al.(2020), green dotted line for Ziaali et al.(2019) and red dash–dotted line for McNamara(2011).The updated P–L relations for all four modes are as follows:
Fundamental:
First overtone:
Second overtone:
Third overtone:
Finally, we proceeded to compute the residuals by comparing our data points with the corresponding fitted equations.To enhance the interpretability of these residuals, we standardized them,setting their mean to zero and their standard deviation to one.The result for three overtones and the fundamental is shown in Figure 5.
6.Conclusion
Using Gaia DR3 parallax values, some catalogs and databases, we calculated the physical parameters of 2375 δ Scuti stars.Stars with a high probability of being this type of pulsating star were selected.Given the period interval of less than 0.2 day for the stars, this is the largest sample for δ Scuti stars.The results obtained for the log(g) parameter show good agreement with the TESS findings.
The positions of the stars in the H-R diagram are displayed in Figure 1.A large number of stars are between the two theoretical lines of the δ Scuti star range.It is worth mentioning that Uytterhoeven et al.(2011)revealed that some δ Scuti stars could be found outside their instability strip.However, it should be considered that most of the stars outside the δ Scuti instability strip might be hybrid objects.
We then examined the pulsation modes of the stars.Also,we employed different machine learning methods to assess the impact of the parameters involved in the Q constant.This investigation revealed that Q was least affected by the pulsation period in all three machine learning methods,which is probably due to the short interval of period changes in most δ Scuti stars.
We revised the P–L relationship in this work.To do this,we estimated Q, which differed marginally from the North et al.(1997) study (Figure 3).Then, we separated the stars in terms of the first, second and third overtones as well as the fundamental mode.For them, a linear fit was the best choice.So, four updated relationships with the sample from this study were presented (Equations (10)–(13)).
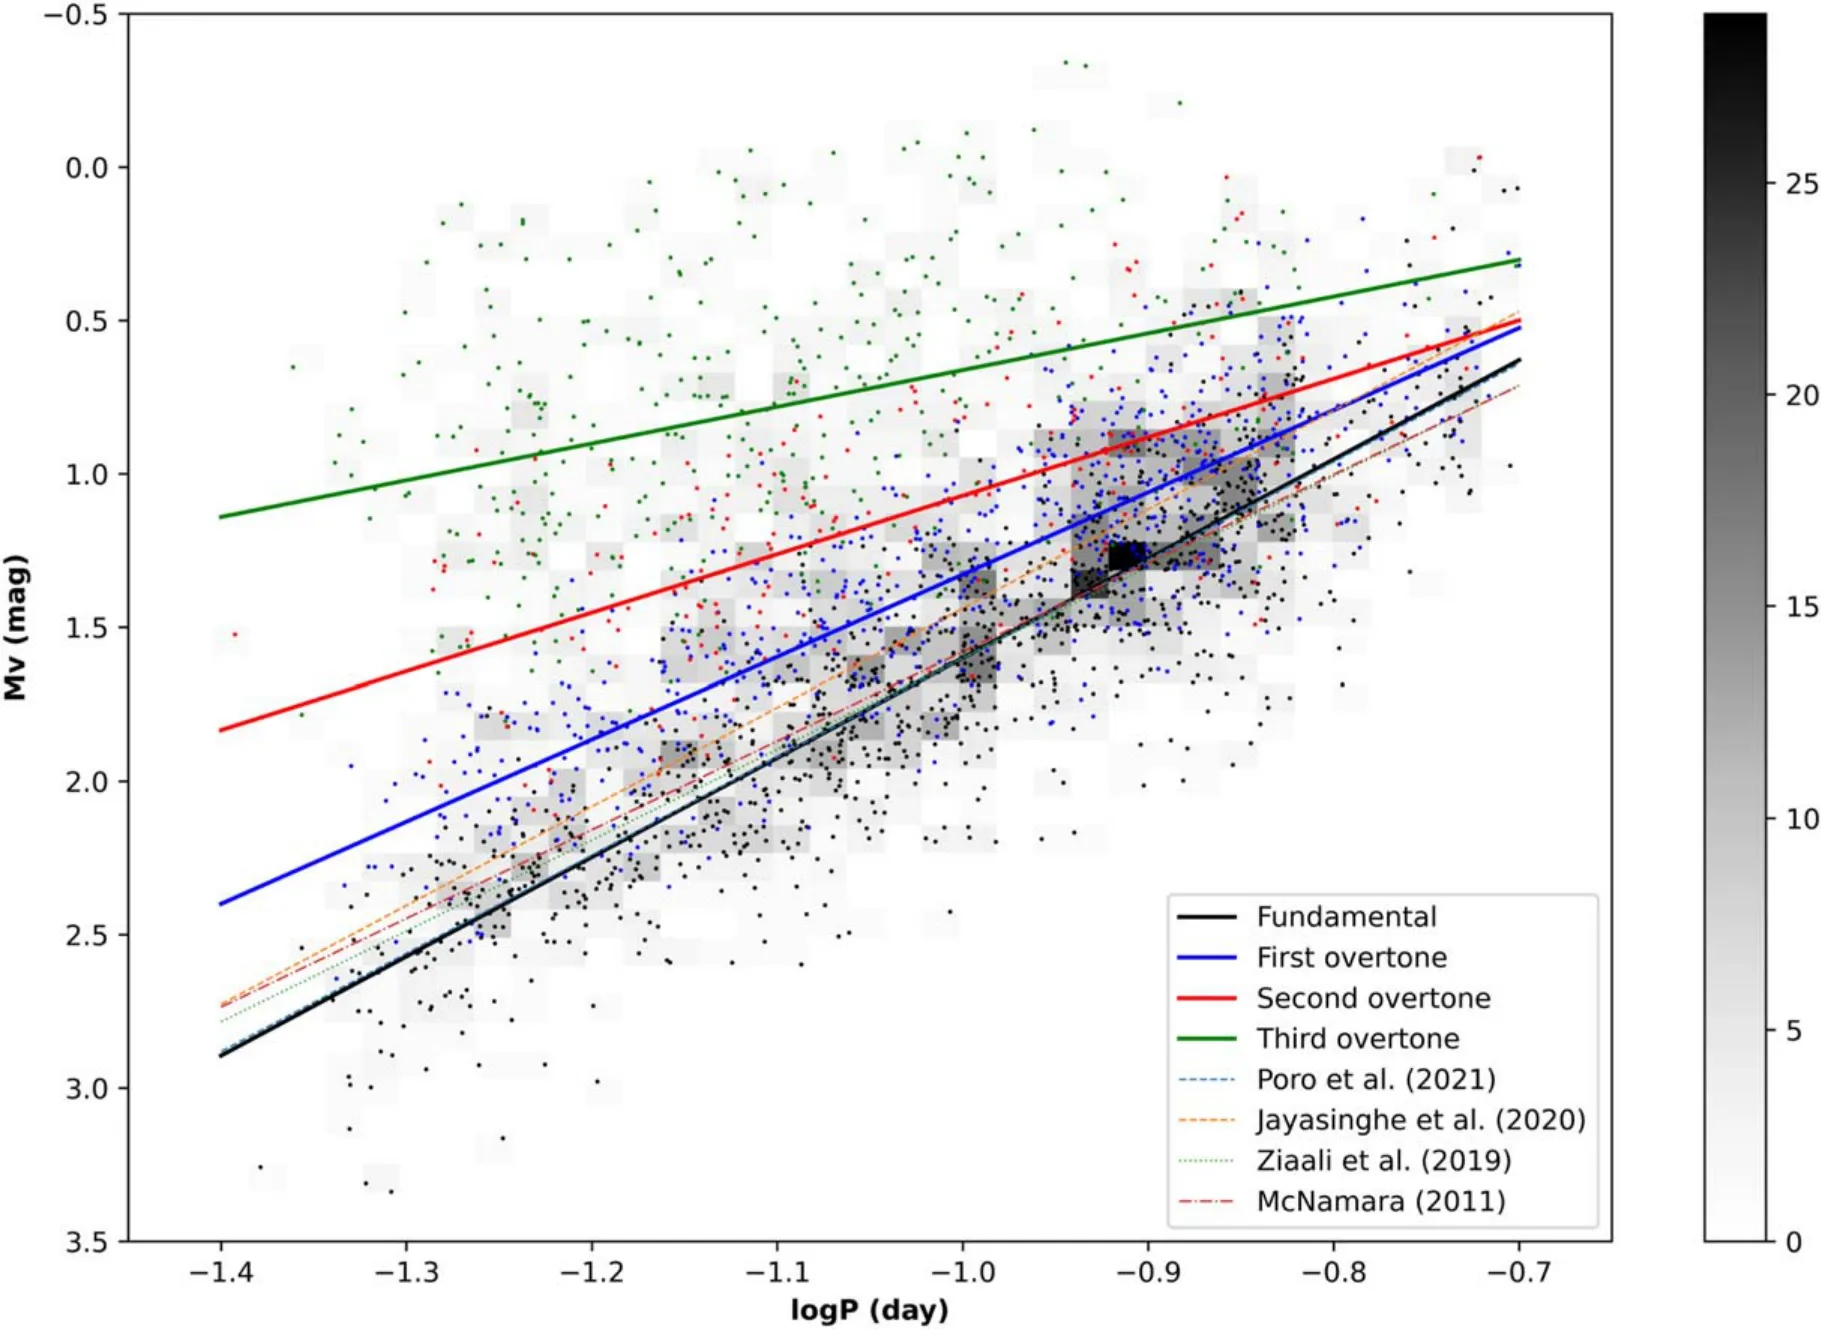
Figure 4.2D histogram of(logP - MV)and fitted lines of(P–L)relations for the studied δ Scuti stars in this paper.The fitted lines of the four previous studies for the fundamental mode are included for reference.
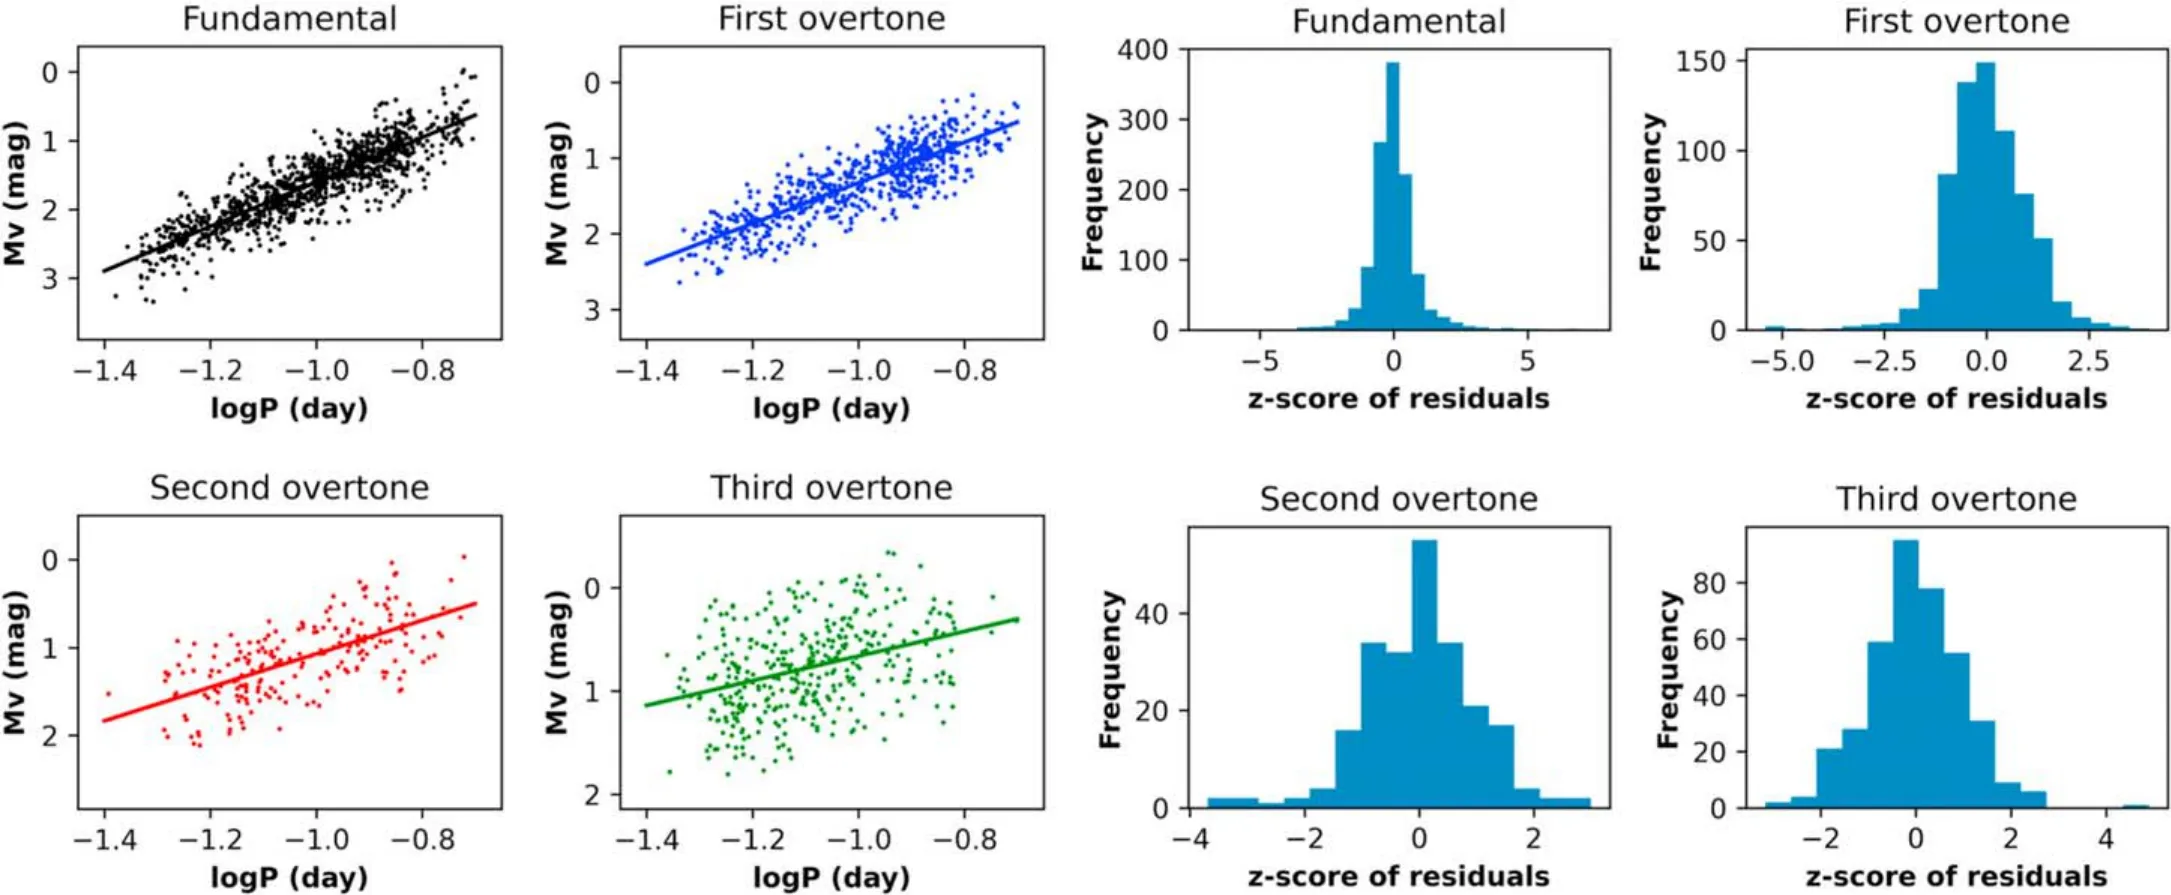
Figure 5.Left: Separate linear fits on the fundamental and three overtones.Right: Four histograms of residuals of fitted Equations (10)–(13).
Comparing the results to Poro et al.(2021),we realized that,while this study encompasses a significantly larger sample,our findings were consistent with theirs, updating the relations to greater accuracy.Although the updated fundamental equation remains almost the same as in Poro et al.(2021), we notice a slightly greater change in overtones.The reason for that could be that in Poro et al.(2021)?s study, according to the total number of 520 stars, their number of overtones was much less and more scattered than in fundamental.
Comparing these results to those in Poro et al.(2021), we observe that, despite this study encompassing a significantly larger data set of δ Scuti stars, our findings align consistently with theirs, updating the relations to greater accuracy.While the updated fundamental equation remains almost the same as in Poro et al.(2021), we notice a slightly more pronounced change in overtones.This difference may stem from the fact that, in Poro et al.(2021)?s study, where a total of 520 stars were examined, the number of stars in overtones was considerably fewer and more scattered compared to the fundamental mode.This disparity could have influenced the precision of their results.
We also utilized machine learning methods to assess the suitability of the nonlinear fit (Poro et al.2024).The evaluation,based on Root Mean Square Error(RMSE)values,indicated that the linear fit emerged as the best-fitting model.This is a significant issue because a recent study by Martínez-Vázquez et al.(2022)discovered nonlinear behavior for about 3700 δ Scuti stars from extragalactic systems within the P–L relationship.However,according to the 2375 stars examined in this study, the P-L relationship for Milky Way δ Scuti stars can still be adequately described by a linear fit.
Acknowledgments
This investigation has made use of data from the European Space Agency mission Gaia(http://www.cosmos.esa.int/gaia),processed by the Gaia Data Processing and Analysis Consortium(DPAC, http://www.cosmos.esa.int/web/gaia/dpac/consortium).We express our gratitude to Dr.Filiz Kahraman Ali?avu for providing scientific and effective comments.
Data Availability
All estimates of the physical parameters of the 2375 δ Scuti stars are included in the online version of this study.
ORCID iDs
Atila Poro https://orcid.org/0000-0002-0196-9732
S.Javad Jafarzadeh https://orcid.org/0000-0002-9490-2093
Roghaye Harzandjadidi https://orcid.org/0000-0002-1836-0958
Mohammad Madani https://orcid.org/0000-0003-4705-923X
Elnaz Bozorgzadeh https://orcid.org/0009-0009-7143-263X
Esfandiar Jahangiri https://orcid.org/0000-0002-1576-798X
Ahmad Sarostad https://orcid.org/0000-0001-6485-8696
Ailar Alizadehsabegh https://orcid.org/0000-0001-5768-0340
Maryam Hadizadeh https://orcid.org/0000-0003-1493-0295
Mohammad EsmaeiliVakilabadi https://orcid.org/0009-0004-9852-8002
 Research in Astronomy and Astrophysics2024年2期
- Research in Astronomy and Astrophysics的其它文章
- A Fermi-LAT Study of Globular Cluster Dynamical Evolution in the Milky Way: Millisecond Pulsars as the Probe
- Application of Regularization Methods in the Sky Map Reconstruction of the Tianlai Cylinder Pathfinder Array
- Effect of Cosmic Plasma on the Observation of Supernovae Ia
- Variable Stars in the 50BiN Open Cluster Survey.III.NGC 884
- Free Energy of Anisotropic Strangeon Stars
- Data-driven Simulations of Magnetic Field Evolution in Active Region 11429:Magneto-frictional Method Using PENCIL CODE