
Single-cell mass spectrometry studies of drug metabolism heterogeneity and primary resistance to gefitinib in non-small cell lung cancer cells
2024-04-05 02:28GuizhenZhuYoyoZhoWenmeiZhngYunyunWuYunxingLiuGungshengGuoXiynWngZhihongLiu
Chinese Chemical Letters 2024年2期
Guizhen Zhu ,Yoyo Zho,* ,Wenmei Zhng ,Yunyun Wu ,Yunxing Liu ,Gungsheng Guo,b ,Xiyn Wng,Zhihong Liu
a Center of Excellence for Environmental Safety and Biological Effects,Beijing Key Laboratory for Green Catalysis and Separation,Department of Chemistry,Beijing University of Technology,Beijing 100124,China
b Minzu University of China,Beijing 100081,China
c Key Laboratory for the Synthesis and Application of Organic Functional Molecules,College of Health Science and Engineering,Hubei University,Wuhan 430062,China
Keywords: Single-cell mass spectrometry Drug metabolism Non-small cell lung cancer Gefitinib Primary resistance
ABSTRACT Patients with epidermal growth factor receptor (EGFR) wild-type non-small cell lung cancer (NSCLC) often show primary resistance to gefitinib therapy.It is thus necessary to study the metabolism of gefitinib in NSCLC cells to comprehensively reveal the reasons for the primary resistance of tumors.Herein,we develop a platform for studying drug metabolism heterogeneity based on single-cell mass spectrometry(sDMH-scMS) by integrating living-cell electrolaunching ionization MS (ILCEI-MS) and high-performance liquid chromatography-MS (HPLC-MS) analysis,and the primary resistance of NSCLC cells to gefitinib was studied using this platform.The ILCEI-MS analysis showed that approximately 11.9% of NSCLC single cells contained the gefitinib metabolite M11;HPLC-MS detection diluted the intensity of M11 in subpopulations and concealed the heterogeneity of drug metabolism in tumor single cells.The intensity of gefitinib in EGFR wild-type A549 cells was markedly lower than in mutant PC9 cells,and the intensity of gefitinib metabolites was significantly higher than in PC9 cells,suggesting that the primary resistance of NSCLC cells is related to gefitinib metabolism.Moreover,the combination of gefitinib and the drug-metabolizing enzyme inhibitor α-naphthoflavone was shown to overcome the primary resistance of the NSCLC cells.Overall,the results of this study are expected to be applicable for clinical drug resistance diagnosis and treatment at the single-cell level.
Gefitinib is an epidermal growth factor receptor tyrosine kinase inhibitor (EGFR-TKI),which has been approved by the US Food and Drug Administration as a first-line targeted drug for the treatment of non-small cell lung cancer (NSCLC) [1,2].Studies have shown that the efficacy of gefitinib is related to the patient’s sex and smoking history of the patient,in addition to the histological type of lung cancer [3].Specific patients,such as non-smokers,those with Asian ethnicity,lung adenocarcinoma patients,and those with female gender are sensitive to gefitinib therapy,and they often show the deletion mutation of exon 19 or substitution mutation of exon 21 of EGFR [4,5].However,it is difficult for patients with EGFR wild-type NSCLC to benefit from treatment with gefitinib,and such patients who have no obvious response to drugs at the initial stage of treatment are considered to exhibit primary resistance [6].Therefore,understanding the reasons for primary resistance in NSCLC patients is the key to further improving the efficacy of gefitinib.
Although great clinical progress has been made in understanding the mechanism of primary resistance to gefitinib in NSCLC patients,much of this progress has been on detecting changes in gene level,such as kirsten rat sarcoma viral oncogene (K-ras) mutation [7],vRAF murine sarcoma viral oncogene homolog B1 (BRAF)mutation [8],and loss of phosphatase and tensin homolog deleted on chromosome ten (PTEN) gene function [9].The sensitivity of NSCLC cells to gefitinib is not only influenced by genes but also related to the metabolism of drugs in tumor cells [10].The decrease in gefitinib content caused by an increase in cytochrome P450 (CYP450) enzyme activity and the overexpression of transporters is considered to be another important mechanism of drug resistance in NSCLC cells [11,12].In addition,gefitinib competitively binds to the adenosine triphosphate (ATP) binding site of the intracellular tyrosine kinase domain of EGFR,thereby inhibiting the phosphorylation activation of EGFR,blocking the transmission of the downstream signal pathway,and inhibiting the proliferation of tumor cells [13].Only gefitinib entering the tumor target cells can bind to the intracellular tyrosine kinase domain of EGFR and exert anticancer effects.Thus,the content and metabolism of gefitinib in NSCLC cells directly affect its anticancer activity.Detecting the absorption and metabolism of gefitinib by tumor target cells is thus helpful in the comprehensive evaluation of the efficacy of the drug and the potential reasons for primary resistance.
At present,high-performance liquid chromatography-mass spectrometry (HPLC-MS) is mainly used to detect gefitinib and its metabolites in cells,tissues,and bodily fluids [14].Using this method,the metabolism of gefitinib ininvitroliver microsome model,the human body,and animals has been studied in depth[15-20].It has been found that gefitinib is rapidly and extensively metabolized in the human liver,mainly by CYP3A4 and CYP2D6,which catalyze the oxidation of its morpholine ring,theO-demethylation of the methoxy group on its quinazoline ring,and the oxidative defluorination of its halogenated phenyl to generate M537194,M523595,and M387783 [15-17,21].The metabolism of gefitinib in NSCLC cells has also been reported [10,14],but its detailed metabolism in all NSCLC cells has not been studied.Due to epigenetic mutation and the influence of their microenvironment,tumor single cells exhibit significant heterogeneity [22-25].Even in the same batch of cell lines,two cell subpopulations with different characteristics can be observed [26].However,HPLC-MS can only obtain the average data of gefitinib metabolism based on cells or tissues.In addition,this method requires a complicated extraction process of drugs and their metabolites in the quantitative study of drug metabolism,which may lead to the loss of intracellular target molecules,especially limiting the detection of drug metabolites with low content [27,28].
Single-cell analysis can reveal the heterogeneity of cells and facilitate a more comprehensive understanding of drug metabolism[29-35].Intact living-cell electrolaunching ionization mass spectrometry (ILCEI-MS) is a new almost undiluted single-cell analysis method developed by our research group,which can be used to detect small molecular compounds in whole single cells [36].In brief,single cells are dispersed in a capillary with a narrow inner diameter (I.D.),enter an ion transport tube in the form of intact single cells,and are broken up for MS detection.ILCEI-MS has been proven to have the advantages of high sensitivity and high throughput for single-cell detection,which makes it possible to analyze the metabolic process of gefitinib in NSCLC cells.
A549 cells have an EGFR wild-type gene and exhibit primary resistance to gefitinib therapy.PC9 cells have an EGFR exon 19 deletion mutation gene and are sensitive to gefitinib treatment[37].In this study,A549 and PC9 cells were used as a model system to construct a platform to study drug metabolism heterogeneity based on single-cell MS (sDMH-scMS),which integrated ILCEI-MS and HPLC-MS analysis.We applied this new platform to study the heterogeneity of gefitinib metabolism in NSCLC cells at the single-cell level and analyze in depth the metabolism of gefitinib in target tumor cells.The difference in gefitinib metabolism in A549 and PC9 cells was investigated to reveal the relationships between the primary resistance of NSCLC cells to gefitinib and drug metabolism.α-Naphthoflavone was used to inhibit gefitinib metabolism in NSCLC cells that exhibit primary resistance,which improved the sensitivity of drug-resistant tumor cells to gefitinib therapy.
Proliferation inhibition curves indicate that gefitinib inhibits NSCLC cell proliferation in a concentration-dependent manner and that the cell viability of A549 cells is higher than that of PC9 cells under various treatment conditions (Figs.S1A-C in Supporting information).Thus,the anticancer activity of gefitinib toward A549 cells is weaker than that of PC9 cells,which might be due to the catalytic metabolism of most drugs in A549 cells and result in a loss in the anticancer effects of gefitinib.To verify this hypothesis,we constructed an sDMH-scMS platform to study the absorption and metabolism of gefitinib in these two types of cells to clarify the relationships between the primary resistance of NSCLC cells to gefitinib and drug metabolism,as shown in Fig.1.First,according to the proliferation inhibition curves,the concentration of gefitinib was selected to treat primary resistant A549 and sensitive PC9 cells.Then,A549 cells were used as the model.After treatment with gefitinib,the intracellular drug and its metabolites were extracted with cold methanol for HPLC-MS analysis.The gefitinib treatment cells were resuspended in ammonium formate aqueous solution and were driven into a capillary with a 16 μm-I.D.by a pneumatic-hydraulic injection device to realize the online dispersion and MS injection of single cells.The cells were injected into the MS inlet from an emitter with constant I.D.for ILCEI-MS analysis.The differences in the gefitinib metabolites detected by ILCEIMS and HPLC-MS in single cells and population cells were compared to analyze the heterogeneity of drug metabolism in NSCLC single cells.Finally,ILCEI-MS was utilized to study the metabolic differences of gefitinib in the two types of cells and reveal the relationships between the primary resistance of NSCLC cells to gefitinib and drug metabolism.
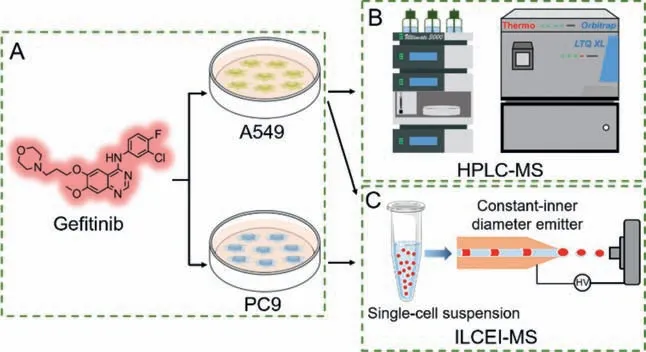
Fig.1.Schematic of sDMH-scMS platform.(A) Treatment of A549 and PC9 cells with gefitinib.(B) Detection of gefitinib metabolites in A549 cells by HPLC-MS.(C)Detection of gefitinib metabolites in A549 and PC9 cells by ILCEI-MS.
A549 cells were used as a model and the metabolism and metabolic pathways of gefitinib in NSCLC cells were studied using HPLC-MS.A549 cells were treated with 20 μmol/L of gefitinib for 24 h,where the cell viability was 59.87% ± 0.39% (Fig.S1D in Supporting information).Ten gefitinib metabolites were detected in the A549 cells,which were numberedM1toM10according to their elution order in the chromatograms.The HPLC-MS2results of gefitinib and its metabolites in A549 cells are shown in Table S1 and Fig.S2 (Supporting information),with the names of the reported metabolites of gefitinib shown in parentheses.The detailed structural analysis can be found in the supporting information.According to the structure of the gefitinib metabolites and information in the literatures [15-17,21],a gefitinib metabolic pathway for A549 cells was proposed (Fig.S3 in Supporting information).The morpholine ring propoxy side chain is the most important site for gefitinib metabolism in A549 cells.TheM1toM10gefitinib metabolites were detected at various treatment times (Fig.S4 in Supporting information).The content of these ten metabolites increased with a prolongation of the treatment time,where gefitinib was mainly metabolized intoM5(M295820) andM7(M608236).
HPLC-MS experiments were conducted to obtain the average data of the gefitinib metabolites,which concealed the drug absorption and metabolism in subpopulations with certain characteristics.Single-cell level research provides full information about the process of drug absorption and metabolism in tumor cells,and reveals the reasons for drug resistance.Therefore,the metabolism of gefitinib in A549 cells was studied at the single-cell level using ILCEI-MS.Taking the lipid peakm/z=760.5851 with the maximal signal as the standard for single-cell detection and screening,265 and 658 single cells were detected in the control group and the 20 μmol/L of gefitinib treatment group,respectively,as shown in Fig.S5 (Supporting information).
As shown in Fig.2A,gefitinib and its main metabolites (M5andM7) were successfully detected in A549 single cells that exhibit primary resistance by ILCEI-MS.In addition,after the mass spectrum peak alignment of single-cell related ions,a gefitinib metabolite-related ion withm/z=447.1446 was detected in the treatment group.Becausem/z=447.1446 was not detected in HPLC-MS analysis and the duration of the mass spectrum peak of a single cell is only around 0.5 s,it is difficult to obtain characteristic fragment ions from MS2analysis to deduce its molecular structure.The detection of a gefitinib metabolite ion has been reported in human liver microsomes withm/z=447.1435 [15],and a relative error ofm/z=447.1446 of only 2.46 ppm.Thus,according to the accuratem/zof the high-resolution MS,the species with a signal atm/z=447.1446 can be attributed to a metabolite of gefitinib,with the structure shown in Fig.2B labeled as numberedM11(molecular formula: C21H24ClN4O5).M11may be produced by theO-dealkylation ofM1(M387783) or by the oxidative defluorination ofM7(M608236) based on its structure (Fig.2B).

Fig.2.(A) Detection of gefitinib and its metabolites by ILCEI-MS in A549 single cells that exhibit primary resistance.(B) Metabolic pathway of gefitinib metabolite M11 in A549 cells.
The reasons why the gefitinib metaboliteM11can only be detected in NSCLC single cells were further analyzed.By counting the number of cells containingM11in the 20 μmol/L of the gefitinib treatment group,it was found thatM11could be detected in only 78 A549 single cells,accounting for 11.9% of the total number of cells (658).The characteristics of the intensities of theM11parent ion peak of 78 of the A549 single cells and the total number of single cells are shown in the box plots in Fig.3.The average intensity of theM11parent ion peak of 78 of the A549 single cells is 3.91×10⁴,while the average intensity in the total cells (corresponding to population cells) is 4.64×10³.Namely,other A549 cells diluted the intensity of theM11parent ion peak of 78 of the single cells.In addition,the volume of organic solvent used to extract gefitinib metabolites from the population cells was much greater than the total cell volume,which further diluted the concentration ofM11.The complex sample preparation process also led to a loss of gefitinib metabolites.Therefore,M11could not be detected in the HPLC-MS experiment,and the almost undiluted single-cell analysis method was used to detect theM11metabolized by a specific NSCLC cell subpopulation,which revealed the heterogeneity of drug metabolism in the tumor single cells.A small number of NSCLC cells containing theM11metabolite may represent a subpopulation with specific characteristics,such as different responses to gefitinib treatment.

Fig.3.Comparison of the M11 parent ion peak intensity of A549 single cells containing M11 and the total single cells.
The above experiments have illustrated that detecting the metabolites of gefitinib at the single-cell level can provide information on drug metabolism heterogeneity and help understand the metabolism of gefitinib in tumor target cells comprehensively.Thus,ILCEI-MS was used to compare the content and metabolism of gefitinib in EGFR wild-type A549 cells and mutant PC9 cells at the single-cell level.
A549 and PC9 cells were treated with 20 μmol/L of gefitinib for 24 h,with the mass spectra of the individual cells detected by ILCEI-MS shown in Fig.S6 (Supporting information) and the parent ion peak intensity of the intracellular gefitinib shown in Fig.4.The relative abundance of gefitinib in A549 cells is lower than that in PC9 cells.In other words,the drug content in A549 cells is lower than that in PC9 cells.The metabolism of gefitinib in the two types of cells is shown in Fig.5A,and the relative abundance ofM11in NSCLC single cells containingM11is shown in Fig.5B.The gefitinib main metabolitesM5(M295820) andM7(M608236)in NSCLC cells andM11,which can only be produced in partial single cells were analyzed.The results showed that the relative abundance of gefitinib metabolitesM5(M295820),M7(M608236),andM11in A549 cells were significantly higher than those in PC9 cells.Thus,the primary resistance of A549 cells to gefitinib is due to the extensive metabolism of the drug,leading to a lower antitumor drug content than that in PC9 cells.

Fig.4.Relative abundance of gefitinib in A549 and PC9 single cells.Relative abundance=(peak intensity/total ion current intensity)×103.*** P <0.001.

Fig.5.Relative abundance of the gefitinib metabolites (A) M5,M7,and (B) M11 in A549 and PC9 single cells.Relative abundance=(peak intensity/total ion current intensity)×105.*** P <0.001.
CYP450 plays a key role in the metabolism of gefitinib,among which the CYP3A4,CYP3A5,and CYP1A1 enzymes catalyze the metabolism of gefitinib to produceM5(M295820) andM7(M608236) [21],as shown in Fig.S7 (Supporting information).CYP1A1,a member of the CYP1 family,mainly exists in extrahepatic tissues and is the major enzyme for the biological activation of gefitinib in human lungs [38].α-Naphthoflavone is a specific inhibitor of the CYP1A enzyme,which can significantly reduce the expression and activity of the CYP1A enzyme at a certain concentration [10].To further verify that the extensive metabolism of intracellular drugs by CYP1A1 is a factor that leads to the primary resistance of A549 cells to gefitinib,the effect of gefitinib andα-naphthoflavone combination treatment on A549 cells was studied.The cell activity of gefitinib at different concentrations (5,10,15,20,30,and 40 μmol/L) andα-naphthoflavone (10 and 20 μmol/L) was tested by CCK-8 assay after combination treatment for 24 h to evaluate the influence of the CYP1A1 enzyme inhibitor on the anti-tumor action of gefitinib.As shown in Fig.6,the combination of gefitinib andα-naphthoflavone exhibited a stronger lethal effect than gefitinib alone.Moreover,the combination treatment ofα-naphthoflavone and a low concentration of gefitinib resulted in a more significant reduction in cell viability compared with treatment with gefitinib alone.It is possible that intracellular CYP1A1 only metabolizes drugs partially,and that gefitinib when used at a high concentration still exhibits a high mortality rate toward A549 cells.According to Table S2 (Supporting information),the half maximal inhibitory concentration (IC50) value of A549 cells treated with gefitinib alone was 28.86±0.85 μmol/L,decreasing to 13.92±2.83 and 5.59±0.28 μmol/L when combined with 10 and 20 μmol/L ofα-naphthoflavone,respectively.The IC50 gradually decreased with an increase in theα-naphthoflavone concentration.Therefore,α-naphthoflavone was deduced to reduce the metabolism of gefitinib by inhibiting the activity of CYP1A1,increasing the concentration of the intracellular drug,and improving the sensitivity of A549 cells to gefitinib.It has been reported thatα-naphthoflavone can inhibit the decrease in the gefitinib concentration in NSCLC cells,significantly inhibit the phosphorylation of EGFR protein,block the activation of PI3K/AKT/mTOR and Ras/Raf/MEK/MAPK pathways,and inhibit the proliferation of tumor cells [10].These results indicate that the pharmacokinetics at the tumor cell level plays a crucial role in antitumor action.This indicates that,to improve drug efficacy,research should be focused on the metabolism of drugs in tumor target cells.The combination therapy of gefitinib andα-naphthoflavone is thus a potential strategy to overcome the primary resistance of NSCLC.

Fig.6.Proliferation inhibition curve of gefitinib combined with α-naphthoflavone in the treatment of A549 cells.
In conclusion,we successfully integrated ILCEI-MS and HPLCMS to construct a new platform (sDMH-scMS) for investigating the heterogeneity of drug metabolism.The platform was used to study the potential of using ILCEI-MS and HPLC-MS to detect gefitinib metabolites in NSCLC cells and the difference in gefitinib metabolism in EGFR wild-type A549 cells and mutant PC9 cells.It reflected the relationships between the primary resistance of NSCLC cells to gefitinib and drug metabolism.Ten gefitinib metabolites were detected by HPLC-MS in NSCLC cells,which were found to mainly metabolize intoM5(M295820) andM7(M608236).The undiluted single-cell analysis method ILCEI-MS could detect theM11metabolite in 11.9% of NSCLC single cells,which revealed the heterogeneity of gefitinib metabolism in NSCLC single cells.The content of gefitinib in A549 cells was significantly lower than that in PC9 cells.However,M5(M295820),M7(M608236),andM11were present at significantly higher levels in the A549 cells than in the PC9 cells.The results indicated that A549 cells digest gefitinibviaextensive drug metabolism,which weakens the antitumor effect of the drug and promotes primary resistance.The CYP1A1 enzyme inhibitorα-naphthoflavone was shown to improve the sensitivity of A549 cells to gefitinib treatment by inhibiting drug metabolism.The combination therapy of gefitinib andα-naphthoflavone was found to overcome the primary resistance of NSCLC cells to gefitinib to a certain extent.This study demonstrated the potential of ILCEI-MS to analyze the heterogeneity of drug metabolism in tumor single cells and provides a strategy for overcoming the primary resistance of NSCLC tumors to EGFR-TKI therapy.
Declaration of competing interest
The authors declare that they have no known competing financial interests or personal relationships that could have appeared to influence the work reported in this paper.
Acknowledgments
This work was supported by the Beijing Outstanding Young Scientist Program (No.BJJWZYJH01201910005017) and the National Natural Science Foundation of China (Nos.22127805 and 22206008).
Supplementary materials
Supplementary material associated with this article can be found,in the online version,at doi:10.1016/j.cclet.2023.108466.
 Chinese Chemical Letters2024年2期
- Chinese Chemical Letters的其它文章
- The 3rd Xihua Chemistry and Biomedicine Forum
- Professor Hualiang Jiang: A tribute to an esteemed visionary chemist and pharmacist
- Recent advances in visible light-mediated chemical transformations of enaminones
- Development of porphyrin-based fluorescent sensors and sensor arrays for saccharide recognition
- Recent advances of versatile reagents as controllable building blocks in organic synthesis
- Synthetic host-guest pairs as novel bioorthogonal tools for pre-targeting☆