
Effect of spatially nonlocal versus local optical response of a gold nanorod on modification of the spontaneous emission?
2021-03-11 08:34ShaShaWen文莎莎MengTian田錳HongYang楊紅SuJunXie謝素君XiaoYunWang王小云YunLi李蕓JieLiu劉杰JinZhangPeng彭金璋KeDeng鄧科HePingZhao趙鶴平andYongGangHuang黃勇剛
Chinese Physics B 2021年2期
關鍵詞:劉杰
Sha-Sha Wen(文莎莎), Meng Tian(田錳), Hong Yang(楊紅), Su-Jun Xie(謝素君),Xiao-Yun Wang(王小云), Yun Li(李蕓), Jie Liu(劉杰), Jin-Zhang Peng(彭金璋),Ke Deng(鄧科), He-Ping Zhao(趙鶴平), and Yong-Gang Huang(黃勇剛)
College of Physics,Mechanical and Electrical Engineering Jishou University,Jishou 416000,China
Keywords: spatially nonlocal response,hydrodynamics,spontaneous emission rate,gold nanorod
1. Introduction
Recently, great progress has been made in the field of quantum interaction between a quantum emitter (QE) and localized plasmons. Due to the strong field confinement beyond the traditional optical diffraction limit,[1]plasmonic nanostructure can be used to reduce the size of optical devices[2,3]and to enhance the light-matter interaction.[4–19]Many novel phenomena have been reported, such as QE-plasmon bound state,[20]enhanced spontaneous emission,[21]high-efficiency solar energy conversion,[22,23]biomedicine,[24–26]photocatalysis,[27]enhanced single molecule Raman spectroscopy,[28]highly sensitive detection,[29]position dependent dipole-dipole interaction,[30]and quantum information processing and computing.[31]
Theoretically, the spontaneous emission rate of a QE modified by the photonic environment can be expressed by the photon Green’s function (GF).[32–39]Recently, we have shown that the photon GF can be obtained exactly and efficiently by calculating the optical response of the photonic environment to an oscillating electric point dipole source[40–42]within the local optical response approximation(LRA).However,as the considered material system is on the nanoscale or reaches even down to the atomic scale, the spatially nonlocal and quantum effects can strongly affect the system response to the optical fields(see Refs.[43,44]and references therein). In this case,the quantum mechanical nature of the material plays a decisive role and can not be accurately described within the LRA.Some ab initio approaches have been proposed for this problem,such as the time-dependent density functional theory(TD-DFT)[45,46]and the time-dependent orbital-free density functional theory (TD-OFDFT).[47]However, these methods can be applied only for extremely small nanoparticles since the computational cost increases cubically with the number of electrons. For a generic plasmonic system with large feature sizes that are computationally prohibitive for ab initio approaches, a semiclassical treatment based on the hydrodynamic model(HDM)has been proposed in recent years.[48–52]We can describe the size-dependent resonance shift by including the Thomas–Fermi (TF) electron pressure due to Fermi-Dirac statistics. By further including the diffusive contribution, a generalized nonlocal optical response (GNOR) model can be used to understand the size-dependent broadening.[53]It is in remarkable agreement with the TD-DFT results. For a thorough review of the LRA, the HDM, and the GNOR, one can refer to Ref. [48], where all the three models are investigated for a nanosphere.
By currently available nanotechnologies, individual metallic nanoparticle and plasmonic nanocavity of various shapes and dimensions have been controllably fabricated.[54–64]It is relatively easy to synthesize gold nanorods in a controlled and reproducible fashion.[60–64]The aspect ratio(the ratio of the length to the radius)and the absolute dimensions can be controlled by different seeded growth syntheses approaches (see Ref. [60] and related references).Furthermore, due to the remarkable shape-dependent optical properties, gold nanorods have been widely applied in sensing, plasmon-enhanced spectroscopies, biomedical imaging,and photothermal tumor therapy.[64–71]Therefore, we are interested in whether and how the spatially nonlocal optical response takes effect when gold nanorods are of different dimensions.
In this work, we study the differences among the LRA model, the HDM,and the GNOR model for investigating the spontaneous emission enhancement of a QE around a gold nanorod. Different aspect ratios and dimensions are taken into account, including fixed aspect ratio with different dimensions, fixed length, and fixed radius. The size-dependent blueshift and linewidth broadening will be demonstrated. In addition,nonlocal effect on the higher order modes is also investigated.
2. Model and method
As shown in Fig.1, the gold nanorod, with radius R and length L, is embedded in a background material with a relative permittivity of ε1=2.25. A two-level QE is located on the rotationally symmetric axis of the nanorod(the z-axis)and at height h above the metal surface. For simplicity, the transition dipole d=d ?z is also oriented along this direction and its strength is d =24 Debye. We numerically investigate the enhancement of the spontaneous emission rate when the LRA model, the HDM, and the GNOR model are adopted for the gold nanorod.
According to quantum electrodynamics,the spontaneous emission rate reads
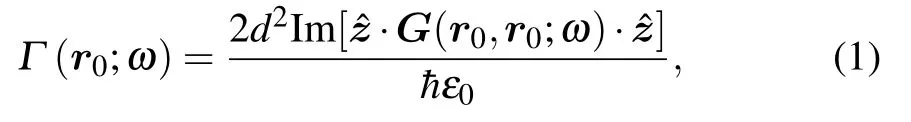
in which the photon GF G(r0,r0;ω)can be obtained through the spectrum E(r0)of the radiation electric field for an oscillating electric point dipole dce?iωtat r0[40–42]

Here,the spectrum E(r)satisfies[48,53]


Fig.1.Schematic diagrams.The gold nanorod,with radius R and length L,is embedded in a background material with a relative permittivity of ε1=2.25.The rotationally symmetric axis of the nanorod is taken as the z-axis, on which a QE (represented by a red point) is located. The QE is at height h above the metal surface. For simplicity,the transition dipole d=d ?z is also oriented along the z-axis. The differences among the LRA model,the HDM,and the GNOR model for investigating the spontaneous emission enhancement of the QE are studied.

Since the system possesses rotational symmetry, we can adopt the quasi-two-dimensional modeling method(termed as 2.5D) presented in Refs. [42,75]. In this method, the electric field and the current density are decomposed in terms of the azimuthal mode number m and can be written as a sum of cylindrical harmonics. Furthermore,each harmonic can be solved separately on the two-dimensional cross-section. Thus,the three-dimensional (3D) problems reduce to a set of twodimensional (2D) problems. This results in extremely large computational savings in terms of space and processing time.In our system,because the source current density contains the cylindrical harmonics only with azimuthal number m=0, it is this term that the decomposition leaves,leading to a dimension reduction. The weak forms for the coupled Eqs.(3a)and(3b)can be efficiently carried out with the frequency domain finite-element solver COMSOL Multiphysics,[42]in which an oscillating electric point dipole is modeled by adding a weak contribution node(see“Weak Contribution”in the help documentation of COMSOL Multiphysics). In the calculation,the simulation domain is a rectangle and about 3λ2with λ being the operation wavelength in vacuum. Perfect matched layers (PMLs)with a thickness of 0.5λ are used to simulate the unbounded or infinite domains. A non-uniform mesh is employed with a maximum element size of 0.1 nm around the dipole and the metal surface,and λ/30 in the background. We have checked that these parameters provide accurate numerical convergence for this work.
3. Results and discussion
Figure 2 shows the enhancement of the spontaneous emission rate Γ/Γ0(Γ and Γ0are the spontaneous emission rates with and without the nanorod,respectively),when the nanorod aspect ratio is fixed at L/R=4.Here,the distance between the QE and the metal surface is relatively large h=10 nm. Since the electric field for the higher order modes decreases more rapidly than the dipole mode with increasing distance h,[40]the main contribution to the spontaneous emission enhancement is made by the dipole mode rather than the higher order modes.Compared with the LRA model, the nonlocal model shows a blueshift[see Figs.2(a)and 2(b)], which can be attributed to the‘spill-in’of the electron density inside the metal.[49]In addition,the linewidth broadening due to the induced charge diffusing can also be observed by comparing the results predicted by the GNOR model with those by the HDM.[53]

Fig.2.The enhancement of the spontaneous emission rate Γ/Γ0 for nanorod with a constant aspect ratio L/R=4.(a)R=6 nm within the LRA(black solid), the HDM(red dashed line)and the GNOR(blue dash-dotted line). (b)The same as(a)but for R=2.5 nm. (c)The resonance frequency ωd calculated using the LRA and the GNOR. (d) The enhancement Γ/Γ0 at the resonance frequency as a function of the nanorod radius. The insets are for their absolute difference.
Besides the above blueshift and the linewidth broadening,the resonance frequencies ωd,predicted by all the three different response models,decrease slightly with increasing dimension. This can be observed by comparing the peak frequencies in Figs.2(a)and 2(b). To further demonstrate this,we plot the resonance frequency ωdversus the nanorod radius using the LRA and the GNOR model in Fig.2(c). Both the peak frequencies and the differences (representing the blueshift, see the inset therein)decrease slightly with increasing dimension.Furthermore, their difference is less than 0.05 eV when the radius R is larger than 15.0 nm. This implies that nonlocal optical response becomes unimportant for the resonance frequency when the nanorod is large.
However,the spontaneous emission enhancement Γ/Γ0at the resonance frequency does not decrease progressively with the absolute dimension. Figure 2(d) shows that it increases first and then decreases along with the increase of the nanorod radius. There is an optimal dimension to obtain a maximal enhancement. Moreover,the difference of the maximal enhancement Γ/Γ0between the LRA and the GNOR is also nearly maximal at this optimal dimension[see the inset in Fig.2(d)].For much large nanorod (R>15.0 nm), the nonlocal optical response is also unimportant for the maximum enhancement Γ/Γ0,which is similar to its effect on the resonance frequency.
The above phenomena also exist for other aspect ratios.Figure 3 shows the results for L/R=3 and L/R=2, which are very similar to those for L/R=4[see Figs.2(c)and 2(d)].However,the resonance frequencies shift quickly to lower energy with the increasing aspect ratio. For example, when the aspect ratios are 2, 3, and 4 with R=8 nm, the resonance frequencies ωdpredicted by the LRA are 2.72 eV, 2.30 eV,and 1.99 eV, respectively. The differences between them are huge.Similarly,they are 2.83 eV,2.36 eV,and 2.03 eV within the GNOR,between which the differences are also very large.These results imply that the resonance frequency ωdcan be easily tuned by the nanorod aspect ratio,regardless of the optical response model.
For a certain resonance frequency, the absolute dimensions required depend heavily on the aspect ratio. For example, if the resonance frequency is ωd= 2 eV and the aspect ratios are 4 [Fig.2(c)], 3 [Fig.3(a)], and 2[Fig.3(c)], the absolute dimensions (R,L) required within the LRA are (7.37,29.48) nm, (20.16,60.48) nm and R =(34.81,69.62) nm, respectively. The differences are large.Within the GNOR or the HDM,the absolute dimensions(R,L)required are similar to those calculated by the LRA, i.e.,(9.20,36.8)nm,(21.0,36.0)nm and(35.70,71.4)nm,from which large differences can also be seen.
Besides the great effect of the aspect ratio on the resonance frequency, it also has great effect on the maximal spontaneous emission enhancement [Γ/Γ0at the peaks in Figs. 2(d), 3(b), and 3(d)]. We find that the maximal enhancement increases with increasing aspect ratio. For example, when the aspect ratios are 2, 3, and 4, the maximal enhancements within the LRA are 316.66, 541.67, and 761.30,respectively. Within the GNOR,they are 143.91,309.32,and 492.28, respectively. Thus, in both the models, the maximal enhancement increases significantly with the aspect ratio.Furthermore, it is for the radius around 8 nm that the maximal enhancement for Γ/Γ0can be obtained for all the three different aspect ratios. These two characteristics imply that longer nanorod leads to greater maximal enhancement for the spontaneous emission rate at the resonance. In the following, we will vary the aspect ratio (L/R) by tuning either the radius R or the length L.

Fig.3. The same as Figs.2(c)and 2(d)but for different aspect ratios: (a)and(b)for L/R=3,(c)and(d)for L/R=2. The insets are for the absolute differences between the LRA and GNOR.

Fig.4. The resonance frequency ωd and the enhancement Γ/Γ0 at ωd: (a)and(b)for a constant length L=10 nm,(c)and(d)for a constant radius R=4 nm. The insets are for their absolute difference.
Figure 4 shows the results for a fixed nanorod length L=10 nm [Figs. 4(a) and 4(b)] and for a fixed nanorod radius R=4 nm[Figs.4(c)and 4(d)]. When the length is fixed,the resonance frequency ωdincreases sharply with increasing radius R[see Fig.4(a)]. However, ωddecreases sharply with increasing length L[see Fig.4(c)]. These results suggest that the larger radius R and the shorter length L,corresponding to a smaller aspect ratio L/R, lead to a much larger resonance frequency ωd.
As stated above, ωdis more sensitive to the aspect ratio than the absolute dimension under a fixed aspect ratio.This characteristic can be seen more clearly by comparing the results in Fig.4 with those in Fig.3. For example, when R changes from 1 nm to 10 nm, ωdpredicted by the LRA grows dramatically from 1.21 eV to 3.20 eV [see Fig.4(a)],but under a constant aspect ratio L/R=3, it falls slowly and changes only from 3.12 eV to 2.68 eV[see Fig.3(c)]. Within the GNOR model, quite similar results can be observed. It rises sharply from 1.32 eV to 3.43 eV when L=10 nm [see Fig.4(a)],and falls only from 3.80 eV to 2.76 eV when L/R=3[see Fig.3(c)].Thus,the resonance frequencies predicted by both the local model and the nonlocal model are much determined by the aspect ratio and increases sharply with decreasing aspect ratio. On the other hand,ωdfalls slowly along with the increase of the absolute dimensions under a certain aspect ratio. These two characteristics are helpful in determining the dimensions of the nanorod in order to meet a required resonance frequency.
To gain a deeper understanding of the above phenomena,we first analyze the size-dependent characteristic for the resonance frequency of the dipole mode within the LRA.As stated above, the resonance results from dipolar longitudinal charge oscillation parallel to the rod axis. Intuitively,the nanorod can be regarded as quasi-one-dimensional Fabry–P′erot resonators.Due to the reflections at the ends of the nanorod,the interference between the forward and backward propagating waveguide mode leads to a single nodal.[76–79]Thus, the resonance condition for this mode can be written as[77]

Here, δ corresponds to the decay length of the displacement current in vacuum,which increases the effective nanorod length;neffis the real part of the effective index for the waveguide mode, which can be calculated from the finite-element solver COMSOL Multiphysics by a mode analysis calculation. By this method, we find that λ/2neffincreases linearly with the operation wavelength λ. For example,an almost perfect fitting function λ/2neff=?15.47 nm+0.0648λ is obtained for R = 4 nm and 350 nm ≤λ ≤1200 nm. Thus,the required nanorod length at resonance is approximately linearly dependent on the wavelength λ and can be rewritten as L(λ)=0.0648λ ?2δ(λ)?15.47 nm. Similar to Ref. [76],the above equation becomes L(λ) ≈0.0648λ ?15.47 nm if δ is neglected. However, in our system for the case in Fig.4(c), we find that the decay length exhibits a 2δ(λ)=0.01298λ ?0.55 nm dependence of λ.It can not be neglected,since it is comparable with the nanorod length. For example,when the nanorod lengths are L = 4,8,12,24, and 32 nm,we find 2δ = 4.13,5.10,6.40,9.52, and 10.92 nm, respectively. Although δ can not be neglected for a short nanorod,it is linearly dependent on the wavelength λ. By substituting this linear relation into the resonance condition, one has L(λ)=0.05182λ ?14.92 nm for R=4 nm. Thus,the characteristic of the length-dependent frequency shift can be understood. This is also consistent with the intuitive interpretation stated in Ref.[79]. The separation between the dipole charges increases with the increase of the nanorod length,thereby reducing the restoring force that determines the oscillation frequency.
The radius-dependent frequency shift can also be explained similarly. Numerical results show that the larger the radius is,the smaller the neffis. This can be clearly seen from Fig.2 in Ref. [80] for the mode with m=0, which exhibits an neff∝1/R dependence at a fixed wavelength. We have numerically proved this. It is found that neff≈50.16 nm/R for ω =2 eV when R is in the range(1,10)nm. As explained in Ref.[80],δ(λ)is proportional to R.Using these two relations,one can obtain λ =a+b/R from the resonance condition,in which b is much larger than a. Thus,the resonance frequency increases sharply with increasing radius R at a fixed nanorod length.
Using the above two size-dependent characteristics, one can understand why the resonance frequency is less dependent on the absolute dimensions of the nanorod with a fixed aspect ratio. In this case, the height and the radius increase or decrease together. However,ωddecreases with increasing height while it should grow with the increasing radius. This leads to the result that ωdis not much dependent on the dimension under a fixed aspect ratio.

For the spontaneous emission enhancement Γ/Γ0at the resonance frequency within both the local model and the nonlocal model, it drops sharply with the increase of the radius R when the length L keeps unchanged [see Fig.4(b)]. On the contrary, when the radius R is invariant [see Fig.4(d)],it grows dramatically with increasing length L. These results clearly show that increasing the length and enlarging the radius lead to opposite effects on the maximum enhancement.The longer and the thinner nanorod shows larger enhancement.This is consistent with the results shown in Figs. 2(d), 3(b),and 3(d), where an optimal dimension exists in order to obtain a maximal enhancement for the nanorod with a constant aspect ratio. A competitive equilibrium can be reached by increasing the length L and enlarging the radius R. Physically,with increasing L,the effective dipole moment increases,then the scattering field increases monotonically accordingly.Thus,the enhancement Γ/Γ0grows with the increase of the nanorod length.[79,80]As explained in Ref. [80], for the nanorod with small radius(R <30 nm),it is too narrow to sustain the charge at the end of the rod. The lightning-rod effect due to tighter charge localization at smaller R is the most important effect determining the R dependence of the enhancement Γ/Γ0at the resonance frequency.
However,the above characteristic is for the enhancement at the resonance frequency of the plasmonic mode. For a certain transition frequency ω, regardless of whether it is at the plasmonic mode or not, the enhancement of the spontaneous emission rate is investigated when the length is shorter than 80 nm and the radii are R=2, 4, 6, 8, 10, and 12 nm. Here,we set ω=1.905 eV,which is the transition frequency for the ZnPc molecule.[82]From Fig.5, we see that there is also an optimal dimension for the nanorod to produce the maximum enhancement. For example,the optimal dimensions(R,L)are(6,26.9)nm,(6,28.1)nm,and(6,28.2)nm within the LRA,the HDM, and the GNOR, respectively. Compared to the results within LRA, the nanorod length is about 0.2 nm longer within the HDM, which can be attributed to the ‘spill-in’ of the electron density inside the metal. This proves the previous argument that the reduction of the effective length due to nonlocal is in the order of ?A.Accordingly, the enhancements are 860.51,831.5,and 630.66,respectively,which are roughly the same. This small change can be attributed to the small variation of the effective dipole moment.
Now,we consider the effect of the distance h between the QE and the metal surface.Figure 6 shows the results for different distances h while the absolute dimensions of the nanorod remain the same. By comparing the results for h =12 nm[see Fig.6(a)] and h=4 nm [see Fig.6(b)], we find that the resonance frequency is not changed while the enhancement is greatly modified within both the local model and the nonlocal model. These characteristics can be clearly seen from Figs. 6(c) and 6(d), where the resonance frequency is not affected by h but the enhancement Γ/Γ0at the resonance frequency falls sharply with the increase of the distance h within both the LRA and the GNOR. For example, when h=2 nm,Γ/Γ0is 8446.33 and 7202.24 within the LRA and the GNOR,respectively. However, when h=12 nm,Γ/Γ0is 419.88 and 247.00 within the LRA and the GNOR, respectively, which are about 20 fold reduction within the LRA and about 30 fold reduction within the GNOR.
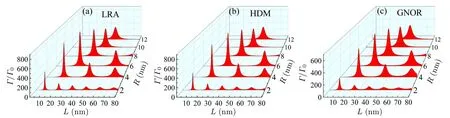
Fig.5. The enhancement of the spontaneous emission rate at ω =1.905 eV for LRA(a),HDM(b)and GNOR(c). It is found that there is an optimal dimension for the nanorod to produce the maximum enhancement.

Fig.6. The spontaneous emission enhancement at different QE-surface distances h when L=20 nm, R=5 nm:(a)and(b)Γ/Γ0 for h=12 nm and h=4 nm. It is found that Γ/Γ0 increases sharply with decreasing distance h while the peak positions are not affected. (c) and (d) The resonance frequency ωd and the enhancement Γ/Γ0 at ωd,respectively.

Fig.7.Γ/Γ0 over a wide frequency range for small QE-surface distance h=5 nm.From the results by the LRA(black solid line),the HDM(red dashed line)and the GNOR(blue dash-dotted line),one can see that the blueshift increases with higher order modes.
In the following of this section,we show how the nonlocal optical response takes effect on the higher order modes. For this purpose,we choose a relative small distance between the QE and the surface of the nanorod h=5 nm. Figure 7 shows the results over a wide frequency range. We observe that the resonance frequency for higher order mode shifts more than that for the lower order mode. This is similar to the result for the nanosphere system investigated in Ref.[48],where the resonance shift increases with higher order of angular momentum. Intuitively,the electric feilds for higher order modes are much more strongly localized than those for the lower order modes. Therefore, the higher order modes are more affected by the nonlocal smearing of the induced charges.
4. Conclusion
We have numerically investigated the modification of the spontaneous emission rate of a QE around a gold nanorod,for which the spatially local (LRA) and nonlocal (HDM and GNOR) optical response models are taken into account.Within all the three response models,we have found that both the resonance frequency and the enhancement of the spontaneous emission rate are much determined by the aspect ratio but less dependent on the absolute dimensions of the nanorod.For the nanorod with a fixed length,it is found that the larger the radius is, the higher the peak frequency and the smaller the maximum enhancement are. However, for the nanorod with a fixed radius,on the other hand,the peak frequency decreases sharply and the enhancement of the spontaneous emission rate increases sharply with the increase of the nanorod length. In addition,for the nanorod with a certain aspect ratio,the resonance frequency decreases slightly with the increasing nanorod size, while the enhancement of the spontaneous emission rate increases first and then decreases. A maximum enhancement can be obtained when the radius is around 8 nm with the aspect ratios of 2, 3, and 4. By reducing the distance between the QE and the nanorod, we have found that the resonance frequency is changeless while the enhancement increases sharply. For a certain transition frequency ω0, regardless of whether it is at the plasmonic mode or not, we have found that there is an optimal dimension for the nanorod to maximize the spontaneous emission enhancement.
For the gold nanorod,nonlocal effect leads to a blueshift for the resonance frequency. We have found that the higher the resonance frequency is, the more obvious the blueshift becomes. For a certain nanorod aspect ratio, the blueshift decreases with increasing dimensions. This phenomenon remains when the nanorod radius is fixed. However, for the nanorod with a fixed length, the blueshift becomes larger by increasing the nanorod radius. We also found that the higher order modes experience a larger blueshift than the lower order modes.
We have shown that size-dependent characteristics of the resonance frequency can be understood by the quasi-onedimensional Fabry–P′erot interference due to the reflections at the ends of the nanorod. Using the resonance condition λ/2neff= L+2δ, we have found that the resonance wavelength is approximately linearly dependent on the length L and the inverse of the radius 1/R. The blueshift within the nonlocal models can be attributed to the reduction of the effective length due to the spill-in effect. We have found that the length-dependent characteristics of the spontaneous emission enhancement at the resonance frequency can be understood by taking the nanorod as the induced dipole moment, while the radius-dependent characteristic is due to the lightning-rod effect.
猜你喜歡
Chinese Physics B(2022年11期)2022-11-21
Chinese Physics B(2022年9期)2022-09-24
Chinese Physics B(2022年5期)2022-05-16
職工法律天地·上半月(2019年12期)2019-01-03
故事會(2018年11期)2018-06-08
美與時代·美術學刊(2018年10期)2018-01-25
漢語世界(2017年5期)2017-09-21
Chinese Physics B(2017年9期)2017-08-30
故事會(2016年11期)2016-06-02
武漢紡織大學學報(2010年1期)2010-08-15
- Chinese Physics B的其它文章
- Novel traveling wave solutions and stability analysis of perturbed Kaup–Newell Schr¨odinger dynamical model and its applications?
- A local refinement purely meshless scheme for time fractional nonlinear Schr¨odinger equation in irregular geometry region?
- Coherent-driving-assisted quantum speedup in Markovian channels?
- Quantifying entanglement in terms of an operational way?
- Tunable ponderomotive squeezing in an optomechanical system with two coupled resonators?
- State transfer on two-fold Cayley trees via quantum walks?