
Communication infrastructure for situational awareness enhancement in WAMS with optimal PMU placement
2021-08-24 05:05BhargavAppasaniAmitkumarVidyakantJhaSunilKumarMishraandAbuNasarGhazali
Bhargav Appasani,Amitkumar Vidyakant Jha,Sunil Kumar Mishra and Abu Nasar Ghazali
Abstract Real time monitoring and control of a modern power system has achieved significant development since the incorporation of the phasor measurement unit (PMU).Due to the time-synchronized capabilities, PMU has increased the situational awareness (SA)in a wide area measurement system (WAMS).Operator SA depends on the data pertaining to the real-time health of the grid.This is measured by PMUs and is accessible for data analytics at the data monitoring station referred to as the phasor data concentrator (PDC).Availability of the communication system and communication delay are two of the decisive factors governing the operator SA.This paper presents a pragmatic metric to assess the operator SA and ensure optimal locations for the placement of PMUs, PDC, and the underlying communication infrastructure to increase the efficacy of operator SA.The uses of digital elevation model(DEM) data of the surface topography to determine the optimal locations for the placement of the PMU, and the microwave technology for communicating synchrophasor data is another important contribution carried out in this paper.The practical power grid system of Bihar in India is considered as a case study, and extensive simulation results and analysis are presented for validating the proposed methodology.
Keywords: Situational awareness, Phasor measurement unit, Optimal placement,Microwave communication
1 Introduction
The present day power system is an intricate interconnection of numerous components communicating with each other and has been attributed as the most complex man-made system of the twentieth century [1].Realtime monitoring and control of these components, distributed over a large topographical sprawl, is a challenging problem for power system engineers.The development of the phasor measurement unit (PMU)can be considered as a breakthrough in this field [2, 3].Time-synchronized measurement of voltage and current phasors and their subsequent transferal in real time for monitoring and control purposes, are some of the powerful features of the PMU.They empower power system operators with enhanced situational awareness(SA) [4, 5].Operator SA involves continual monitoring and processing of real-time grid parameters in order to capture the grid dynamics and take necessary control actions, thereby avoiding major power upheavals [6, 7].SA is largely dependent on the granularity of the sensor measurements, the availability of the communication system, the propagation delay incurred, and the data analytics employed for disturbance detection [8].Thus,an efficient communication system is an essential requirement in communicating the voluminous realtime data generated at the PMU to the phasor data concentrator (PDC), for enhanced SA [8].Such a synchrophasor communication system is shown in Fig.1.

Fig.1 Synchrophasor communication system and the operator SA
1.1 Contributions
Over the past few decades, many innovative applications and visualization techniques have been developed for enhancing the SA in a wide area measurement system(WAMS) [9–12].Numerous data mining and data assessment techniques have been developed for improved disturbance detection and the subsequent SA enhancement [13–17].However, there has been limited study on optimizing the WAMS communication system for SA enhancement.The primary focus of the optimization strategies presented in [18–22] are on improving the availability of a communication system without taking propagation delay into consideration [8].In this paper, an SA metric in the context of the synchrophasor communication system (SPCS) is presented based on two of the pivotal factors, i.e., propagation delay and communication system availability.Subsequently, the optimal placement of PMUs and communication links is thoroughly investigated for SA enhancement.
Another distinctive feature of this work is the use of a microwave communication system (MCS) to communicate the synchrophasor data between the PMU and the PDC.Over the past few decades, microwave technology has undergone momentous progress in terms of bandwidth and data rates, and has emerged as an alternative to the existing fiber optic technology.Owning to the several advantages of MCS over fiber optic communication, the Power Grid Corporation of India Limited(PGCIL) uses MCS as a substitute for fiber optic communication for communicating synchrophasor data [23].The most distinct feature of this technology is that the data can be communicated 40% faster than the existing fiber optic communication, and hence it can enhance operator SA [24].
Microwave technology needs a clear line of sight (LoS)between the transmitting and receiving antennas.The existence of LoS between the communicating devices that are topographically separated by large distances is not always feasible.To overcome this problem, microwave repeaters are used at regular intervals.The deployment of intermediate repeaters also improves the link availability and the quality of the received signal.Hence,proper placement of the intermediate repeaters is a requirement for reliable synchrophasor data communication.This requires knowledge of the Earth’s topography, which is available in the form of Digital elevation model (DEM) data.In [25], an automatic repeater placement algorithm based on global 30 arc-second elevation(GTOPO30) DEM data is proposed for minimizing risk.This determines the geographical locations and tower heights for the intermediate repeaters provided that the information about the PMU and the PDC is known.The main contributions of this work lie in the use of this repeater placement algorithm and the multi-objective Genetic Algorithm (GA) to determine the optimum locations for the PMUs and PDC for operator SA enhancement, while ensuring the system’s full observability with the minimum possible number of PMUs.It also uses a bio-geography based optimization (BBO)algorithm for optimizing the tower heights [26], while the effect of zero injection measurements on the network SA is also analyzed.
1.2 Organization of the paper
The rest of the paper is organized as follows.Section 2 discusses a brief overview of the microwave communication system to facilitate PMU data transfer.The various components of the system essential to evaluate availability are also described.An SA assessment metric in the context of the synchrophasor communication system is presented in Section 3.The automatic repeater placement algorithm aided by multi-objective GA for the optimal placement of both PMUs and PDC is presented in Section 4.Using the GTOPO30 DEM data, the location of the repeaters, the propagation delay, the system availability, and the ensuing SA for the optimum configuration are also evaluated in Section 4.The simulation results for the case study are discussed and analyzed in Section 5 and the conclusion of the work is drawn in Section 6.
2 Microwave communication system for PMU data transfer
Microwave-based communication is based on signals having frequencies of the order of 3 GHz to 300 GHz.Recently, the bloom of microwave technology transformed it into a potent synchrophasor communication technology, which is now being referred to as a microwave synchrophasor communication system (MSCS).The chief components of an MSCS [25, 27] are the PMU and PDC radios, the connecting cables, microwave repeaters, and antennas, as illustrated in Fig.2.

Fig.2 Basic components of a MSCS
The PMU generates time-synchronized data for voltage and current phasors that are modulated by the PMU radio terminal.These are fed to a microwave antenna for transmission.At the PDC, the microwave antenna receives the electromagnetic signals and converts them back into electrical signals.The demodulation at the PDC is carried out by the PDC radio terminal while the demodulated data is used for the ensuing data analytics.Similarly, the command signals sent by the PDC are received by the PMU radio terminal and are demodulated for executing the control actions.In a typical WAMS, the PMU and PDC are geographically separated by hundreds of kilometers and hence intermediate microwave repeaters are used to accomplish data transferal [28].
In this paper, we assume that the synchrophasor communication takes place in the L6 band that occupies the frequency spectrum in the range of 5.925–6.425 GHz.The maximum distance between the adjacent microwave towers is considered to be 25 Km.This gives a link availability of 0.999999 for communication in the L6 band[29].By employing frequency diversity schemes, the availability can be further enhanced and the communication link can be considered to be available throughout the machine operation time [30].Coaxial connectors are passive components having a low rate of failure, and thus can be omitted from the reliability analysis.The mean time to failure (MTTF) for some of the key components and their mean time to repair (MTTR) are summarized in Table 1 [25].
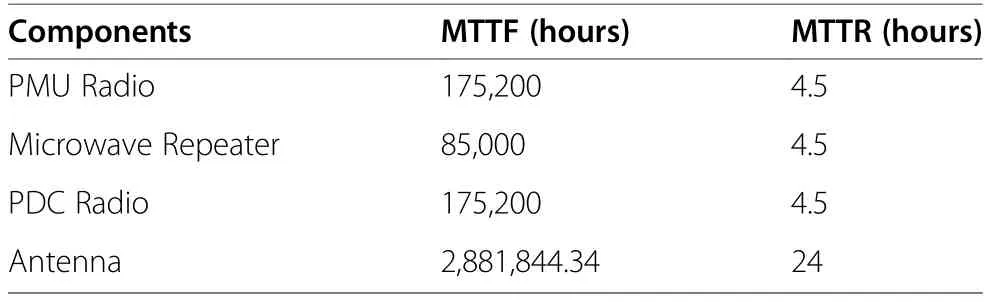
Table 1 The MTTF and MTTR of the constituent components
In the frequency diversity scheme, two radios operating at separate frequencies ‘f1’ and ‘f2’ are used.This also gives a redundant PMU and PDC radio terminal.Similarly, a (1+1) redundant configuration is employed for the microwave repeater, while all the MCSs used in this work have a similar component redundancy as illustrated in Fig.3.

Fig.3 A single repeater PMU MCS
2.1 Availability analysis
An important process in the design of an engineering system is its availability analysis.In this subsection the basics of availability analysis are presented, as they are important for assessment of operator SA.For a repairable system, the availability can be calculated using (1)[31].The block diagram of an ‘r’ components series system is shown in Fig.4a and that of an ‘r’ component parallel system is depicted in Fig.4b.Their availabilities can be calculated using Eqs.(2) and (3) respectively.

Fig.4 Block diagram of a Series system b Parallel system

where ‘MTTFi’ and ‘MTTRi’ represent the mean time to failure of the ithcomponent of the system and its corresponding mean time to repair respectively.
From Fig.3, it can be inferred that an ‘N’ repeater PMU MCS consists of a single PMU radio terminal subsystem consisting of two radio terminals operating in parallel.Similarly, it also has a single PDC radio terminal subsystem consisting of two radio terminals operating in parallel, ‘2N + 2’ antennas and ‘N’ repeaters operating in series with the radio terminal subsystems and ‘N’repeater subsystems each consisting of two repeaters operating in parallel.The series parallel block diagram for an MSCS with single repeater is depicted in Fig.5 to illustrate the concept.Further, this will also aid in elucidating the general expression indicating the availability of an ‘N’ repeater MSCS which is given by Eq.(4).

Fig.5 Series-parallel block diagram

where,

3 SA assessment metric
For a synchrophasor communication system, propagation delay and network availability play pivotal roles in determining the operator SA.These should be taken account of in the assessment metric.A pragmatic expression for the operator SA can be represented as:

where Tpis the propagation delay, and A represents the availability of the MSCS for the PMU and PDC link.This is evaluated using (4).Tsrepresents the processing delay due to the time required by the PMU and PDC to process the data.The standard value of processing delay is considered to be 75 ms [32].
The normalized factor (Tp/ Ts) ensures that the SA is a unit-less quantity and the summation in the denominator retains the SA within the range of 0 to 1.When the propagation delay is zero the operator SA is determined by the availability of the communication system, and when the delay is infinity SA becomes zero.Thus the expression can be considered as a good estimate of the operator SA.Based on the metric given in (5) and from the permissible delays for the various synchrophasor applications,the SA metric for various PMU applications is reported in Table 2[33].

Table 2 Communication delays for various PMU applications

Table 3 Locations of different buses for the Bihar power grid
For a power system consisting of ‘NPMU’ PMUs,the operator SA for the overall system can be obtained as:

where SAtis the SA evaluated for the tthPMU-PDC pair MSCS.If the PMU and PDC are co-located on the same electrical bus, the operator SA for that PMU-PDC pair is taken as unity.
Another pragmatic expression, which can be used as a measure for evaluating the system operator SA,is given by:

The theoretical aspects of availability evaluation and SA assessment have been described, as in (5)–(7).These equations show that the availability evaluation and SA assessment depends on the number of repeaters deployed between the PMU and PDC to establish a reliable communication system.In the next section, the automatic repeater placement algorithm is presented to aid the construction and evaluation of the system SA.
4 Optimal placement of PMUs for SA enhancement
The PMU and its MCS are the expensive units, and so this necessitates judicial use of these devices.To obtain the time-synchronized data of voltage and current phasors, it is not necessary to place PMUs on every electrical bus in the network.A PMU placed on a particular bus measures its voltage phasors and simultaneously the current phasors of all the incident lines [34].Therefore, using the network equations, one can obtain the voltage phasors of all the buses connected to the PMU equipped bus.Hence, by placing PMUs at optimal locations in thenetwork it is possible to observe the entire network.The problem of optimal placement of PMUs has received considerable attention and a plethora of literature is available on this topic.An excellent review of these techniques is given in [35].In the present work, a binary linear programming-aided [36, 37]multi-objective GA [38] is used to find the optimal coordinates to locate both PMUs and PDC.This algorithm ensures that the entire power system is observable with maximum system SA using the least number of PMUs.
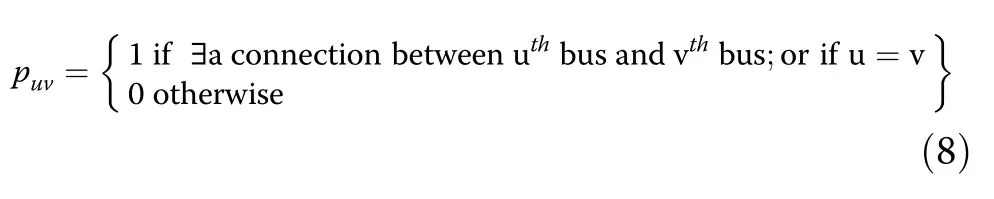
Consider a power grid system consisting of ‘b’ buses and ‘l’branches.The connectivity matrix‘P’,which is a square matrix of order b,is used to expresses their connectivity.The elements of this connectivity matrix‘P’can be determined using Eq.(8).
Likewise, the location of the PMUs for the considered system can be determined by a column matrix ‘Q’, having b rows.The elements of the matrix‘Q’are represented as:

When a bus is neither connected to a load nor to a generator, the sum of all currents associated with the branches connected to the bus is zero, and thus such a bus is called a zero injection bus (ZIB).Including the ZIBs reduces the number of PMUs required to achieve system observability.This is the first parameter to be optimized as given by [37]:

The measure of the system SA is the second function to be optimized.For optimization, the multi-objective GA algorithm is used.It is given by Eq.(11).

In order to calculate the system SA, we first need to determine the PDC location and then find out the required number of repeaters to achieve the communication feasibility for every PMU and the PDC.Thus, the system SA is affected by the location of the PMUs and PDC.The multi-objective GA places the PMUs and PDC such that the system SA is also maximized.For determining the number of repeaters required to establish the MSCS for each PMU and PDC, an automatic repeater placement algorithm is used.This is based on GTOPO30 DEM data [25].The DEM data gives the information of the Earth’s topography and aids in the repeater placement for establishing an efficient MCS infrastructure.The placement of the repeaters is on the basis of existence of LoS and on the inter-tower distances.Further, the BBO algorithm is used to optimize the heights of the towers, such that the propagation delay is minimized.The system SA is then evaluated and finally, the optimum configuration is determined.The automatic repeater placement algorithm to calculate the system SA is illustrated using a flow chart depicted in Fig.6.

Fig.6 Flow chart for SA evaluation
It is worth mentioning that the propagation delay in MSCS is dependent on the heights of the towers and the corresponding locations of the repeaters.To minimize the propagation delay, it is pertinent to optimize the heights of the microwave towers.Thus, prior to evaluating the SA, the BBO algorithm is used to optimize these heights.The objective function considered for optimizing is represented by Eq.(12).

where G is the number of towers, dmis the distance between the mthand its next i.e., (m+ 1)thtower (in meters), mlmand Hmare the mean sea level height and the height of the mthtower (in meters), respectively.
According to [32], an excess delay considered for each repeater is equal to approximately 150 ns.Therefore, Eq.(13) can be used to describe the propagation delay incurred for the synchrophasor communication between the kthPMU and the PDC.

where LoSkis the Line of Sight distance for the kthPMU and PDC determined from (12), and akis the number of repeaters required for a MCS link connecting the kthPMU and PDC.This number is obtained using the DEM data.
5 Case studies
As a case study, the practical power grid system of Bihar, India is considered for validating the proposed methodology [28].The one-line diagram of the considered power grid system is as depicted in Fig.7.The DEM-based automatic repeater placement algorithm is implemented using MATLAB and the simulations for the system under consideration are performed.For the electrical buses considered in this system, their corresponding geographical locations(coordinates) are given in Table 3.This practical power grid consisting of 11 buses was chosen as it is feasible to elucidate the details involved in the proposed methodology.

Table 4 Case study results without ZIB measurements

Fig.7 Single Line Diagram of the Bihar Power Grid (including all buses),India [25]
5.1 Without ZIB measurements
First we consider when the ZIBs are not included in the optimization process and the Eq.(6) is considered as the SA metric for evaluating the second objective function ‘F2’.The parameters of the multi-objective GA for the optimization are as follows: mutation rate=0.01, number of generations=100, and elite count=2.
The optimal locations for the placement of different PMUs are obtained as follows: bus 2 (Begusarai), bus 9(Biharshariff-II), bus 7 (Fatuah), and bus 10 (Gaya).Moreover, the bus 9 (Biharshariff-II) is found to be the optimum location of the PDC.This system has resulted in the maximum system SA metric,of 0.997280312141696.When the second SA metric is chosen for evaluating the second objective function ‘F2’,the optimum locations for the PMU and PDC placement are again found to be the same with the maximized system SA metric,of 0.996011636292648.The results of this case study without including ZIB measurements are shown in Table 4.
It can be further observed from the results reported in Table 4 that if the number of intermediate repeaters are reduced, the availability of the communication system increases and propagation delay reduces, thereby increasing the operator SA.In some cases,because of the geographical profile,additional repeaters may be needed to maintain LoS.This reduces the communication system availability but does not affect the propagation delay.
5.2 With ZIB measurements
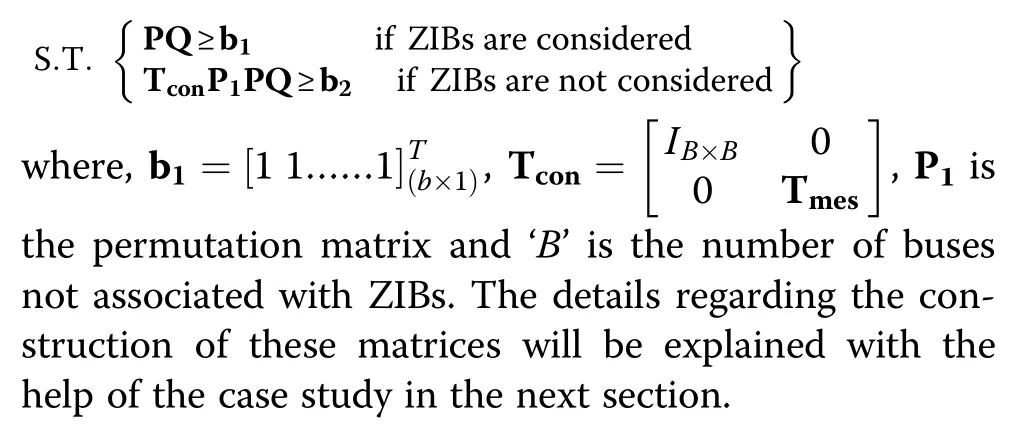
Buses 2, 5, 6 and 9 do not have any generator or load and hence can be considered as ZIBs.First we construct the matrices Tcon,Tmes,P1and b2for the presented case study and incorporate them for evaluating the objective function‘F1’.
We can see that buses 4, 8 and 11 are not associated with any ZIBs, and therefore B=3.There are injection measurements at buses 2, 5, 6 and 9.Therefore, we have:

The permutation matrix and matrix b2can be written[39] as:

Now, the Tconcan be written as:

The results of the case study with the ZIB measurements included are shown in Table 5 and the summary of the results with and without the inclusion of ZIB measurements are compared in Table 6.
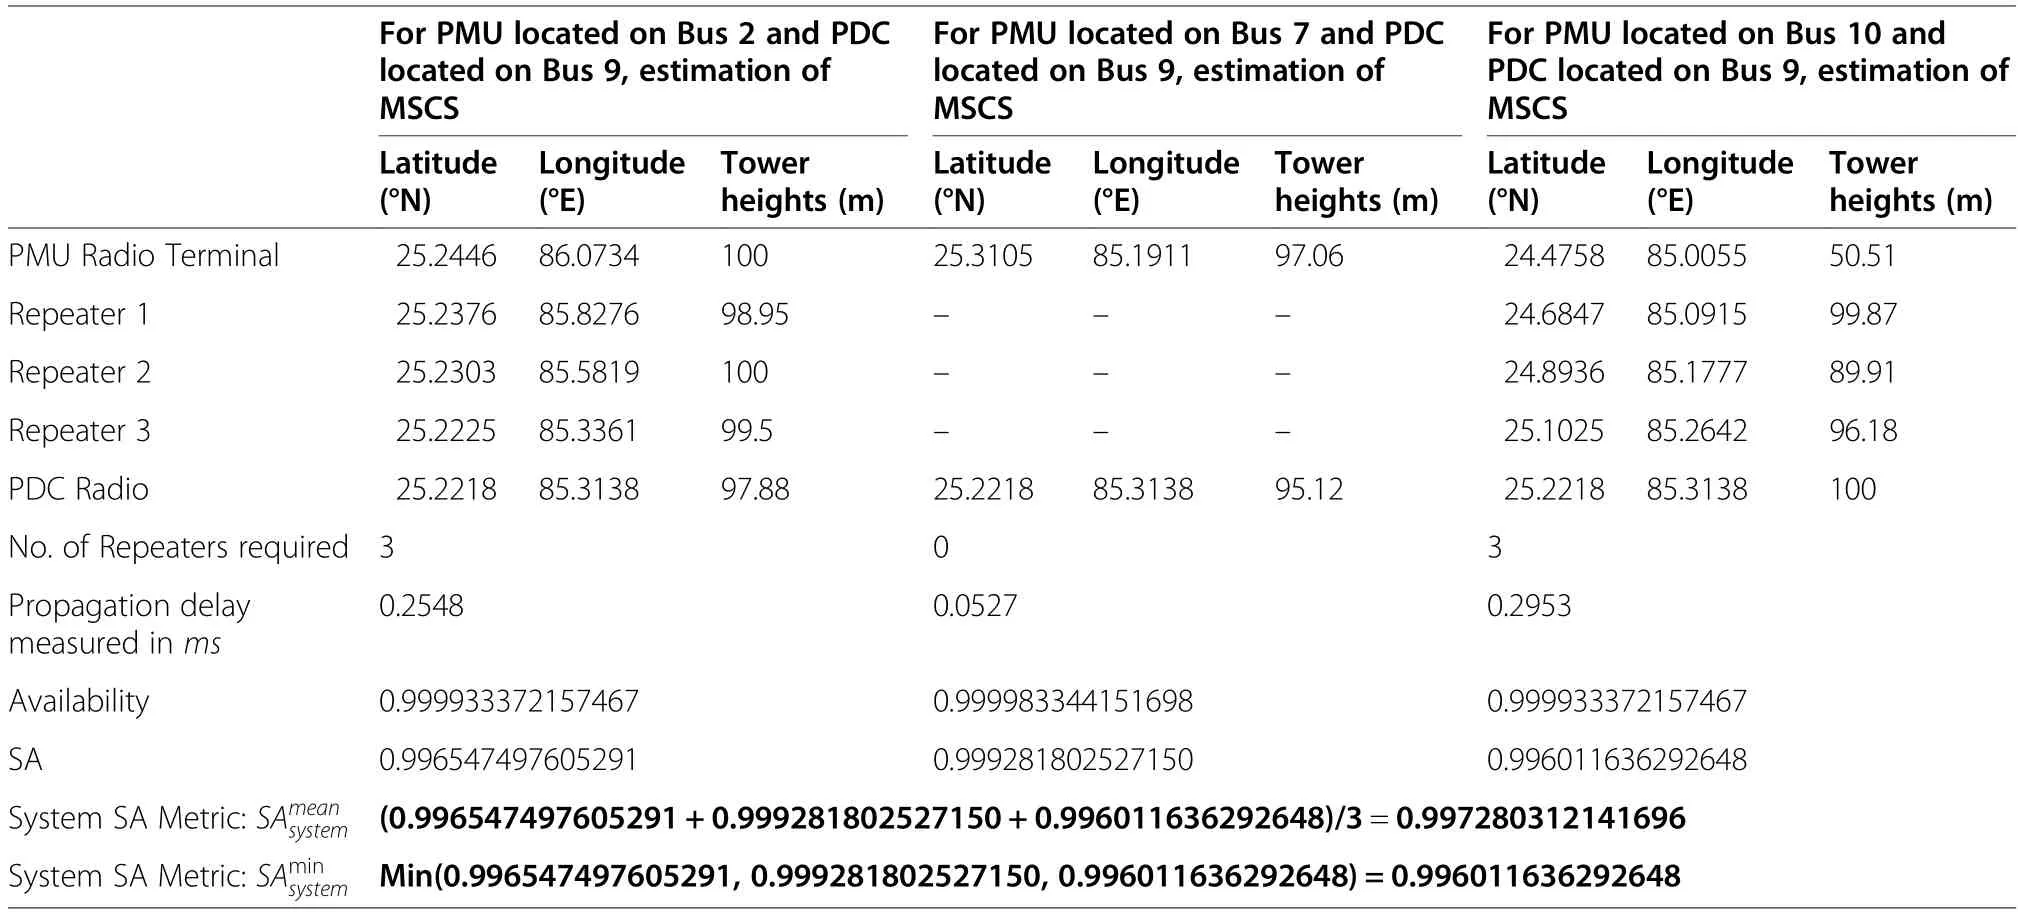
Table 5 Case study results with ZIB measurements
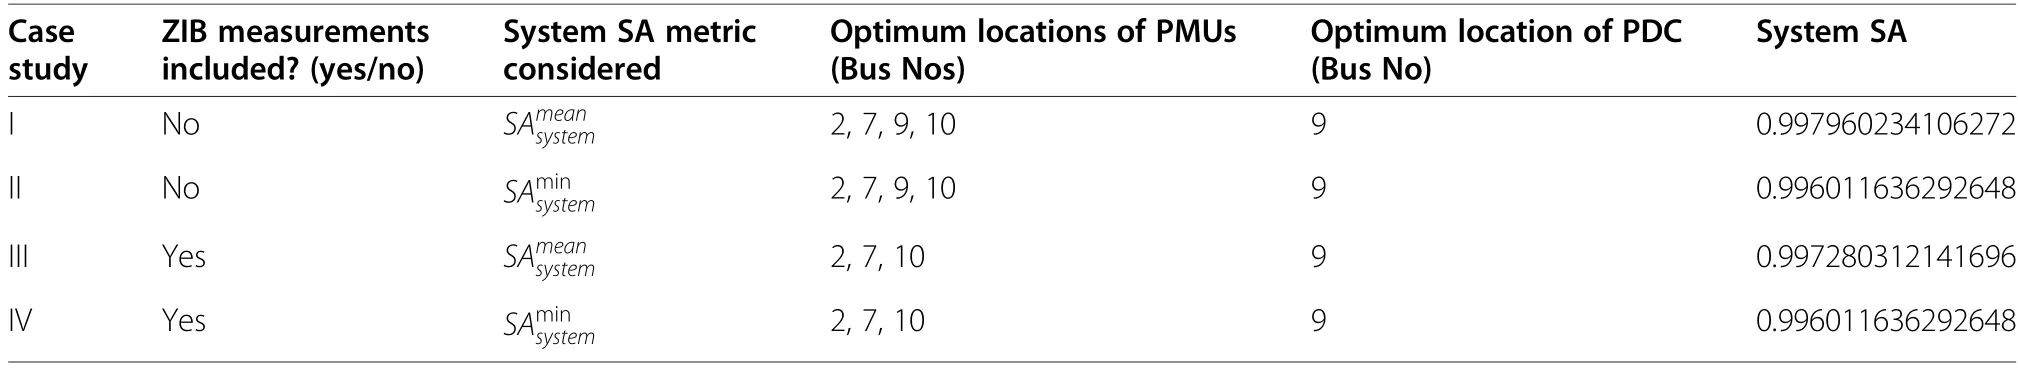
Table 6 A summary of the case studies
The optimum location of the PMUs with ZIBs included and with the objective function ‘F2’ evaluated using (6) are buses 2 (Begusarai), bus 10 (Gaya), and bus 7 (Fatuah).The optimal location for placement ofthe PDC is bus 9 (Biharshariff-II) with the maximized system SA metricof 0.997280312141696.When the objective function ‘F2’ is evaluated using (7), the optimal locations of the PMUs and PDC remain the same while the obtained maximizedis 0.996011636292648.
It can be noted that inclusion of the ZIB measurements minimizes the number of PMUs needed for observing the system and at the same time it has not greatly affected the operator SA.Reducing the number of PMUs reduces the overall cost of the monitoring system so inclusion of ZIB measurements is desirable.Furthermore, from the SA calculated in Table 2, it can be observed that the achieved SA using the proposed method is satisfactory for most of the PMU applications.
5.3 Validation of results
In order to validate these results for LoS and link availability, each of the microwave links between the PMU and corresponding PDC is simulated using Atoll, which is a wireless link planning software.For the PMU located at bus 2 (Begusarai) and the PDC located at bus 9(Biharshariff-II), microwave P2P links along with the intermediate repeaters in Atoll are shown in Fig.8.
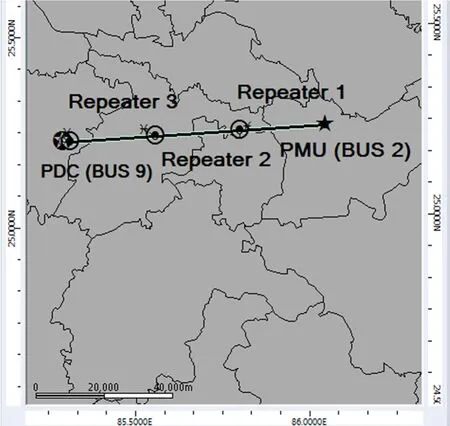
Fig.8 The MSCS for the PMU located on bus 2 and the PDC located on bus 9 for the case study
6 Conclusion
SA enhancement has been a challenge to power system engineers.A pragmatic expression for evaluating the SA in the framework of the synchrophasor communication system would be of great aid in the design of an optimal situational awareness system.Operator SA can be augmented using optimal placement of the PMUs with respect to the PDC.Two metrics for evaluating the SA have been presented along with the optimal placement of the PMUs, the PDC and corresponding microwave synchrophasor communication system for one of the practical power grid systems of India to substantiate the proposed methodology.The authors would like to include economic considerations into the analysis in their future work.
Abbreviations
BBO:Bio-geography based optimization; DEM: Digital elevation model;GA:Genetic algorithm; LoS: Line of sight; MCS: Microwave communication system; MTTF: Mean time to failure; MTTR: Mean time to repair;MSCS: Microwave synchrophasor communication system; PDC: Phasor data concentrator; PGCIL: Power Grid Corporation of India Limited;PMU: Phasor measurement unit;SA: Situational awareness;SPCS:Synchrophasor communication system; WAMS: Wide area measurement system; ZIB:Zero injection bus
Acknowledgments
Not Applicable.
Authors’ contributions
Bhargav Appasani: Simulation Work.Amitkumar Vidyakant Jha: Writing and Organizing.Sunil Kumar Mishra:Figures and literature review.Abu Nasar Ghazali: Main idea and co-ordinating others.The author(s) read and approved the final manuscript.
Funding
Not Applicable.
Availability of data and materials
All the relevant data has been provided in the main manuscript.
Declarations
Competing interests
The authors do not have any competing interests.
 Protection and Control of Modern Power Systems2021年0期
- Protection and Control of Modern Power Systems的其它文章
- A comprehensive review of DC fault protection methods in HVDC transmission systems
- Application of a simplified Grey Wolf optimization technique for adaptive fuzzy PID controller design for frequency regulation of a distributed power generation system
- A critical review of the integration of renewable energy sources with various technologies
- Operational optimization of a building-level integrated energy system considering additional potential benefits of energy storage
- An integrated multi-energy flow calculation method for electricity-gas-thermal integrated energy systems
- Sliding mode controller design for frequency regulation in an interconnected power system