
Effect of thickness variations of lithium niobate on insulator waveguide on the frequency spectrum of spontaneous parametric down-conversion*
2021-11-23 07:25GuangTaiXue薛廣太XiaoHuiTian田曉慧ChiZhang張弛ZhendaXie謝臻達PingXu徐平YanXiaoGong龔彥曉andShiNingZhu祝世寧
Chinese Physics B 2021年11期
關鍵詞:張弛
Guang-Tai Xue(薛廣太) Xiao-Hui Tian(田曉慧) Chi Zhang(張弛) Zhenda Xie(謝臻達)Ping Xu(徐平) Yan-Xiao Gong(龔彥曉) and Shi-Ning Zhu(祝世寧)
1National Laboratory of Solid State Microstructures,School of Physics,School of Electronic Science and Engineering,
College of Engineering and Applied Sciences,and Collaborative Innovation Center of Advanced Microstructures,Nanjing University,Nanjing 210093,China
2Institute for Quantum Information and State Key Laboratory of High Performance Computing,College of Computing,National University of Defense Technology,Changsha 410073,China
Keywords: lithium niobate on insulator,spontaneous parametric down-conversion,waveguide thickness variation,frequency spectrum
1. Introduction
Thin-film lithium niobate on insulator (LNOI)[1,2]is thought to be a revolutionary platform for integrated photonics,[3,4]since it allows strong optical confinement and a high integration density on lithium niobate (LN), a material possessing superior optical performance,[5]such as low optical transmission losses, large electro-optical and second-order nonlinear coefficients. In recent years, LNOIbased integrated photonic devices have achieved remarkable breakthroughs, such as low-loss waveguides,[6-9]highquality-factor microring resonators,[7,10]high-speed electrooptic modulators,[11,12]and broadband optical frequency comb generation.[13,14]
Quasi-phase-matching (QPM)[15]spontaneous parametric down-conversion (SPDC) in periodically-poled crystals or waveguides,[16,17]typically periodically-poled LN(PPLN),[18-22]is widely used in the generation of entangled photon pairs, for the merits of high efficiency and frequency tunability. Benefiting from the strong optical confinement, ultrahigh-efficiency SPDC processes in periodically-poled LNOI(PPLNOI)waveguides were demonstrated recently.[23-25]In particular, a PPLNOI waveguide source with a brightness two orders of magnitude higher than that in the traditional PPLN waveguide was achieved in our lab,[25]as the cross-sectional area of the LNOI waveguide was~2 orders of magnitude smaller than that of the traditional LN waveguide. However, in practical experiment the nonlinear optical performance may be affected by imperfections in fabrication of the waveguide.[26-28]With stronger light confinement, such effect in LNOI-based devices could become greater. Recently, Tianet al.[26]revealed that the spectrum profile and efficiency can be greatly affected by the LNOI waveguide cross-section dimension variations, especially the thickness variations. Hence, with regard to developing photonic quantum technologies in the LNOI platform,it is of practical importance to study the effect of LNOI waveguide fabrication imperfections on SPDC.
In this paper,we make a study on the effect of thickness variations of the LNOI waveguide on the frequency spectrum of SPDC. Our simulation results show that the central peak of SPDC frequency spectrum can be greatly affected by the waveguide thickness variations. Our study can not only give a benchmark to the LNOI waveguide fabrication, but also provide a way for the manipulation of photon frequency state.
2. Basic principles and methods
We consider a PPLNOI waveguide with the schematic structure shown in Fig.1(a).The LNOI wafer consists of three layers from up to bottom. The topX-cut LN film with a thickness ofH=600 nm is etched to a depth ofh=350 nm with a bottom ridge width ofw=1400 nm and a sidewall angle ofθ=60°. The middle is a 2-μm-thick silicon dioxide bonding layer and the bottom is a 0.5-mm-thick LN or silicon(Si)substrate. The length of the waveguide isLand the whole waveguide is poled with a period ofΛ. Here we consider a type-0 QPM SPDC process converting the pump photons at 780 nm to frequency-degenerate photon pairs at 1560 nm. With the COMSOL software we simulate the field distributions of TE00mode at 780 nm and 1560 nm,as shown in Figs.1(b)and 1(c),respectively. We can see that the waveguide is designed to be single mode for the SPDC photons. Note that although here we considere theX-cut LN film, our method is also applied to theZ-cut LN film. The difference is that the extraordinary light modes required in type-0 SPDC correspond to the TE and TM modes forX-cut andZ-cut LN films,respectively.

Fig. 1. (a) Schematic of PPLNOI waveguide structure and phase matching condition. Field distribution of the TE00 mode at the wavelength of 780 nm(b)and 1560 nm(c).
Considering the pump coupling to be optimized to excite the fundamental mode in the waveguide, and using a continues-wave(cw)laser light with a single frequencyωpas the pump,we can write the two-photon term of SPDC as[28-30]
wherezis the propagation direction,and ?kis the phase mismatch expressed as

withkp,ks,andkirepresenting the wave vectors of the pump,signal,and idler fields,respectively. The reciprocal wave vectorG=2π/Λresults from periodic poling and here the period is designed to make the perfect QPM condition of ?k=0 be satisfied at the central frequencies, namely, in the case ofν=0. Note that here a normalization factor of 1/Lis introduced for normalization by the amplitude when ?k=0,and in our simulation the length is fixed toL=6 mm. For the case of single-frequency pump, the joint spectral intensity can be obtained by tracing the frequency of either photon,given by
and the joint spectral intensity is then given by
According to Maxwell’s equations,the field nature of a waveguide is determined by its boundary conditions relating to the waveguide dimensions, such as thickness and width. For the strong-confined waveguide, a slight variation in dimension could have a great effect on the optical properties, like the refractive index, inducing the change of the phase-matching function. Here we focus on the effect of the thickness variation, denoted by ?H(z), which would be a function ofzfor an inhomogeneous variation. As a result,phase mismatch ?kbecomes
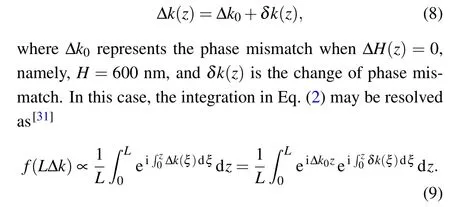
We simulate the values ofδkfor signal/idler wavelength ranging from 1200 nm to 1700 nm when ?H=±20 nm,with the result shown in Fig.2.We can see thatδkcan be considered to be independent of the wavelength. When the thickness change range is small,we can considerδkto be a linear function of the thickness increment ?H,namely,δk=a0?H,[32]and we can estimatea0=?1.64×10¹²m?2from the simulation result.Therefore,Eq.(9)is rewritten as
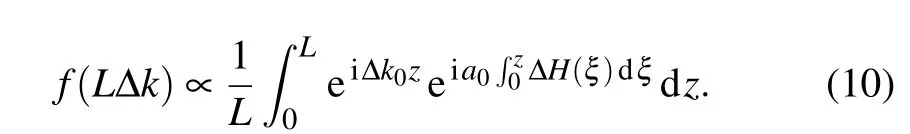
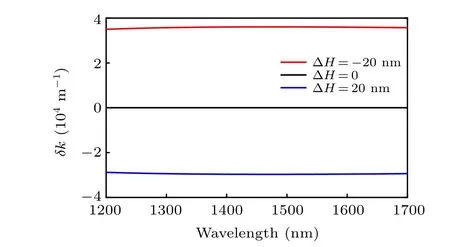
Fig. 2. Change of phase mismatch δk against wavelength under different thickness,with the thickness variation ?H deviated from the designed thickness of 600 nm shown in the box.
3. Results
With numerical simulations via the COMSOL software,we can get the effective refractive index for different wavelengths,and then according to Eqs.(10)and(4),we can calculate the joint spectral amplitude function and the joint spectral intensity under any form of thickness variations,respectively.
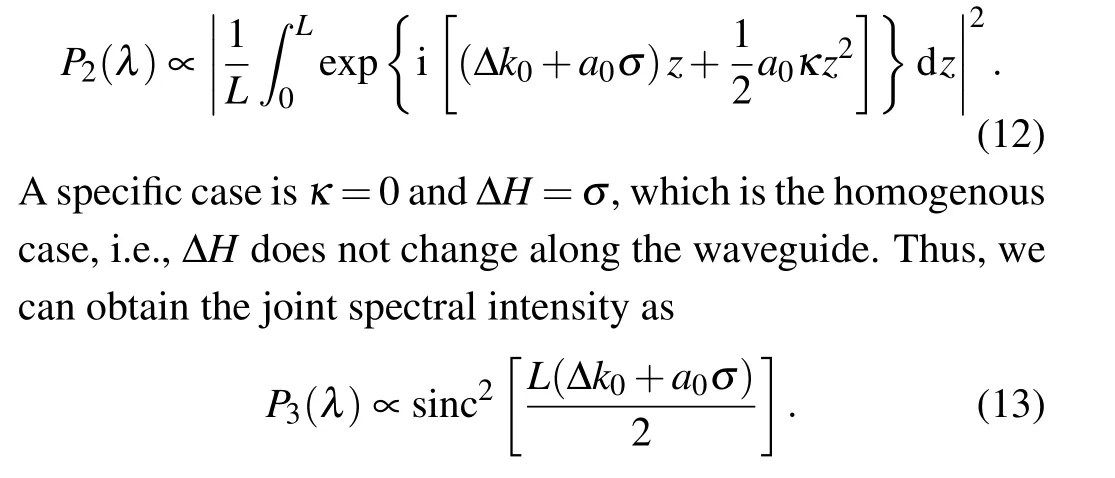
We first simulate the joint spectral intensity in the case of the ideal designed structure when ?H(z) = 0, namely,H=600 nm, which is given by Eq. (7). The simulation result is plotted in Fig.3,which shows a sinc-square-type curve and the full width at half maximum(FWHM)can be estimated to be 159 nm.
Then we consider the linear deviation case, i.e., ?His a linear function ofz,expressed as
whereκandσare two parameters determining the range of?H. Then the joint spectral intensity can be calculated as
In Fig. 4, we show the simulation results of joint spectral intensities for ?H=±0.4 nm,±0.8 nm,±1.2 nm,and±1.6 nm.
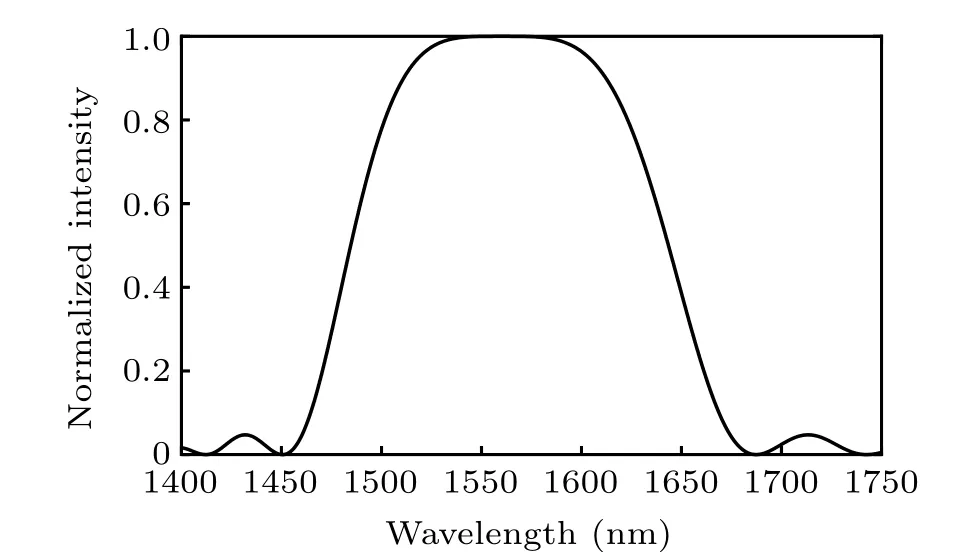
Fig.3. Joint spectral intensity of the SPDC in the designed structure.
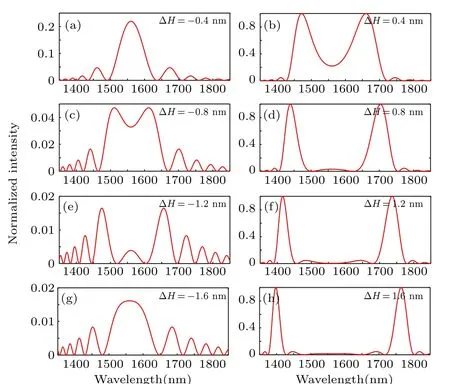
Fig.4. Joint spectral intensity of the SPDC in the PPLNOI waveguides under different homogenous thickness variations ?H, with the corresponding values of ?H shown on the top right corner.
Forκ ?=0,this model corresponds to a linear variation of thickness ranging fromσ ?κtoσ+κwhenzchanges from 0 toL. In Fig.5,we present some typical simulated results of the joint spectral intensities for several values ofκandσ.
By comparing the simulation results shown in Figs. 4 and 5 with the ideal joint spectral intensity plotted in Fig. 3,we can see that the thickness variation in several nanometers may have a distinct effect on the joint spectral intensity,such as narrowing or broadening the main peak, shifting the main peak and splitting to multi-peaks. The original peak lies at 1560 nm,namely,the designed wavelength satisfying the perfect QPM condition of ?k=0. The multi-peaks mean that,due to the thickness variations, some non-degenerate phasematching amplitudes become bigger and may surpass the degenerate term. In particular, two prominent nondegenerate peaks occur in Figs.4(d),4(f),4(h),and 5(k).In addition,from Fig.5(g)-5(i), we can find that when ?H=0 lies atz=L/2 the joint spectral intensity is not affected much by the thickness deviation, and the main peak is still at 1560 nm with a much broader bandwidth. For instance,as shown in Fig.5(i),the bandwidth can be estimated to be 293 nm,which is nearly twice the value of the original bandwidth.
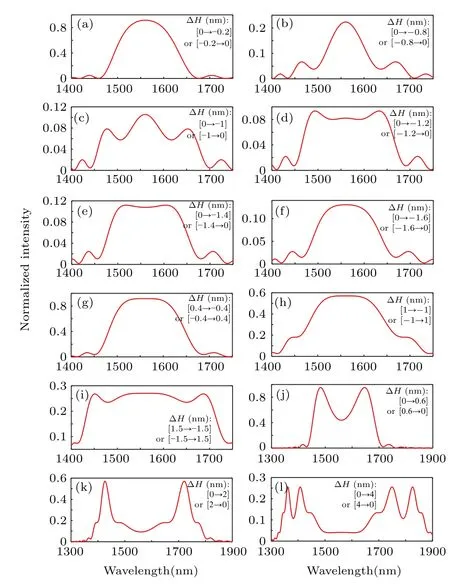
Fig.5. Joint spectral intensity of the SPDC in the PPLNOI waveguides under the linear thickness variation ?H along the waveguide, with the value ranges when z changes from 0 to L shown on the top right corner.
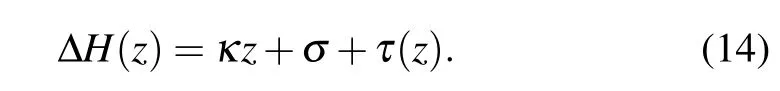
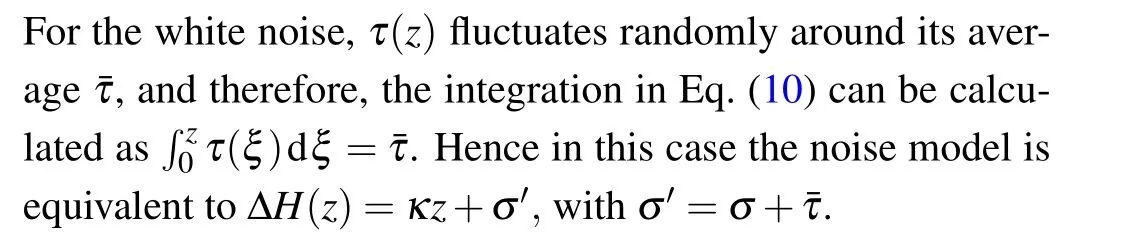
In fact, the surface of LNOI has certain irregular undulations, namely, roughness, and the root mean square (RMS)of the roughness is usually less than 1 nm.[2,8]In the entire wafer range,LNOI also has random fluctuations on thickness.For example,the commercial LNOI film from NANOLN Inc.has a thickness variation around 35 nm in a large range on a whole wafer.[33]To analyze the fluctuation noise on thickness,we introduce a noise parameterτ(z)and rewrite Eq.(11)as
The 1/fnoise is another type of noise spectrum regarding to long-range fluctuations, which is characterized by spatial correlations.[27]We model the 1/fnoise following the method in Ref.[27],and simulate the resulted joint spectral intensity.We find that the 1/fnoise can bring a distinct effect to the joint spectral intensity. We present several typical results in Fig.6,including the effects of narrowing, broadening, and splitting the central peak.
The above analysis is based on the numerical simulations of ?k. To further explain the effect in physical mechanism,we expand the signal and idler wave vectors around the central frequencies up to the second order in the detuningν, respectively,
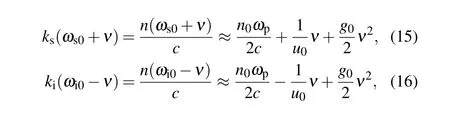
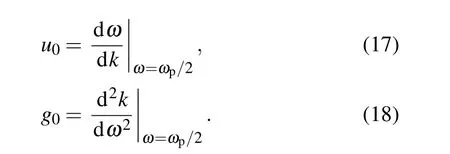
whereu0andg0are the group velocity and group velocity dispersion (GVD) of light at the central frequencyωs0=ωi0=ωp/2,expressed as
Then the phase mismatch given by Eq.(3)can be written as

In this context,with a thickness increment ?H(z),Eq.(8)becomes

With numerical simulation, we can obtain the GVD value asg0=?80×10?30s2/mm. Note that if substituting the value into Eq. (7), we would get a slightly broader bandwidth than 159 nm shown in Fig.3, as this value only considers the dispersion up to the second order. However,such approximation is adequate to explain the effect on the spectrum.
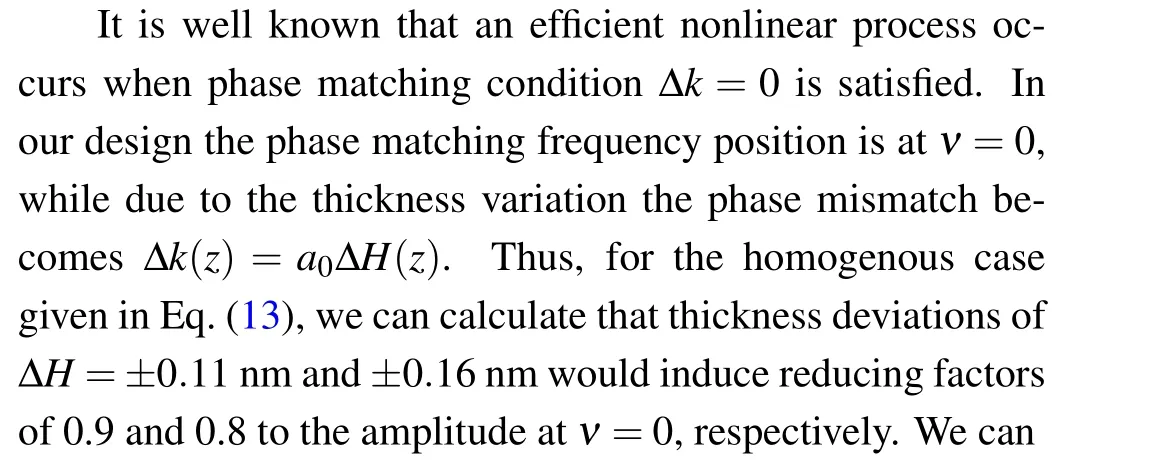
Fig. 6. Joint spectral intensity of the SPDC in the PPLNOI waveguides under thickness variations of 1/f noise model. The ranges of 1/f noise fluctuations shown in(a),(c),(e),and(g)are±0.8 nm,0.2±1 nm,±2.5 nm,and 0 to ?1.4 nm,respectively.
4. Conclusion
We presented a detailed study on the effect of waveguide thickness variations on the frequency spectrum of photon pairs generated from SPDC in the PPLNOI waveguide. We first gave a general analysis on the effect and then numerically simulated the effect of several thickness variation models,including homogenous error, linear variation, white noise, and 1/fnoise. We found that, due to the strong optical confinement in the LNOI waveguide, variations in several nanometers can have distinct effects on the joint spectral intensity. The central peak of the joint spectral intensity curve in the designed ideal case may be narrowed,broadened,and split to multi-peaks or two prominent peaks. We also found that the effects of positive and negative variations could be canceled, resulting in a variation-robust feature and a much broad bandwidth. Our study may be beneficial for the design of integrated photon sources in the LNOI platform and promote the development of LNOI-based photonic integrated technologies. Our analysis could provide a method for manipulating SPDC frequency states as well.
猜你喜歡
Chinese Physics B(2023年1期)2023-02-20
Chinese Physics B(2022年12期)2022-12-28
Plasma Science and Technology(2022年5期)2022-06-01
江蘇教育研究(2022年8期)2022-04-27
Chinese Physics B(2021年5期)2021-05-24
創新作文(1-2年級)(2019年3期)2019-09-03
中學時代(2019年6期)2019-06-26
西湖(2019年4期)2019-05-09
小溪流(畫刊)(2018年10期)2018-03-18
小學教學研究·新小讀者(2016年6期)2016-06-22
- Chinese Physics B的其它文章
- Numerical investigation on threading dislocation bending with InAs/GaAs quantum dots*
- Connes distance of 2D harmonic oscillators in quantum phase space*
- Effect of external electric field on the terahertz transmission characteristics of electrolyte solutions*
- Classical-field description of Bose-Einstein condensation of parallel light in a nonlinear optical cavity*
- Dense coding capacity in correlated noisy channels with weak measurement*
- Probability density and oscillating period of magnetopolaron in parabolic quantum dot in the presence of Rashba effect and temperature*