
Numerical simulation of laser ultrasonic detection of the surface microdefects on laser powder bed fusion additive manufactured 316L stainless steel
2022-03-04 09:57YngLiuZhixinPengShengLiuPingHu
Yng Liu, Zhixin Peng, Sheng Liu,,*, Ping Hu,,*
a The Institute of Technological Sciences, Wuhan University, Wuhan 430072, China
b School of Power and Mechanical Engineering, Wuhan University, Wuhan 430072, China
Keywords:Laser ultrasonic Numerical simulation Metal additive manufacturing Surface defects
ABSTRACT A numerical model is presented in this article to investigate the interactions between laser generated ultrasonic and the microdefects (0.01 to 0.1 mm), which are on the surface of the laser powder bed fusion additive manufactured 316L stainless steel. Firstly, the influence of the transient sound field and detection positions on Rayleigh wave signals are investigated. The interactions between the varied microdefects and the laser ultrasonic are studied. It is shown that arrival time of reflected Rayleigh (RR) waves wave is only related to the location of defects. The depth can be checked from the feature point Q, the displacement amplitude and time delay of converted transverse (RS) wave, while the width information can be evaluated from the RS wave time delay. With the aid of fitting curves, it is found to be linearly related. This simulation study provides a theoretical basis for quantitative detection of surface microdefects of additive manufactured 316L stainless steel components.
Additive manufacturing shows great potential and development prospect in the manufacturing fields, which overcomes the disadvantages of conventional manufacturing with the virtues of accelerated prototyping, short processing cycle, and energy saving,especially for metal additive manufacturing. It is widely used in aerospace, automobile, and medical fields [1]. Metal additive manufacturing is a process of producing components layer by layer through three dimensional (3D) model data [2]. However, the multi-physical field coupling process with complex production environment, concentrated energy input, and complicated molten pool behavior, would eventually affects the quality of finished parts. The temperature gradient of metal materials changes greatly in the process of metal additive manufacturing, and the rapid melting and cooling and solidification of metal powders cause large stresses in parts. When the stress reaches a certain numerical range, the cracks would occur. The existence of cracks would reduce the mechanical properties and fatigue resistance of the additive manufactured components, which are great harm on the service life. So, it is significant to apply relevant detection technology to guarantee the quality.
So far, there are a number of well-established nondestructive testing methods for defecting the flaws with the sizes of 0.01 ~0.1 mm, such as computed tomography (CT) detection, eddy current detection, and traditional ultrasound detection, etc. The CT detection can meet the accuracy requirements but would bring risk of radiation and environmental pollution, and has certain restrictions on the detection time and detection size. Eddy current testing has a good testing effect on tube, bar, and wire profiles, but it is based on the principle of electromagnetic induction. Generally,it is only appropriate to the surface and subsurface of the conductive materials. For traditional ultrasonic testing, the ultrasonic couplants are needed to contact with the samples. Furthermore,the couplant layer would affect the detection accuracy. Compared with the above technology, the laser ultrasonics has the advantages of long-distance and non-contacted. In order to ensure the quality of additive manufacturing components, the detection technology is required to meet the needs of online detection.
In 1962, White [3] discovered the phenomenon of thermal expansion on solid surface generating elastic wave, opening another way to study the ultrasound. Laser generated ultrasonic combines the ultrasonic testing with the laser technique, and has the advantages of non-contact, wide frequency band, and high resolution [4–7]. Compared with traditional ultrasonic testing, laser ultrasonic technique would not affected by the detection distance and has been widely used in defect detection of additive manufactured components [8–10]. Due to the specialty of manufacturing process, many research focused on the surface defects of metal components. In 1967, Victorov [11] proposed that the surface defects of materials could be detected by calculating the reflection and transmission coefficients of surface acoustic waves. In 1981,Portz [12] evaluated the reflection, transmission, and bulk conversion of Rayleigh waves on isotropic plates with varied thickness theoretically. In 2003, Hassan et al. [13] numerically and experimentally investigated the interaction between surface acoustic waves and semi-circular cracks with finite size and surface fracture. In 2004, Shen et al. [14] applied finite element method to quantitatively analyze the transient temperature, laser parameters,and the ultrasonic characteristics in the thermoelastic regime on the layered plates. Then, finite element models were established for layered structures to investigate the temperature gradient and transient displacement fields with varied depths on the base of thermoelastic theory of laser ultrasonics [15,16]. In 2015, Everton et al. [17] used surface waves excited by pulsed laser to detect defects in Ti6Al4V titanium alloy workpiece prepared by SLM process and obtained the highest detection resolution of 0.725 mm.In 2017, Guo et al. [18] studied the interaction mechanism between laser-generated ultrasonic and micro-defects (0.1 ~1 mm)on aluminum plate through numerical simulation and experiments,where the relationship between the defect depth and the center frequency of the surface wave were explored. In 2020, Zeng et al.[19] operated the finite element method for simulating stress corrosion cracking, in which the geometry characterization of defects under the laser-generated R-wave was investigated. In 2021, Chen et al. [20] set up an all-optical laser ultrasound system successfully assessed the rectangular surface fracture with a size of 0.5 mm by 0.4 mm based on the time-of-flight. Wang et al. [21] utilized finite element method to classify the surface crack and internal defect of the specimen with the linear data fitting of laser ultrasonic signal. In 2022, Zeng et al. [22] established LU finite element models for defect detection with different surface morphologies using COMSOL software. The propagation of acoustic wave and its interaction with surface morphology and defects were numerically analyzed. As mentioned above, most surface defect detection of metal additive manufacturing are focused on the signal processing for determining the relationship between ultrasonic and defect width and depth, while few studies have conducted on the quantitative detection of surface defects. In addition, the dimensions of the defects were mainly greater than 0.1 mm, while the surface microdefects smaller than 0.1 mm were rarely discussed. Smallest size can be distinguished by human eyes is around 0.1 mm, while the defects with the sizes of 0.01 ~0.1 mm are identified assisted by special equipment, such as radiographic testing, ultrasonic detection, and machine vision inspection, etc. In this article, defects with 0.01 ~0.1 mm (10 to 100 μm) are referred as microdefects.Actually, the presence of surface microdefects (below 0.1 mm) degrades the quality of additive manufactured components, and also increases the difficulties for inspections.
In this article, a numerical model is presented which describes the ultrasonic excitation by laser on the surface of the laser powder bed fusion additive manufactured 316L stainless steel, which is one of the most widely used stainless steel materials with excellent corrosion resistance and great mechanical properties. The additive manufactured 316L stainless steel can obtain better strength and plasticity than the 316L stainless steel made by traditional metallurgical methods. However, the density, specific heat capacity, thermal expansion coefficient, and other material parameters would affect the absorption and diffusion of heat generated by the laser, and then influence the generated ultrasonic wave. Additionally, compared with traditional 316L components, additive manufactured 316L components have varied grain size, porosity, and anisotropy, which also affected the propagation of laser ultrasonics.In this paper, the setting basis of material parameters selected for additive manufactured 316L is basically the same as that of traditional 316L stainless steel. The purpose of this paper is to provide an auxiliary reference for further experimental research of additive manufacturing components through simulation. The model focuses on the detection of defects with the size of less than 0.1 mm with multiple ultrasonic signal modes. Firstly, the transient sound field will be analyzed, and the dependence of detection positions on Rayleigh wave signals will be studied. Then, the influence of surface microdefects with varied detection dimensions on the reflected wave signal of Rayleigh wave need to be considered. During the simulation, the mathematic approximation will be applied to figure out the interactions between the microdefects and the laser ultrasonics. The multiple ultrasonic signal modes would help to distinguish the microdefects. Therefore, it is of great significance to explore the relationship between laser ultrasound and additive manufacturing defects for the adjustment of additive manufacturing process parameters to improve the quality of components.
The mechanism of laser generated ultrasonic can be divided into material ablation and thermoelastic expansion. In general, the ablation mechanism has a higher excitation ratio. However, it will cause damage to the sample, so the thermoelastic mechanism is generally adopted for the laser ultrasonic nondestructive on metal additive manufactured components. The thermoelastic mechanism used to generate ultrasound is based on thermoelastic theory.The thermoelastic equation includes the heat conduction equation and the motion governing equation, such as Eq. (1) [19] and Eq. (2) [23].
wherekis the thermal conductivity,Tis the temperature field,ρis the material density,cvis the specific heat at constant volume,qis the body heat sourceλis the Lamé’s first parameter,uis the Lamé’s second parameter,Uis the displacement vector,β=a(3λ+2u)is the thermoelastic coupling coefficient, andais the thermal expansion coefficient.
According to the thermoelastic regime, the analytical expression of ultrasonic displacement can be received by solving the thermal diffusion and thermal displacement equations. From the displacement expression, the directionality diagram of the wave can be obtained. The directional pattern of laser ultrasound depends on many different physical and material parameters.
The amplitude of the particle is regarded as a function of the angle, which is called the directivity function [24]. According to the thermoelastic mechanism, the laser source can be represented as a point source (expansion center) on the surface when the conduction terms of the source and the heat are ignored. Then, the far-field radiation pattern of the wave is a function ofmand the spatial angleθ. The directionality maps of longitudinal waveuL,transverse waveuS, and Rayleigh waveuRcan be expressed as Eqs.(3)-(5) [25],wherem=cl/csis the ratio of longitudinal to transverse wave speeds,clis the velocity of Longitudinal waves.csis the velocity of transverse waves,uris the radial displacement component,uθis the angular displacement component,ris the source length,θis angle between observation point and the normal to the centre of the line axis,cRis the velocity of Rayleigh waves, andfis the frequency.

Fig. 1. Directionality map of a Longitudinal wave, b Transverse wave, c Rayleigh wave field on additive manufactured 316L stainless steel using the pulsed laser point source in the thermoelastic regime at the detection frequency of 3 MHz.
According to Eqs. (3) to (5), the directionality diagram of additive manufactured 316L stainless steel by the longitudinal wave(L-wave), transverse wave (S-wave), and Rayleigh wave (R-wave)generated by the pulsed laser source in the thermoelastic regime at the detection frequency of 3 MHz is shown in the Fig. 1. The longitudinal wave radiates outwards in a single lobe shape on both sides of the normal line, with the maximum amplitude at an angle of about 60°. The transverse wave radiates outwards as a double lobe on both sides of the normal line, and its amplitude is maximum at an angle of about 30°. Rayleigh wave energy is mainly concentrated at the surface.
For metallic materials, the absorption of laser surface basically occurred on the surface, so the absorption of laser energy for the materials can be regarded as to be loaded on the edge of the surface. According to Eq. (1), withq= 0, the corresponding heat flow boundary equation can be written as:
In Eq. (6),Ais the optical absorption coefficient of metallic materials;I0is the power density function of laser beam focusing.f(r)andg(t)are defined as the Gaussian distribution in the space of time, respectively, and become Eqs. (7) and (8):
wherePis the laser power,r2=x2+y2withr0is the radius of pulsed laser spot, andt0is the rise time.
In the simulation, for simplicity, the additive manufactured 316L stainless steel with two-dimensional cross section is assumed to be uniform and isotropic. The laser ultrasonic signals is performed on the surface. The dimensions of the sample is set as 15 mm × 5 mm with the surface microdefect detection model shown in Fig. 2.wandhis the width and depth of the surface defect, respectively,with 4 mm away from the pulse laser center by the left boundary of the defect.To avoid the heat exchange between the internal and external of the model, the initial temperature of the sample is set as the ambient temperature, and the adiabatic conditions are applied. The initial temperature condition of the sample is expressed in Eq. (9),
The top surface of the material is set as a free boundary, and the rest boundaries are set as low reflection boundary conditions to avoid the interference of ultrasonic echo signals between the left and right boundaries of the sample,
In Eq. (10),nis the unit vector of the vertical surface,σis the stress tensor.
The initial displacement condition is written as Eq. (11),
The thermos-physical parameters of the additive manufactured 316L stainless steel and the excitation pulse in the numerical model are shown in Table 1.
In order to make sure that there is no correlation between the number of meshes divided by finite element method and the simulation results, mesh independence verification is firstly carried out.With the purpose of obtaining accurate solutions, it is necessary to set the grid size less than 1/4 of the wavelength in the calculation. By gradually encryption the grid of the excitation point of the pulsed laser, the maximum temperature change with the excitation point is shown in Fig. 3, in which it can be judged that the temperature tends to 760 K when the excitation point grid is encrypted to 300. Take into account the accuracy and speed of calculation, the grid level is selected as 300, and the size of the grid element is 1 μm at this time.
Solid heat transfer modules and structural mechanics are used to describe the multi-physical field coupling process of laser ultrasonic testing. Firstly, a model without defects is considered. Under laser irradiation, the surface temperature of the sample increases,forming a transient temperature field for the ultrasonic excitation,in which propagate to the interior of the component or along the surface simultaneously in the form of longitudinal wave, transverse wave, and Rayleigh wave. The distribution of ultrasonic displacement field at 1.0μs is shown in Fig. 4. The longitudinal wave (L),transverse wave (S), and Rayleigh wave (R) can be clearly seen in the figure. The propagation directions of L wave and S wave are consistent with the direction of sound field shown in Fig. 1. The R wave propagates along the surface of the sample to both sides of the boundary, and the vibration amplitude decreases in depth,and the energy decays rapidly. Generally, the effective propagation depth is within one wavelength. Figure 5 shows the surface ultrasonic time domain signal extracted at 5.5 mm away from the laser incident point. It can be seen from the figure that the swept pwave (SP) and swept S-wave (SS) signals arrive at the detection point first, followed by the R-wave signals. The R wave has the largest energy and amplitude.
Then, the model with a defect shown in Fig. 2 is analyzed.When the ultrasonic wave propagates to the microdefect, reflection and mode conversion occurred. Specifically, as shown in Fig. 6,when Rayleigh waves propagate along the surface of sample and then encounter defects, part of them were reflected by the left boundary of the microdefect, forming reflected Rayleigh waves(RR). Part of the Rayleigh wave propagates downward along the microdefect profile. When it meets the corner and tip of the microdefect, part of the R wave is reflected and scattered to form the mode converted longitudinal wave (RL) and mode converted transverse wave (RS). The amplitude of the RS wave is much stronger than that of the RL wave, so the RS wave can be easily identified in the detection signal. Some Rayleigh waves pass through microdefects to form transmitted Rayleigh waves (TR). The corresponding time-domain waveform is shown in Fig. 7. With the above analysis, it can be found that the Rayleigh wave contains a large amount of information related to surface defects, so it is taken as the effective data for detecting surface defects in the following analysis, and then the defect features can be effectively extracted by analyzing its signal features.
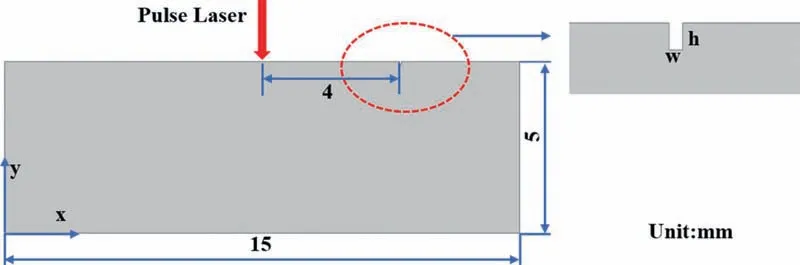
Fig. 2. The schematic diagram of the numerical model with surface microdefect detection.

Table 1 Thermo-physical properties of the AM 316L stainless steel in numerical model.
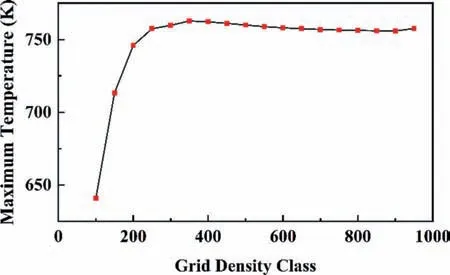
Fig. 3. Grid independence verification.
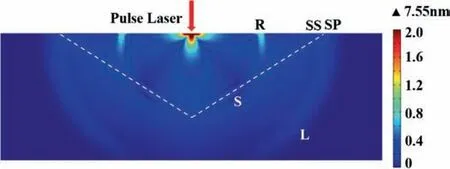
Fig. 4. Instantaneous acoustic field distribution of laser Ultrasonics (t=1.0 μs).

Fig. 5. Ultrasonic time domain signal pattern excited by pulsed laser, detection point (5.5, 0).
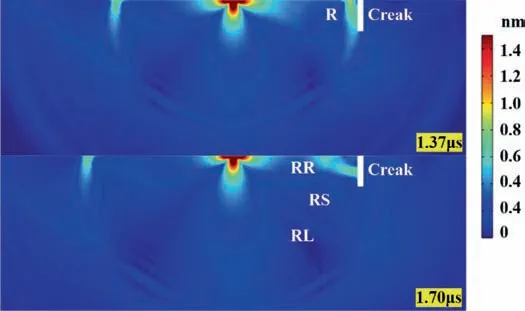
Fig. 6. Instantaneous acoustic field distribution of laser generated ultrasonic.
In the following numerical model, a groove with a width of 50 μm and a depth of 100 μm was set to simulate the surface microdefect defect, and the surface defect was 4 mm away from the pulse laser center. In order to select appropriate detection points,detection points were set at positions 2.5, 2.8, 3.0, 3.2 and 3.5 mm from the model surface to the pulse laser center to obtain Rayleigh wave signals. As shown in Fig. 8, it can be seen that the time domain of received Rayleigh waves from different detection locations are basically similar. As the detection point moves away from the laser action center to approach the defect, the arrival times of Rayleigh waves and reflected Rayleigh waves both change linearly and are easy to be overlapped, while the amplitudes are less affected within this range. Based on this phenomenon, the distance between the excitation and the detection was selected as 3 mm,and the influence of the defect size on the Rayleigh wave was further analyzed by setting defects with varied depths and widths.
To investigate the influence of the microdefect depth on the laser ultrasonic detection, the depth width of microdefect is fixed as 50 μm, and the depth is selected from 10 to 100 μm. The Y component displacement changes at different depths are shown in Fig. 9. In the amplifying image, it can be observed that the vibration amplitude of RR wave increases significantly with the increase of depth. This is because with the increase of depth, more energy of RR wave is directly reflected, but the energy of RS wave scattered at the microdefect corner and does not decrease because of the increased reflected Rayleigh wave. The reason is that the defects selected in this paper are very small, it is proposed previously that the effective propagation depth of Rayleigh waves is generally within one wavelength. With more Rayleigh waves arriving,the amplitude of mode-converted RS wave of increases with the increase of depth.
Furthermore, it is found that the arrival time of R wave and RR wave is almost the same, while the arrival time of RS wave is delayed with the increase of depth. It is indicated that the arrival time of RR wave is only related to the location of the microdefect,while the depth measurement of the defect can be evaluated from the arrival time of RS wave. It can be explained with the schematic diagram of Fig. 10, in which solid and dashed lines are represented two different propagation paths. With the increase of depthhand the distances, the arrival time of RS waves is delayed.
For the goal of characterization the depth of the microdefects with fixed width, the displacement amplitude att=1.75 μs, the RS wave peak value, and the RS wave time delay region are extracted. Firstly, the point at the moment was set as point Q shown in Fig. 11. The displacement change of Y component was applied to fit the depth of the microdefects shown in Fig. 12. Then, the linear relation expression is obtained as following:
In Eq. (12),YQis the displacement amplitude of point Q at the time of 1.75μs, and h represents the microdefect depth. The Rsquare of fitting curve is 0.99542. It is obviously thatYQincreases linearly with the increase of microdefect depth in the range of 0.01 to 0.1 mm.
Then, the RS wave peak value and the RS time delay region are also extracted as shown in Fig. 13, in which both are fitted by curves shown in Figs. 14 and 15. With the varied depth of microdefects, their linear relation are expressed as follows:
and

Fig. 9. Rayleigh waveforms of defects at different depths: a full waveforms. b amplified RR waveforms.

Fig. 10. The schematic diagram of propagation path of Rayleigh wave.
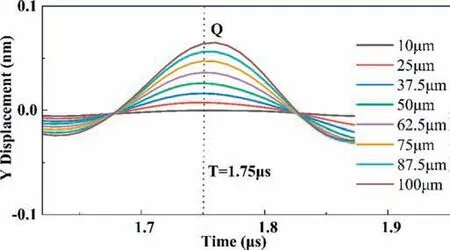
Fig. 11. Local waveform (t=1.75 μs) with varied microdefect depth.
Here,his the microdefect depth,YRSis the RS wave peak value,andTRSHis the arrival time of the RS wave. The R-square of fitting curve forYRSis 0.98262, while 0.99591 is the R-square of fitting curve forTRSH. It can be found from both fitting cures that RS wave peak value and the time dealy of the RS wave increase linearly with the increase of microdefect depth in the range of 0.01 to 0.1 mm. After comparing these variables with the increasing depths,the RS wave time delay can be considered for the simulation of the next section.
The microdefect depth was controlled to be 75 μm, and the width increased from 10 to 100 μm. For varying widths, the Ycomponent displacement were shown in Fig. 16. In the magnified image, it can be observed that the vibration amplitude of RR wave and mode-converted RS wave do not change significantly with the increase of width. The arrival time of RR waves for microdefects with different widths are similar, indicating that the arrival time of RR waves is also less dependent of the microdefects width. However, the arrival time of RS wave is delayed with the increase of the width, indicating that the delay of RS wave signal is affected by the depth and width of the microdefects. Similarly, the propagation path of Rayleigh wave in the material can be plotted as shown in Fig. 17, in which solid and dashed lines are represented two different propagation paths. With wider width of microdefects,the time of flight of Rayleigh wave are longer.
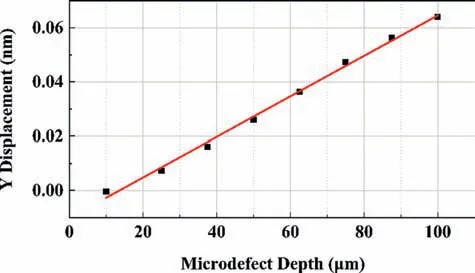
Fig. 12. Fitting curve of displacement amplitude with varied microdefect depth.
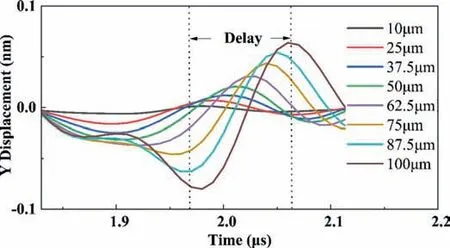
Fig. 13. Local waveform of RS wave time delay zone with varied microdefect depth.

Fig. 14. Fitting curve of RS waveform peak with varied microdefect depth.
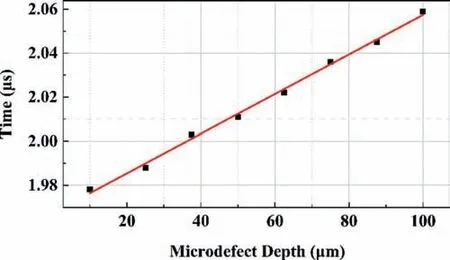
Fig. 15. Fitting curve of RS waveform delay time with varied microdefect depth.
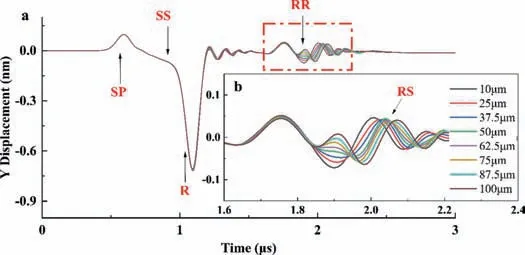
Fig. 16. Rayleigh Waveforms of microdefects with different widths: a Full Rayleigh waveforms. b amplified RR waveforms.
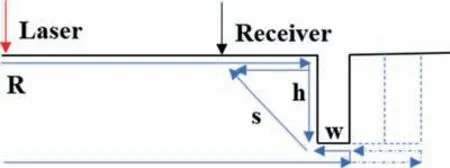
Fig. 17. Propagation Distance of Rayleigh wave with varied width.
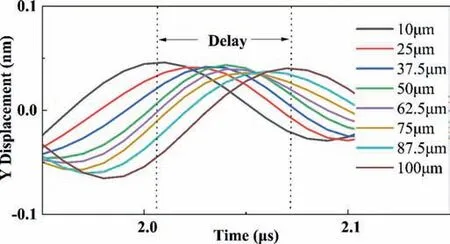
Fig. 18. Local waveform of time delay with varied microdefect width.
As suggested by the above results, the RS wave time delay is selected to extract in this part, as shown in Fig. 18. After applying the fitting curve, the linear relation is expressed as Eq. (15):whereTRSWis the the arrival time of the RS wave, and w represents the change of microdefects width. The R-square of fitting curve 0.96857. It is found that the time dealy of the RS wave shows the similar tendency, as shown in Fig. 19. Specifically, with the increase of microdefect width with the range of 0.01 to 0.1 mm, the RS wave delay longer. From this point, the chosen RS wave time delay region can be checked for further experimental verification.
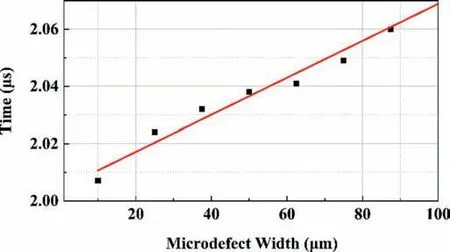
Fig. 19. Fitting curve of RS waveform delay time with varied microdefect width.
In this article, the surface microdefect detection on laser powder bed fusion additive manufactured 316L stainless steel has been studied with a numerical model of laser ultrasonic, which is in the thermoelastic regime. In the simulation analysis, the transient sound field has been analyzed, and the influence of different detection positions on Rayleigh wave signals has been investigated.The depth and width of the microdefects were investigated, respectively. With the aid of fitting curves, the interactions between the microdefects and the laser ultrasonics has been revealed. It is shown that the arrival time of RR wave is only related to the location of defects, while the dimension can be measured from the arrival time of RS wave. The feature point Q, RS wave peak,and RS wave time delay are linearly related with the depth. Furthermore, the RS wave time delay is also found linearly related with the width. This study provides a theoretical basis for quantitative detection of surface microdefects of additive manufactured 316L stainless steel. On the other hand, the size of the microdefects could be evaluated via the inversion calculations based on the relationship between the flaws and the laser ultrasonic waveforms in the future work. Then, the manufacturing process parameters might be adjusted with the assistant of recognizing the microdefects online, which will improve the quality of the additive manufactured components.
Declaration of Competing Interest
The authors declare that they have no known competing financial interests or personal relationships that could have appeared to influence the work reported in this paper.
Acknowledgements
This work is supported by the National Key Research and Development Program of China (No. 2017YFB1103900), the National Natural Science Foundation of China (No. 51605340).
 Theoretical & Applied Mechanics Letters2022年6期
- Theoretical & Applied Mechanics Letters的其它文章
- Influence of physical parameters on the collapse of a spherical bubble
- Shapes of the fastest fish and optimal underwater and floating hulls
- Determination of the full-field stress and displacement using photoelasticity and sampling moiré method in a 3D-printed model
- Constitutive modeling of particle reinforced rubber-like materials
- Predicting solutions of the Lotka-Volterra equation using hybrid deep network
- Sedimentation motion of sand particles in moving water (I): The resistance on a small sphere moving in non-uniform flow☆,☆☆