
Study on motion characteristics of Nioghalvfjerdsfjorden
2023-02-20 09:00WANGLiyanZHAOXianrenXINGZheMAYongWANGZhaoyang
Marine Science Bulletin 2023年2期
WANG Liyan,ZHAO Xianren*,XING Zhe,MA Yong,WANG Zhaoyang
National Marine Data and Information Service,Tianjin 300171,China
Abstract: The Greenland ice sheet is the planet's second most extensive body of ice,and the role of its outlet glaciers is critical in its melting process.In this study,Sentinel-1A data and offset-tracking technology were utilized to monitor the ice velocity of Nioghalvfjerdsfjorden, which was among the most important outlet glaciers in Greenland.The derived velocity was fully validated using the counterpart from nonglacial areas and the CPOM NRT IV data, thereby demonstrating the reliability of the result.Intercomparison of ice velocities in spring 2017–2019 showed that the maximum velocity of the glacier appeared an upside move during the spring of 2019,which may be attributed primarily to the enhanced basal lubrication caused by the meltwater penetrating the bedrock.
Keywords: outlet glacier, Nioghalvfjerdsfjorden, Sentinel-1A, offset-tracking, ice velocity
The polar region is the cold source of global climate change and plays a significant role in regulating global climate change.Changes in the atmosphere and glaciers of the polar regions will affect the global atmosphere or oceans directly or indirectly.(Feng Yu,2018).Greenland ice sheet is the world's second largest continental ice sheet after the Antarctic ice sheet, and its ice storage accounts for 10% of the global total ice volume.If the Greenland ice sheet completely melted, the global sea level would rise by about 6-7m(Chen Zhiqiang et al., 2015; Gregory et al., 2006).As a pivotal component of the Earth's climate system, this glacier's mass and material balance not only directly affect global sea level fluctuations, but also play a crucial role in shaping the global water cycle and marine thermohaline circulation.(Zhu Chuandong et al., 2013).Ice sheet ablation is an important part of the Greenland ice sheet material balance.It has become a hot spot in Greenland ice sheet research with the global climate keep warming up.(Yang Kang,2014).The outlet glacier is a glacier funnel extending from the highly frozen interior to the ocean (Lv Jing,2011).In Greenland, there are many outlet glaciers distributed on its edge, which are the fast transport ice belts.Thousands of surface lakes deliver meltwater to the bottom of the ice layer.It speeds up the movement of glaciers and leads to more ice flowing into the sea.The central ice cover also becomes thinner and thinner (Xie Yi, 2008).Therefore, surface movement dynamic monitoring of the outlet glaciers is of great significance for understanding the material balance of the Greenland ice sheet and even global sea level changes(Lemos et al.,2018).
At present, remote sensing image utilization is an important method of monitoring large-scale glacier movements.When using optical remote sensing for monitoring glacier movements, the range of obtained data is very limited due to the influence of bad weather such as clouds and fog.Synthetic Aperture Radar(SAR)has an active microwave imaging mode and features of all-weather, all-time, and bad weather-free such as clouds and fog(Zhao Xianren et al., 2020), which accelerates the image acquisition frequency.At the same time, based on the phase information and intensity information of radar images,using traditional differential interferometry (D-InSAR), multi aperture interferometry (MAI)(Bechornbd et al, 2006), offset tracking technology and other technical methods, the glacier surface movement speed can be extracted in a large range and high accuracy,which is an important means of glacier movement monitoring(Liu Shuang et al,2018).Two technologies,D-InSAR and MAI,utilize SAR phase data to track movements,necessitating a high level of coherence.However, due to swift glacier velocities or the extensive spatial and temporal base of SAR images, glacier areas frequently lack coherence, hindering the applicability of these technologies (Wang Qun et al., 2018).In contrast, the offset tracking technology based on SAR intensity information has lower requirements on image coherence, and can obtain absolute displacement values in both range and azimuth directions(Zhou Chunxia et al., 2015), such results in a wider application range in glacier movement monitoring.
Nioghalvfjerdsfjorden glacier, located in the northeast of Greenland, is one of the most important outlet glaciers in Greenland.In this article, using Sentinel-1A satellite images, the surface movement characteristics of Nioghalvfjerdsfjorden glacier are monitored based on the offset tracking technology, and the reliability of the results isverified.By comparing different years’results, the interannual variation characteristics of the glacier’s surface movement velocity are analyzed.
1 Offset-tracking technology
The principle of offset-tracking technology is that there are continuous identifiable features on continuous images, and the offset of two images can be calculated by measuring the displacement of the features(Wang Sisheng et al., 2016).According to the different SAR data,the offset-tracking technology can be divided into intensity tracking and coherence tracking.The intensity tracking method is more suitable for areas with low coherence and obvious surface characteristics(Zhang Xiaobo et al.,2019).The key step of the intensity tracking method is to identify the homonymous points between the reference image and the matched image.At present, the most commonly used method is the Normalized Cross Correlation(NCC)algorithm.The calculation formula is as follows:
The specific method is to select a specific window in the main image, match it with the search window in the secondary image, and calculate the cross-correlation coefficient of each position.When the cross-correlation value is maximum,the matching is completed,to obtain the total offset of the matching position.The results include not only the offset caused by glacier movement, but also the orbital error, topographic fluctuation error and ionospheric disturbance error.Among them, the orbit error, which is caused by the difference in the orbit deviation and the sensor attitude during the transit of the satellite thus results in the offset stretching and other changes in the images of different phases,can be removed by using the precision orbit data and polynomial fitting (Zhang Xiaobo et al., 2018);To eliminate the error caused by terrain, DEM is introduced as auxiliary data to improve the image registration accuracy; Finally, filtering methods can be applied to remove the offset caused by other noises such as ionospheric disturbance error.
2 Study areas and data
2.1 Study areas
Nyoghalvfjerdsfjorden Glacier, known as 79NG(79 North Glacier), is located in the northeast of Greenland, with a length of more than 70 kilometers and a width of about 20 kilometers at mid-distance(Amitrano et al., 2019).It is one of the main outlet glaciers in Greenland(Fig.1).The existing research results show that the maximum velocity of the glacier can reach 1.4 km/yr, which is usually located at the grounding line(Wang et al.,2020).Nioghalvfjerdsfjorden and Zachari? Isstr?m(ZI) are situated in the northeast of Greenland, which drain about 12% of the entire Greenland ice sheet.Its dynamic change of the edge will cause huge mass loss,resulting in sea level rise(Krieger et al.,2020).

Fig.1 Map of Geographical location of the study area
2.2 Data and methodology
Sentinel-1A is the spatial part of the Copernicus plan jointly launched by the European Union and the European Space Agency(ESA).It has the characteristics of continuous data supply, short playback cycles, fast data distribution, and wide geographic coverage(Ouyang Renxi et al.,2017).The satellite was launched in April 2014.Based on the C-band imaging system,it has a variety of imaging modes,including Stripmap(SM),Interferometric Wide swath(IW), Ultra Wide swath(EW) and Wave(WV)(Limbo, 2018).In this paper, three sets of Sentinel-1A data in spring covering Nioghalvfjerdsfjorden Glacier in different years are selected for the acquisition of glacier surface motion characteristics.The main imaging parameters are orbit elevation right view,HH polarization mode and IW mode.The specific data parameters are shown in Tab.1.

Tab.1 Parameters of Sentinel-1A data
Firstly,the ASTER DEM with a spatial resolution of 30 m is used to assist SAR image registration.Then, a search window is settled to perform cross-correlation calculation based on the Sentinel-1A image’s intensity information.The maximum number of cross-correlation is the pixel offset.When processing the Sentinel-1A image, this paper sets the search window to 128 pixels, obtains the pixel offset, removes the influence of other noises through filtering, and uses ASTER DEM for geocoding, thus obtaining the ice velocity map of the study area.
3 Result and accuracy verification
3.1 Ice flow rate extraction results
The offset- tracking technology is used to extract ice velocity from three groups of Sentinel-1A data, and the results are shown in Fig.2(a)-(c).It can be seen that the ice velocity in the core area of Nioghalvfjerdsfjorden glacier is greater than 2.0 m/d, and the local maximum ice velocity can reach about 4.0 m/d,reflecting the process that the glacier continuously injects ice into the sea at a large flow rate.

Fig.2 Motion velocity maps of Nioghalvfjerdsfjorden
3.2 Accuracy verification
To verify the reliability of the ice velocity results,this paper takes the 2017 data as an example, and comprehensively analyzes the accuracy of the drift tracking results in the study area compared with the flow velocity analysis in non-glacial areas and the verification of the internationally published ice velocity data.
3.2.1 Validation analysis of non-glacial areas
As the non-glacial bedrock area is relatively stable,its offset is 0 in theory.Research often verifies the accuracy of the offset tracking results by statistical analysis of the movement rate in the non-glacial area.In this paper,two non-glacial regions,named M and N,are selected in the study area(Fig.1),and the corresponding pixels on the corresponding ice velocity map are statistically analyzed respectively.The migration rate results of non-glacial regions are shown in Tab.2.

Tab.2 The migration rate results of non-glacial regions
Based on statistical analysis,it is evident that the movement velocities within the two non-glacial regions do not surpass 9cm/d for their mean value,nor exceed 13cm/d for their maximum value.When compared to the velocity observed in the glacier's core region, the error margin can be considered negligible,thereby affirming the reliability of the ice velocity results presented in this paper.
3.2.2 Public data validation analysis
Centre for Polar Observation and Modeling Data Portal has established the Near Real Time Ice Velocity(NRT IV)observation service system,and published the ice velocity data of Nioghalvfjerdsfjorden glacier(datadownload:http://www.cpom.ucl.ac.uk/csopr/iv/index.php).Taking 2017 ice velocity results and the CPOM NRT IV data of the same period as comparison, the ice velocities along the AB and CD directions(Fig.1) in the overlapping area are counted,which is shown in Fig.3.
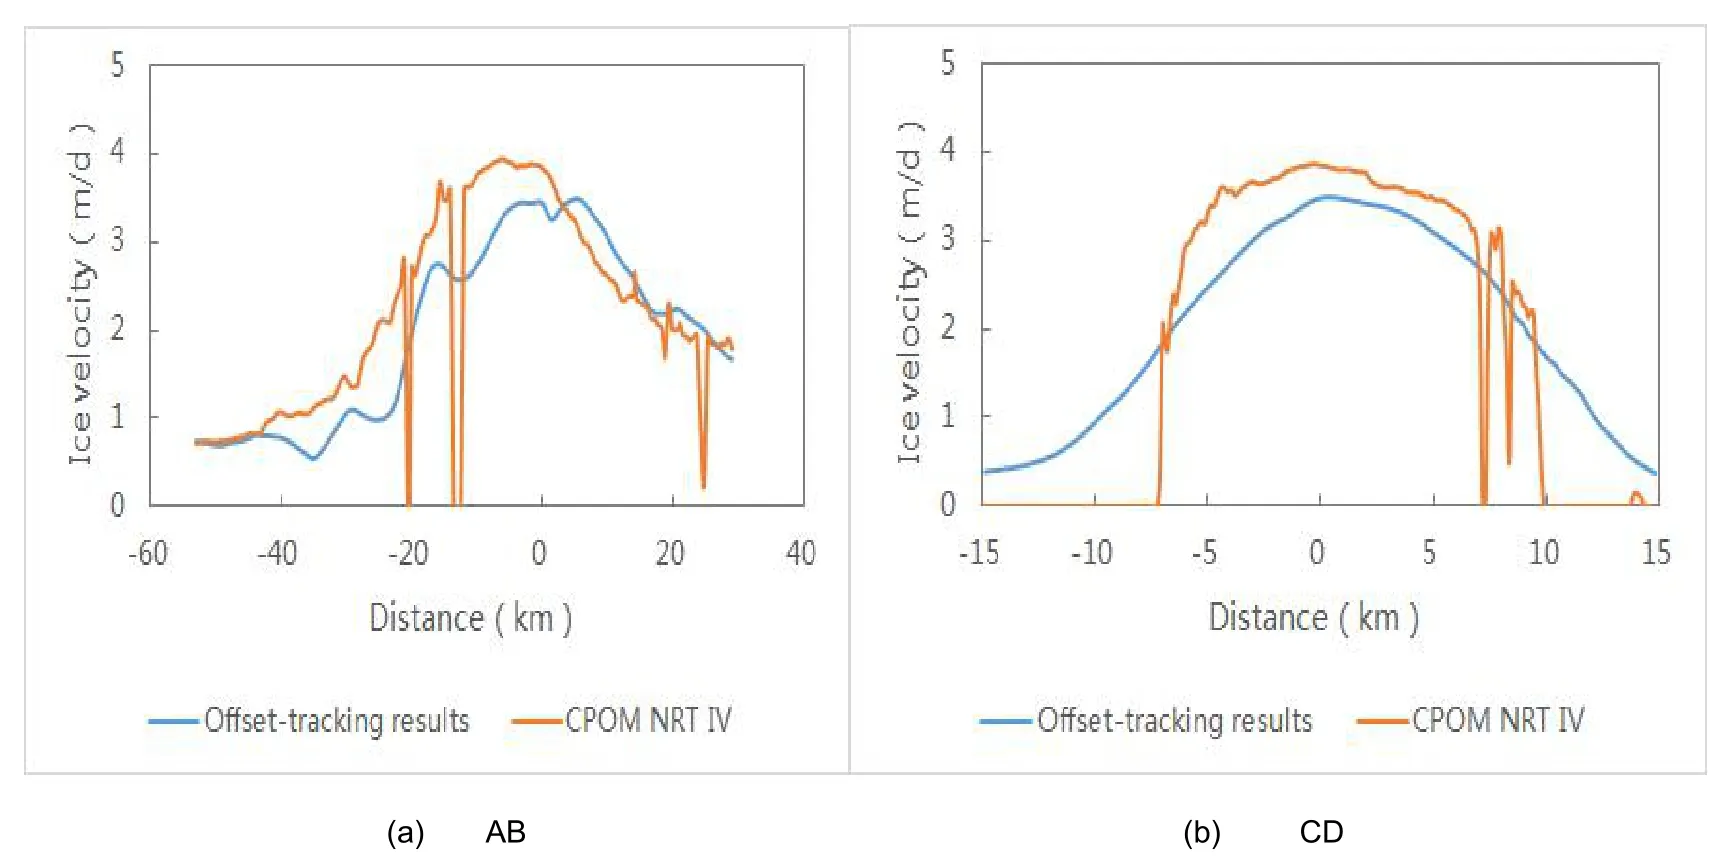
Fig.3 Ice velocities comparison results
Calculate the mean value and root mean square of the difference of the ice velocity in the two profile directions,thus verifying the reliability of the ice velocity results(Tab.3).

Tab.3 Comparative analysis of ice velocity statistical results
It can be seen from Fig.3 and Tab.3 that, the ice velocity of the two kinds of data in the direction of the two profiles shows a high degree of consistency.The difference in ice velocity on the AB and CD profiles is 0.15 m/d and 0.34 m/d, and the root mean square values are between 0.6 -0.7 m/d, with little difference in the direction of the two profiles.It shows that the ice velocity monitoring results in this paper are in good agreement with the CPOM NRT IV velocity.
4 Analysis of glacier surface movement characteristics
In order to analyze the characteristics of the interannual variation of the Nioghalvfjerdsfjorden glacier’s flow rate, this paper selects the spring data of 2017, 2018 and 2019 as research object,and extracts the ice flow rate of 4 profiles,which are along the main flow line and the vertical direction(Fig.1)and starting from A,C,E and G,respectively.The results are shown in Fig.4.Among them,AB and CD take the intersection of AB and CD as the coordinate zero point, EF and GH take their respective intersection points with AB as the coordinate zero point,AB is the position of the glacier mainstream line, and CD is the cross section close to the position of the glacier grounding line.

Fig.4 Intercomparison of ice velocities in spring during 2017-2019
It can be seen from the Fig.4, the distribution trend of ice velocity along the four profile lines of the glacier shows high consistency.Among them, the ice velocity along the AB direction of the main stream line increases at a gentle speed within a distance of about 100 km from the upper end of the glacier,and then begins to increase sharply at a distance of about 50 km from the grounding line.The ice velocity reaches a peak near the grounding line, about 3.5 m/d; From the grounding line to the end of the glacier, the ice velocity decreased significantly to about 1.6 - 1.7 m/d.Along the CD and GH directions, the ice velocity shows obvious axisymmetric curve distribution characteristics, with the maximum velocity in the middle and relatively small velocity at the edge.The distinction is the ice velocity value along CD is significantly higher than the profile line GH, the reason that CD locates near the grounding line.On the other hand, the results of ice velocity in the three periods also show some differences.First of all, along the AB direction of the profile line,the maximum ice flow rate in 2019 has moved up to a certain extent compared with the position in 2017 and 2018,suggesting that there may be a certain degree of grounding line withdrawal during this period.Combined with the literature(An et al., 2021; Mayer et al.,2018; Mouginot et al., 2015; Wang et al., 2021), the reasons for this phenomenon are analyzed, first, the melting of the glacier caused by the temperature rise, and second, the melting water on the glacier surface infiltrates the bottom of the glacier,which leads to the intensification of lubrication between glaciers and bedrock.Secondly, compared with AB,CD and GH, the ice flow velocity along the EF direction is relatively different, and there is no obvious axisymmetric distribution trend,which may be caused by the convergence with the nearby Zachari? Isstr?m glacier.
To sum up, the distribution of ice velocity of Nioghalvfjerdsfjorden Glacier in the spring of 2017 and 2018 is generally consistent, and the maximum velocity has moved up to a certain extent in 2019, which is mainly due to the intensification of bottom lubrication caused by the infiltration of glacial melt water during 2018-2019.
5 Conclusion
This paper uses Sentinel-1A as the data source, and uses the offset tracking technology to obtain the surface motion characteristics of the Nyoghalvfjerdsfjorden glacier in Greenland in the spring of 2017-2019.Taking 2017 as an example, the accuracy of the results is evaluated through the flow velocity analysis in non-glacial areas and the CPOM NRT IV data validation.Subsequently, an analysis of the inter-annual variation characteristics of glacier velocity is conducted by comparing the ice velocity monitoring results across three distinct time periods Based on the above research contents,this paper draws the following conclusions:
(a)In this paper,the ice velocity results tend to be zero in non-glacial areas,and the distribution trend and absolute value in the direction of the main line and the ground line are close to the CPOM NRT IV data, which shows that the results in this paper have high reliability.
(b) The maximum velocity of the Nioghalvfjerdsfjorden glacier is about 3.5 m/d,which is located near the profile line CD.Along the AB direction of the main stream line,it is distributed in a trend of first increasing and then decreasing, and along the CD and GH direction, it is distributed in an axisymmetric trend of large in the middle and small in the edge.
(c)Through the comparative analysis of ice velocity in three periods, it is found that the maximum velocity of the glacier has shifted upward in the spring of 2019, which is mainly due to the intensification of bottom lubrication caused by the infiltration of glacial melt water in 2018 -2019.
In the future, using the long time series InSAR data in combination with high-precision DEM,it is proposed to carry out an in-depth analysis of the characteristics of the study area’s ice velocity movement, and explore the methods of using multiple methods to jointly monitor the glacier velocity, so as to further grasp the law of glacier movement and melting characteristics.
Acknowledgement
This paper was supported by the key project of the National Key Research and Development Program "Science and Technology Powering Economy 2020"(Grant No.SQ2020YFF0426316)
 Marine Science Bulletin2023年2期
- Marine Science Bulletin的其它文章
- Sea level change and vertical land motion along Ny-Alesund coast in Arctic
- Research and application of environmental risk assessment model for marine mobile risk sources
- Study on the refined classification method of mangrove tree species based on Sentinel-2 MSI images combined with object-oriented
- Establishment and analysis of GNSS coordinate time series noise model for coastal tide stations in China
- Practice of marine data sharing:a case study of online sharing for marine data in private network environment