
Establishment and analysis of GNSS coordinate time series noise model for coastal tide stations in China
2023-02-20 09:00JINBowenWANGHuiLIUYulongDENGLijingLYUJianghua
Marine Science Bulletin 2023年2期
JIN Bowen,WANG Hui,LIU Yulong,DENG Lijing,LYU Jianghua
National Marine Data and Information Service,Tianjin 300171,China
Abstract: Based on the GNSS coordinate time series of nearly 9 years of 22 tide stations in China's coastal areas,we use the maximum likelihood estimation method to analyze the noise characteristics and establish the optimal noise model for each station.Finally,we estimate station speed by considering the colored noise.Compared with the speed and error estimated by considering pure white noise model and GLOBK result.The results show:1)All of the GNSS time series of coastal tide stations contain colored noise.The east and vertical coordinate mainly includes white noise+flicker noise,and the north coordinate mainly includes white noise + flicker noise and white noise +first-order Markov noise+ random walk noise.2) The values of white noise and flicker noise in the north and east coordinates of the three coastal areas show the law that the noise is more southward, the values of white noise and flicker noise of the vertical coordinates in south China sea are the largest.3) The speed error that considers colored noise is 5 to 10 times greater than considering only white noise and GLOBK result.4)When estimating the speed of the GNSS of tide station,the noise type should be judged first,and the color noise should be considered to estimate the speed.
Keywords: ocean station, tide station, GNSS coordinate time series, noise model,CATS
The national ocean observation network has established more than 50 GNSS continuous operation reference stations on the long-term marine environmental monitoring stations(ocean stations) along the coasts and islands of China, which are located at the same place as the tide gauge stations.It provides extremely important basic data for studying the vertical deformation of the crust and the absolute sea level change of the tide gauge stations along the coast of China.In these studies,it is the basis of research work to accurately determine the noise characteristics of the time series of the base station and then estimate the velocity information of the station.
With the continuous accumulation of GNSS coordinate time series data, the noise properties and quantitative estimation problems contained in GNSS reference station time series have gradually attracted attention.Foreign scholars Bock[1,2]et al.pointed out that the coordinate time series noise of GPS continuous observation station does not have the characteristics of pure white noise.Huang Liren[3-5]and other domestic scholars have studied the GPS reference stations and IGS stations in China.The results show that the noise contained in GPS continuous observation data contains not only white noise, but also flicker noise,and a few stations also contain random walk noise.
In fact, various types of noise are common in GNSS observation data in different regions.The tide gauge stations are located on the seaside of the mainland and islands,and some are directly arranged on the offshore platform.The GNSS of the tide gauge station has a more complex observation environment than the inland GNSS observation,and the noise in the time series is more complex.At present, most of the domestic research objects are IGS reference stations, the Crustal Movement Observation Network of China or CORS reference stations in coastal cities.However, few scholars have conducted special research and analysis on the noise characteristics of continuous observation data of GNSS reference stations built on the seaside and tide stations.In this paper, the continuous observation data of 22 GNSS reference stations along the coast of China are selected.Using CATS[6]software,the maximum likelihood estimation method is used to quantitatively estimate the noise content of each station by combining different noise models in the coordinate time series.According to the characteristics of each region,the optimal noise model is analyzed one by one.Then, the optimal noise model is used to determine the velocity of each station, and the velocity value is compared with the GAMIT/GLOBK calculation results to analyze the influence of different noise models on the velocity estimation of the station.On this basis, some suggestions are put forward for GNSS data processing of tidal stations.
1 Method of GNSS time series noise analysis
1.1 GNSS data processing of China coastal tide stations
The following steps are used for GNSS data processing of the national ocean observation network: Firstly, GAMIT software is used to solve IGS reference station and the GNSS station of the marine observation network with the same strategy to obtain the baseline solution vector.Then,the coordinates and velocity values of the global IGS station in the ITRF2014 framework are selected as constraints, and the GLOBK software adjustment is used to process the single-day relaxation solution.Finally, the time series analysis is carried out by using GLOBK, and the gross errors are eliminated by using the difference between two adjacent observations[7]and the manual interpretation method,and then the final time series is obtained by multiple iterative adjustment.Using the above method to process the GNSS data of the tide station in the past 9 years,it is concluded that the repeatability of the horizontal component of the coordinate time series is better than 5mm,and the repeatability of the vertical component is better than 10 mm.
GNSS time series contain a variety of information about the crust, including linear velocity, offsets caused by different causes, periodic changes, and other noises.In this paper, the coordinate time series model of reference[8]is used to fit the coefficients in the model by using the time series analysis software GAMIT / GLOBK and CATS.The model parameters are calculated for each coordinate component time series of the station, and then the observation noise time series is obtained, and the noise characteristics are analyzed.
1.2 Noise analysis
The spectrum analysis method and the maximum likelihood estimation method are two commonly used noise analysis methods.For the noise time series of GNSS time series after deducting the fitting value, the noise type can be obtained by using the power law relationship between the noise power spectral density and its corresponding noise frequency.In this paper, the spectral index of noise is analyzed by using the model in literature[9].
The maximum likelihood estimation(MLE) is a nonlinear least squares method.By adjusting the covariance matrix to maximize the likelihood function, the noise model closest to the time series can be obtained.Assuming that the observations follow Gaussian normal distribution,the maximum likelihood function can be expressed as follows[10]:
The covariance matrix can express the white noise model, the colored noise model and their different combinations.For example, the white noise model includes the simple white noise model(WH) and the variable white noise model(VMN).Colored noise models include flicker noise model(FN),random walk noise model(RWN),first order Gauss Markov noise model(FOGM),power law noise model(PL)and band pass noise model(BP)[11].
2 GNSS noise characteristics of tide measuring station
2.1 Spectral index analysis
Assuming that GNSS has WH+PL noise, the maximum likelihood estimation method(MLE) is used to calculate the spectral index of GNSS coordinate time series of 22 tide stations( see Tab.1), No.1 - 7 are stations in the North Sea( including the Yellow Sea and the Bohai Sea ),No.8 -15 are stations in the East China Sea, and No.16 -22 are stations in the South China Sea.According to the spectral index of each station, the horizontal component spectral index of most stations is between -2 and -1, and the vertical component spectral index is between -1 and 0.This shows that the coordinate component noise of each station does not have the characteristics of pure white noise.The horizontal component of GNSS in the tide station is mainly white noise + flicker noise + random walk noise, and the vertical component is mainly white noise + flicker noise.The noise characteristics of different coordinate components of the same station are not exactly the same, so the different coordinate components of each station should not be analyzed by the same noise model.
Tab.1 Spectral index of tide GNSS stations coordinates time series
2.2 Optimal noise model analysis
In order to further determine the noise characteristics of different coordinate components of each station, according to the results of spectral index analysis and considering the periodic term of station change and the certainty of colored noise, this paper assumes that there may be FN,RWN,FOGMN and PLN in the time series except for WH.Therefore, seven noise models, WH, WH+FN, WH+RWN, WH+FN+RWN,WH+FOGM, WH+FOGM+RWN and WH+PL, are selected to calculate the MLE values under different noise models according to the maximum likelihood estimation principle.The reliability of the model is usually judged by the size of the MLE value,that is,the larger the MLE, the more reliable the result.Taking Tanggu station as an example, the maximum likelihood estimation method is used to calculate the MLE value of each model.Then, the optimal noise model is determined by using the same criteria as in reference[12], and the difference between the WH model and the other six models MLE is calculated(Fig.1).The results show that the MLE difference of WH+FN, WH+FN+RWN, WH+FOGM,WH+FOGM+RWN and WH+PL models is less than 3.0.The MLE difference of WH+FN,WH+FN+RWN and WH+PL models is less than 3.0,and the MLE difference of WH+FOGM and WH+FOGM+RWN models is less than 3.0.The MLE difference between the vertical components WH+FN+RWN, WH+FOGM+RWN and WH+PL models is less than 3.0, and the discrimination is low.The models with the largest MLE values in the east and north coordinates of TGU station are WH+FOGM and WH+FOGM+RWN,and the model with the largest MLE value in the vertical component is WH+FOGM+RWN.

Fig.1 MLE Error between WH and other noise model of TGU station
However, as the parameters contained in the noise model increase, the MLE value increases,so the optimal noise model cannot be simply judged by the MLE value.In order to ensure the reliability of the results, this paper further uses the conservative estimation criterion proposed by Langbein[13]et al.to judge and select the optimal noise model of each station.Taking the elevation component of TGU station as an example, the MLE values of WH+FN and WH+RWN models are calculated respectively, and the model with larger MLE value is selected as the null hypothesis(the MLE value of the WH+FN combined model of the vertical component of TGU station is larger as the null hypothesis).Then, the MLE values of the WH+PL and WH+FN+RWN models are compared with the null hypothesis respectively.If the MLE difference is greater than 2.6,the null hypothesis is rejected and the model is considered to be better.Otherwise, the selected model is considered to be invalid.The difference between the MLE values of the WH+PL and WH+FN+RWN models of the vertical component WH+PL and WH+FN+RWN models and the zero hypothesis MLE is greater than 2.6,so the WH+PL model with a larger MLE value is selected as the optimal model.Finally, the MLE values of the WH+FOGM and WH+FOGM+RWN models are compared with the MLE of the optimal model.In this paper,the threshold of WH+FOGM+RWN model and WH+FOGM model is set to 5.2[14].The MLE difference between the vertical components WH+FOGM and WH+FOGM+RWN models and the WH+PL model at TGU station is less than 5.2,so the optimal noise model is finally determined as the WH+PL model.
3 GNSS noise distribution of tide measuring station
3.1 Noise size and distribution
The same method as TGU station is used to analyze the time series coordinate components of other stations one by one, and the statistical results of the optimal noise model of each station and the noise size of each model are obtained(see Tab.2,unit/mm).The statistical results of white noise and flicker noise in each sea area are shown in Fig.2.According to Fig.2 and Tab.2, it can be concluded that the GNSS observation noise of coastal tide stations has the following characteristics:
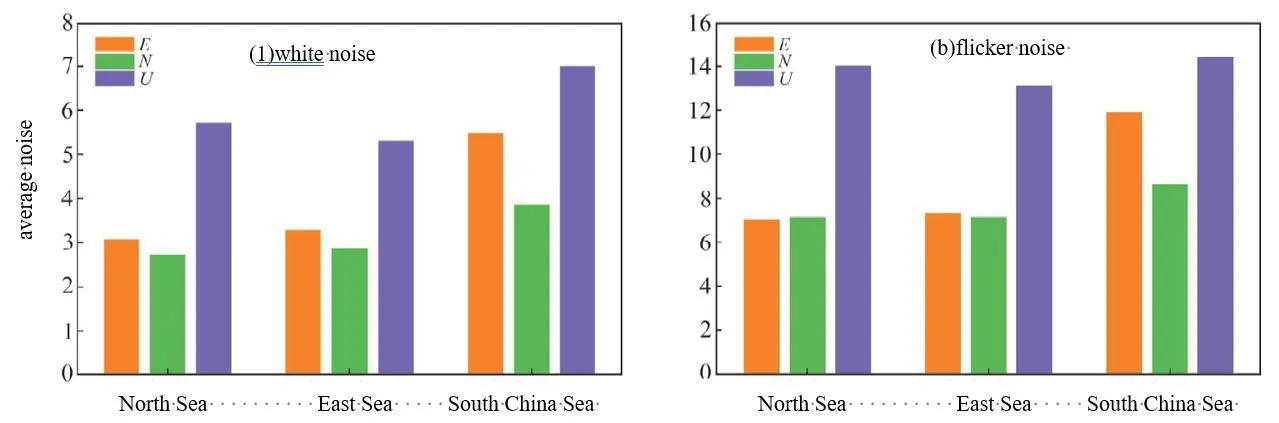
Fig.2 Average noise factor of each sea area(a:white noise;b:flicker noise)

Tab.2 Optimum noise model and noise factor of each station coordinates time series(mm)
a)There is diversity in GNSS noise of coastal tidal stations.The best noise model of E coordinate component is WH+FN(72.7%), WH+PL(18.2%), and WH+FN+RWN(9.1%).The best noise models of N coordinate component were mainly WH+FN and WH+FOGM+RWN, accounting for 36.4% and 27.3% respectively, WH+FOGM accounted for 18.2%, and the rest were WH+PL and WH+FN+RWN.The U coordinate component optimal noise model WH+FN accounted for 72.7%, WH+PL accounted for 13.6%, and the rest were WH+FOGM, WH+FOGM+RWN and WH+FN+RWN.
b) The N, E and U coordinate components of GNSS in coastal tide stations have certain characteristics in regional distribution.In addition to white noise and flicker noise,the E coordinate component of most stations in the North Sea area also has a certain degree of random walk noise and power-law noise.The E coordinate component of the East Sea and the South China Sea is white noise + flicker noise, except that the Shantou station(STO) contains power-law noise.In addition to the white noise at most stations along the coast of China, the N coordinate component of most stations in the North Sea also has some flicker noise.In addition to the white noise in the East Sea and the South China Sea, nearly 60% of the stations also have first-order Markov noise.Nearly 50% of the stations along the coast of China have random walk noise, which is irregularly distributed.The U coordinate component of the three sea areas mainly has white noise and flicker noise.More than 80% stations, it’s U coordinate component noise is greater than N and E coordinate component noise.
c) From north to south, the white noise and flicker noise of N and E coordinate components in the three sea areas basically show the law that the more southward the noise is greater.The white noise and flicker noise of U coordinate component in the East Sea are smaller than those in the North Sea and South China Sea, and the U coordinate component noise in the South China Sea is the largest.This phenomenon is related to the stability of the ionosphere over China, indicating that the ionospheric disturbance has a great contribution to the scintillation noise.At the same time,it also verifies that white noise and flicker noise have a certain latitude dependence.The NSA and XSA stations in the South China Sea are located to the south of 17°N and far from the mainland, and have significantly larger white noise and flicker noise than other coastal stations in the mainland.
3.2 Velocity estimation considering the optimal noise model
In this paper, the optimal noise model is used for the GNSS time series of 22 tidal stations, and the velocity and error of each component are calculated by the maximum likelihood estimation method.The results of the optimal noise model of each station are compared with the velocity values calculated by the white noise model and the velocity values obtained by GAMIT/GLOBK(see Tab.3,unit mm/a).

Tab.3 The speed and uncertainty of each station under different noise model
a)When only white noise is considered, the mean velocity error (the mean values of N, E and U directions are 0.06 mm/a, 0.08 mm/a and 0.18 mm/a, respectively) is significantly smaller than that of colored noise (the mean values of N, E and U directions are 0.43 mm/a, 0.54 mm/a and 0.94 mm/a, respectively), which is basically the same as that of GLOBK (the mean values of N, E and U directions are 0.04 mm/a, 0.05 mm/a and 0.16 mm/a).The mean square error of velocity considering colored noise is 5 - 10 times that only considering white noise, and this difference is larger than that of inland observation station (Tian Yunfeng[9], 3 - 6 times; Jiang Zhihao[15], 2 - 6 times; Zhang Yanfen[16],4-7 times).It reflects that the scintillation noise of the GNSS observation station of the tide station is greater than that of the inland station.
b)The velocity difference between the horizontal component obtained by the optimal noise model and the velocity obtained by the white noise model is very small(the average velocity difference of N and E coordinate components is 0.1 mm/a and 0.2 mm/a), and the velocity difference of vertical component is slightly larger than that of horizontal component(the average velocity difference of U coordinate component is 0.3 mm/a).The horizontal component velocity difference obtained by the optimal noise model and GLOBK is very small(the average velocity difference of N and E coordinate components is 0.2 mm/a and 0.2 mm/a), and the vertical component velocity difference is slightly larger than the horizontal component (the average velocity difference of U coordinate component is 0.3 mm/a).The speed obtained by the white noise model is basically the same as that obtained by GLOBK.
When there is colored noise in the station sequence, the reliability of the velocity error estimation obtained by directly using the white noise model or directly using GLOBK for time series analysis is not correct.In order to obtain the correct speed value, the influence of colored noise should be taken into account.
4 Conclusion
Through the analysis of the time series of the GNSS continuous operation observation station of the tide station,the following conclusions are obtained:
a) The GNSS time series of coastal tide stations contain colored noise.In the E coordinate component, the combined noise characteristics of white noise + flicker noise are dominant.In the N coordinate component, the combined noise characteristics of white noise + flicker noise and white noise + first-order Markov noise + random walk noise are dominant.In the U coordinate component, the combined noise characteristics of white noise+flicker noise are dominant.
b)There is a certain latitude dependence of white noise and flicker noise.From north to south, the white noise and flicker noise of N and E coordinate component in the three sea areas basically show the law that the southerly noise is greater.The white noise and flicker noise of U coordinate component in the East Sea are smaller than those in the North Sea and the South China Sea, and the U coordinate component noise in the South China Sea is the largest.The noise of U coordinate component is greater than that of N and E coordinate component in more than 80%of the stations,which reflects that the accuracy of U coordinate component is lower than that of N and E coordinate component.
c) When the white noise is considered only, the estimated mean square error of velocity is significantly smaller than that of the optimal model for estimating colored noise,but it is basically the same as the mean square error of velocity obtained directly by GLOBK.The mean square error of velocity estimated by GNSS time series of tide stations with colored noise is 5 - 10 times of that obtained by only considering white noise and GLOBK,and the difference is larger than that of inland observation stations.
d) In the velocity analysis of GNSS time series of tidal stations, due to the presence of colored noise in the sequence, the reliability of the velocity error estimation obtained by directly using the white noise model or directly using GLOBK for time series analysis is not optimistic.In order to obtain the correct velocity value, the type of noise should be accurately judged first, and then the influence of colored noise should be taken into account to estimate the station velocity.
 Marine Science Bulletin2023年2期
- Marine Science Bulletin的其它文章
- Sea level change and vertical land motion along Ny-Alesund coast in Arctic
- Study on motion characteristics of Nioghalvfjerdsfjorden
- Research and application of environmental risk assessment model for marine mobile risk sources
- Study on the refined classification method of mangrove tree species based on Sentinel-2 MSI images combined with object-oriented
- Practice of marine data sharing:a case study of online sharing for marine data in private network environment