
Sustainable catalytic graphitization of biomass to graphitic porous carbon by constructing permeation network with organic ligands
2023-02-28 00:31PengfeiLiuWenqiaoDuXiangjingLiuLongZhangZhiminChen
Pengfei Liu, Wenqiao Du, Xiangjing Liu, Long Zhang, Zhimin Chen
Jilin Provincial Engineering Laboratory for the Complex Utilization of Petro-Resources and Biomass, School of Chemical Engineering, Changchun University of Technology, Jilin 130012, China
Keywords:Catalytic graphitization EDTA-iron Rice husk Porous carbon Graphite
ABSTRACT Common strategies for catalytic graphitization of biochar into graphitic porous carbon (GPC) still face great challenges,such as the realization of simple procedures,energy conservation,and green processes.Controlling over the graphitization degree and pore structure of biochar is the key to its structural diversification.Herein, a clean and energy-efficient method is developed to synthesize adjustable graphitic degree and structure porosity GPC from rice husk-based carbon (RHC) at a relatively low temperature of 800-1000°C with environment-benign organometallic catalyst ethylenediaminetetraacetic acid ferric sodium salt (EDTA-iron) and the recovery ratio of catalyst is as high as 97%.The formed by the organic ligands of EDTA-iron facilitates the etching of RHC surface and pore by iron, resulting in highly graphitized and developed porous GPCs.The pore structure and graphitization degree of GPCs can be adjusted by altering the catalyst loading,temperature,and holding time.The catalyst EDTA-iron with a lower concentration mainly plays the role of etching, which promotes the formation of porous carbon with larger surface area (SBET = 1187.2 m2·g-1).The catalyst with higher concentration mainly plays the role of catalyzing graphitization and promotes the obtaining of graphitic carbon with high graphitization degree(ID/IG = 0.19).The mechanism of EDTA-iron catalyzed graphitization of RHC is explored by the comprehensive analysis of BET, XRD, Raman, TEM and TGA.This research not only provides an efficient method for the preparation of high-quality biomass-based graphite carbon, but also provides a feasible method for the preparation of biomass-based porous carbon.
1.Introduction
With the continuous expansion of the interest on different allotropes of ordered carbons, graphitic carbon materials have been heavily investigated in recent years.Due to graphite’s remarkable physicochemical properties, such as excellent thermal stability,electrical conductivity, and corrosion resistance, graphitic porous carbon (GPC), the material integration of graphitized carbon and porous structure,is gaining a wide range of applications as a strategic material.For example, conductive media used in key energy technologies such as batteries or capacitors requires good conductivity and effective ion transmission path (high effective specific surface area) [1].Materials for corrosion and heat resistance must be combined with suitable fillers at a highest possible graphitization level [2].The realization of all these materials’ applications mostly relies on fossil sources, including natural deposits [3] and petroleum-based materials [4].Furthermore, it is conventionally obtained under complex synthesis conditions, high temperature(2000 to 3000 °C) or high pressure (up to 5.0 GPa) [5], which constantly causes environmental pollution and enhances energy consumption.Therefore, the search for suitable alternative energy sources and the research on environmentally friendly graphitization methods have become the main challenges currently facing.
Biomass,as a sustainable resource,possessing prolific aromatic compounds in nature, has the fundamental characteristics of replacing fossil energy[6].For example,rice husk(RH),the production of rice by-products results in the waste of huge amounts of resources and severe pollution of the environment [7].Driven by natural selection for millions of years, RH have obtained natural and orderly vascular bundle structure(self-templating).Even after physical or chemical treatment, some of the pore structure can be maintained [8].It will be possible to generate GPC with regular geometry, consistent pore size distribution, and high specific surface area because of the natural pore template.There have been many studies on the preparation of porous carbon from biomass as adsorbent and energy storage materials, such as coconut [9], rice husk [10], seaweed [11], soybean [12], etc.But in essence, most of biomass are amorphous hard carbon,and it is difficult to obtain highly orientated ordered graphite even when heated to 3000 °C.Hence,a more efficient graphitic method is needed for the graphitization of bio-based hard carbon.
One popular strategy to lower the graphitization temperature and enable the easy graphitization of hard carbons is catalytic graphitization[13].For example,Jiang et al.[14]used Joule heating(above to 2200 °C) to obtain highly graphitic carbon (ID/IG= 0.15)from lignin with no catalyst.Jin et al.[15] utilized molten CaCl2to prepare graphite nanosheets with high crystallinity at 800 °C with simple cathodic polarization in an electrochemical method.Gong et al.[16] reported a one-step synthesis of threedimensional porous graphitic carbon (ID/IG= 0.62) with 1732 m2·g-1of BET surface area from bamboo with potassium ferrate (K2FeO4) at 800 °C.These studies show that inorganic transition metal salt catalysts, such as Fe [17], Co [18], Ni [19], can successfully prepare graphitization carbon at temperatures below 1000 °C.Nevertheless, there exists difficulty in sustainable use of inorganic transition metal catalysts after graphitization and the post treatment of the inorganic anions (Cl-, NO-3, SO2-4and so on),which greatly affects the practicability of the technology,especially for the sustainable and efficient production of high-purity graphite from biomass.
In this paper,we reported a facile strategy to prepare high crystalline (ID/IG= 0.19) and high-quality (over 96%, C element) GPC from rice husk-based carbon (RHC) with a bifunctional catalyst of ethylenediaminetetraacetic acid ferric sodium salt (EDTA-iron) at lower temperatures of 800-1000 °C.The graphitization degree and pore structure of GPC can be adjusted by changing the ratio of RHC to EDTA-iron and holding temperature.And the iron can be recovered by organic acid, EDTA and regain the catalyst,EDTA-iron.Therefore, the sustainable preparation of high-quality graphite from biomass-based carbon is realized.
2.Materials and Methods
2.1.Material
Rice husk (RH) originated from Shijiazhuang DASONG agricultural planting Co., Ltd.in China.Flake graphite (carbon purity of 99.5%, 10000 mesh (1.3 μm)) was purchased from Schwarzwald Biotec.Co., Ltd; sodium hydroxide (NaOH) (ACS, 97%), EDTA-iron,ethylenediaminetetraacetic acid (EDTA) (99%) were purchased from Aladdin Biochemical Technology Co., Ltd (Shanghai China)and used as received.
2.2.Graphitic porous carbon (GPC) preparation
2.2.1.Graphitization carbon precursor preparation
Rice husk-based carbon(RHC)was prepared by carbonization at 600°C and silicon-dissolution with hot alkali from RH.Specifically,the carbonized rice husk was passed through a 100-mesh(150 μm)sieve.Subsequently, the carbide was mix with 5% NaOH solution with a solid-liquid ratio of 1:10,and heat it to boiling for 4 h.After filtering,washing and drying under vacuum conditions at 80°C for 24 h, the RHC was sieved with a 200-mesh (74 μm) sieve.The EDTA-iron (1-8 mmol) and the RHC powder (1.0 g) were put into a 50 ml polytetrafluoroethylene (PTFE) box into the ball milling machine (XQM-0.4 L, TENCAN POWDER Corporation, Changsha,China).The milling duration was set at 4.0 h, and the mass ratio of agate ball to RHC powder is of 4:1,making them a uniform mixture for graphitization use.Full details of all process parameters design are listed in Table S1 in the Supplementary Material.For example, ‘‘GPC-700′′refers to the product obtained by graphitization of 7 mmol EDTA-iron/1.0 g RHC at 700 °C for 1 h.
2.2.2.Catalytic graphitization procedure
The ball-milled mixtures of RHC and EDTA-iron were put into an atmosphere furnace (SG-XQL 1700, SIOM, Shanghai, China) in the closed nitrogen atmosphere for heat treatment.First, the organic component of the EDTA-iron was carbonized by raising the atmosphere furnace from 25 to 600°C at a heating rate of 10°-C·min-1.Then the samples were continuously heated to 800-1000 °C at a heating rate of 2 °C·min-1, and held 3.0 h to proceed the catalytic graphitization.After cooling to room temperature,the products were treated with 1.0 mol·L-1EDTA solution(100 ml) under ultrasonication at 80 °C for 2.0 h.After standing overnight at room temperature, the solid-liquid mixture was filtered and separated into powder and filtrate.The powder samples were washed with 20% (mass) aqueous alcohol solution.Finally,GPCs were obtained by drying at 80 °C for 12 h.For comparasion,the precursor carbons were put into a tube furnace (OTF-1200X,HF-Kejing, Hefei, China) under a flow of N2.The other parameters were kept constant.The details of the graphitization parameters are summarized in Table S1.
2.3.Transition metal (Fe) recovery
The filtrate from the previous step was placed in a container overnight.Then 0.1 mol·L-1NaOH was used to adjust its pH to 5.0,after that the filtrate was added to a rotary evaporator,evaporated to half gelatin, following cooled down to room temperature.Samples precipitated by equal volume 99%ethanol solution,finally the precipitate was dried at 80 °C for 12 h to obtain the recycling EDTA-iron.The ethanol solution is collected for next run use.
2.4.Characterizations
Thermogravimetric (TG) analysis, differential thermogravimetric (DTG) analysis and mass spectrometry (MS) of samples were conducted by the simultaneous thermal analyzer (STA449F3/QMS403, Netzsch, Germany).Nitrogen sorption measurements were carried out on a Micromeritics TriStar II 3020 analyzer,samples were degassed and dehydrated at 180 °C for 12 h.The Brunauer-Emmett-Teller surface area(SBET)and pore size distribution (PSD) of GPCs were calculated by Brunauer-Emmett-Teller(BET) and Barret-Joyner-Halenda (BJH) methods, respectively.High-resolution scanning electron microscopy (HRSEM, JSM-7610, JEOL) and scanning electron microscopy (SEM, JSM-6510,JEOL) were used to observe the surface morphology of GPCs.Raman data were recorded using a micro confocal Raman spectrometer with a 50× air objective.Raman spectra were measured with a 532 nm excitation laser (Lab RAM HR evolution, Horiba Jobin Yvon SA, France) and recorded to study the properties of D and G bands over the range 3500-1000 cm-1.X-ray powder diffraction (XRD) measurements were performed on a SmartLab X-ray diffractometer in the range of 10°-90° 2θ at room temperature.Cu Kα radiation(λ=0.15406 nm)was used with an X-ray tube operating at 40 kV and 30 mA.All analyses and fitting of the peaks were conducted on MDI Jade version 9 software (Materials Data Inc, Liverpool, CA).Transmission electron microscopy imaging(TEM), selected area electron diffraction and analysis (SAED) and energy dispersive spectra (EDS) mapping were prepared by using JEOL-200(HRP)at 200 kV.Fourier transform infrared(FT-IR)spectra was recorded on a Nicolet IS10(Thermo Fisher,USA)using KBr pellets and 32 scans.Electron binding energy and element content of GPC were characterized by X-ray photoelectron spectra (XPS)(ESCALAB250, Thermo Electron, USA).The content of metal (%,mass) was measured by inductively coupled plasma optical emission spectrometer (ICP-OES) (IRIS Intrepid II XSP, Thermo Fisher,USA).
3.Results and Discussion
3.1.Micro-structural and surface characterization
The microscopic morphology of RHC and GPC were observed by SEM as shown in Fig.1.RHC and GPC are inhomogeneous blocks with the grain sizes of about 5-60 μm.Fig.1(a) shows a typical SEM micrography of RHC with rough surface and native macroporous structure.After graphitization, there was a form of corallike structure stacked with each other in a ridge shape due to the carbonization of organic ligands of EDTA-iron and the melting of iron droplets after annealing (Fig.1(b)).The iron solid particles are generally around 2 μm,existing over the GPC’s surface.Similar evidence of metal aggregation has been observed in previous studies[20,21].The TEM analysis reveals the presence of iron phase in GPC,with the graphitized layer showing an onion-like distribution around the iron phase, and a graphene-like layer being evident at the periphery in Fig.S1(a).Additionally, the EDS mapping proves that iron and graphitized carbon are uniformly dispersed with each other(Fig.S1(b)).The atomic percents of Fe,C and O,were 24.21%,73.46% and 2.33% (Table S2).Following a mild acid washing, graphite microcrystals exhibiting a layered stacked structure and smooth surface are clearly visible at high resolution(Fig.1(c)).Furthermore,at the upper right corner of Fig.1(c),there appear a large number of graphite microcrystals(0.1-0.5 μm)that stack or aggregate with each other.When the dosage of EDTA-iron is 4 mmol·g-1,the abundant porous structure can also be clearly seen from Fig.1(d),which might be formed by the etching effect and activation of EDTA-iron on RHC.
A typical TEM image of onion-like graphite carbon formed by catalytic graphitization of GPC-1000 as shown in Fig.2(a).The SAED patterns represent both apparent single-crystal diffraction spot patterns and polycrystalline derived diffraction rings, which indicates the existence of graphitic structures with polycrystalline structures.Equally, the high-resolution transmission electron microscopy (HRTEM) confirms the representative observation of graphite layered structure from Fig.2(b).There are turbostratic stacked structures in graphite [22].Reflected in the selecting a square area of stacked graphite layers by fast Fourier transformation (FFT), it is estimated the distance between layers around 0.336-0.360 nm, which is closed to the ideal stacked layer of graphite (0.335 nm).The inset of part Fig.2(a) shows two kinds of existence environment for graphite microcapsules:one as the surrounded boat and the other as the egg growing on branches.It is possible that the former refers to the iron droplets displacing the surrounding carbon, whereas the latter refers to the transport and replacement channel formed after the accumulation of iron droplets.To verify the dispersion of the Fe element (Fig.2(c)),EDS was used to quantify the elemental mapping.The standardless quantitative EDS analysis revealing GPC’s mass ratio of C:O:Fe:Si is 0.974:0.011:0.008:0.007 in Fig.2(c) and (d).While the O and Si mainly belongs to biomass itself left from desiliconization, the C element of the high proportion confirms that GPC is of high purity.This is also confirmed by ICP-OES (Table S3).The Fe element content of GPC-1000 is 0.017%.

Fig.2.(a,b)TEM images of the GPC-1000 and(a and b,insert)locally magnified TEM images,the SAED patterns and detailed(0 0 2)lattice fringes of ordered graphitic regions of the areas indicated by red square, (c,d) corresponding EDS mapping and its standardless quantitative analysis report of the GPC-1000.
XPS was used to investigate the components and surface chemistry properties of GPC-1000.As shown in Fig.3(a),the XPS survey spectra of GPC-1000 with binding energies between 0 to 1200 eV shows mainly the presence of C 1s(285 eV)and O 1s(533 eV)peak,indicating the GPC consists primarily of carbon and oxygen elements.Carbon makes up the majority of GPC (96.26% (atom)),while oxygen makes up only 3.74% (atom).In previous studies,the semi quantitative analysis of carbon atom composition includes the effect of sp2/sp3ratio on the degree of graphitization during catalytic graphitization [23,24].The high-resolution C 1s spectra of the GPC-1000 (Fig.3(b)) can be deconvoluted into four individual component peaks: sp2-C (284 eV), C-C (284.5 eV),C-O-C (285.83 eV) and C-O (286.19 eV)[23].It is obvious from the sp2/sp3ratio that GPC has a graphene like structure and a high degree of graphitization.
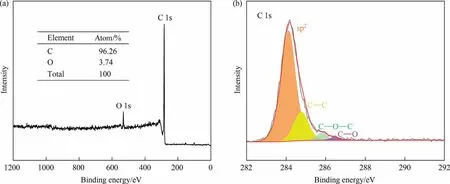
Fig.3.(a) XPS full spectrum and (b) C 1s spectra of GPC-1000.
3.2.Thermal behavior analysis during catalytic graphitization
TG and DTG coupled to MS were employed to study the thermal behavior of catalyzed and non-catalyzed RHC.Fig.4(a) and (b)shows TG and DTG analysis of RHC without a catalyst(a)and RHC mixed with 7 mmol EDTA-iron powder(b)in nitrogen atmosphere.Meanwhile, the signal strength is displayed in log units in this mass spectrometry illustration, demonstrating how gas products evolve during heat decomposition in Fig.4(b) and (d).Since nitrogen is used as inert gas, we excluded the corresponding data (m/z = 14, 28, 29 amu, 1 amu = 1.66×10⁻²⁴g).
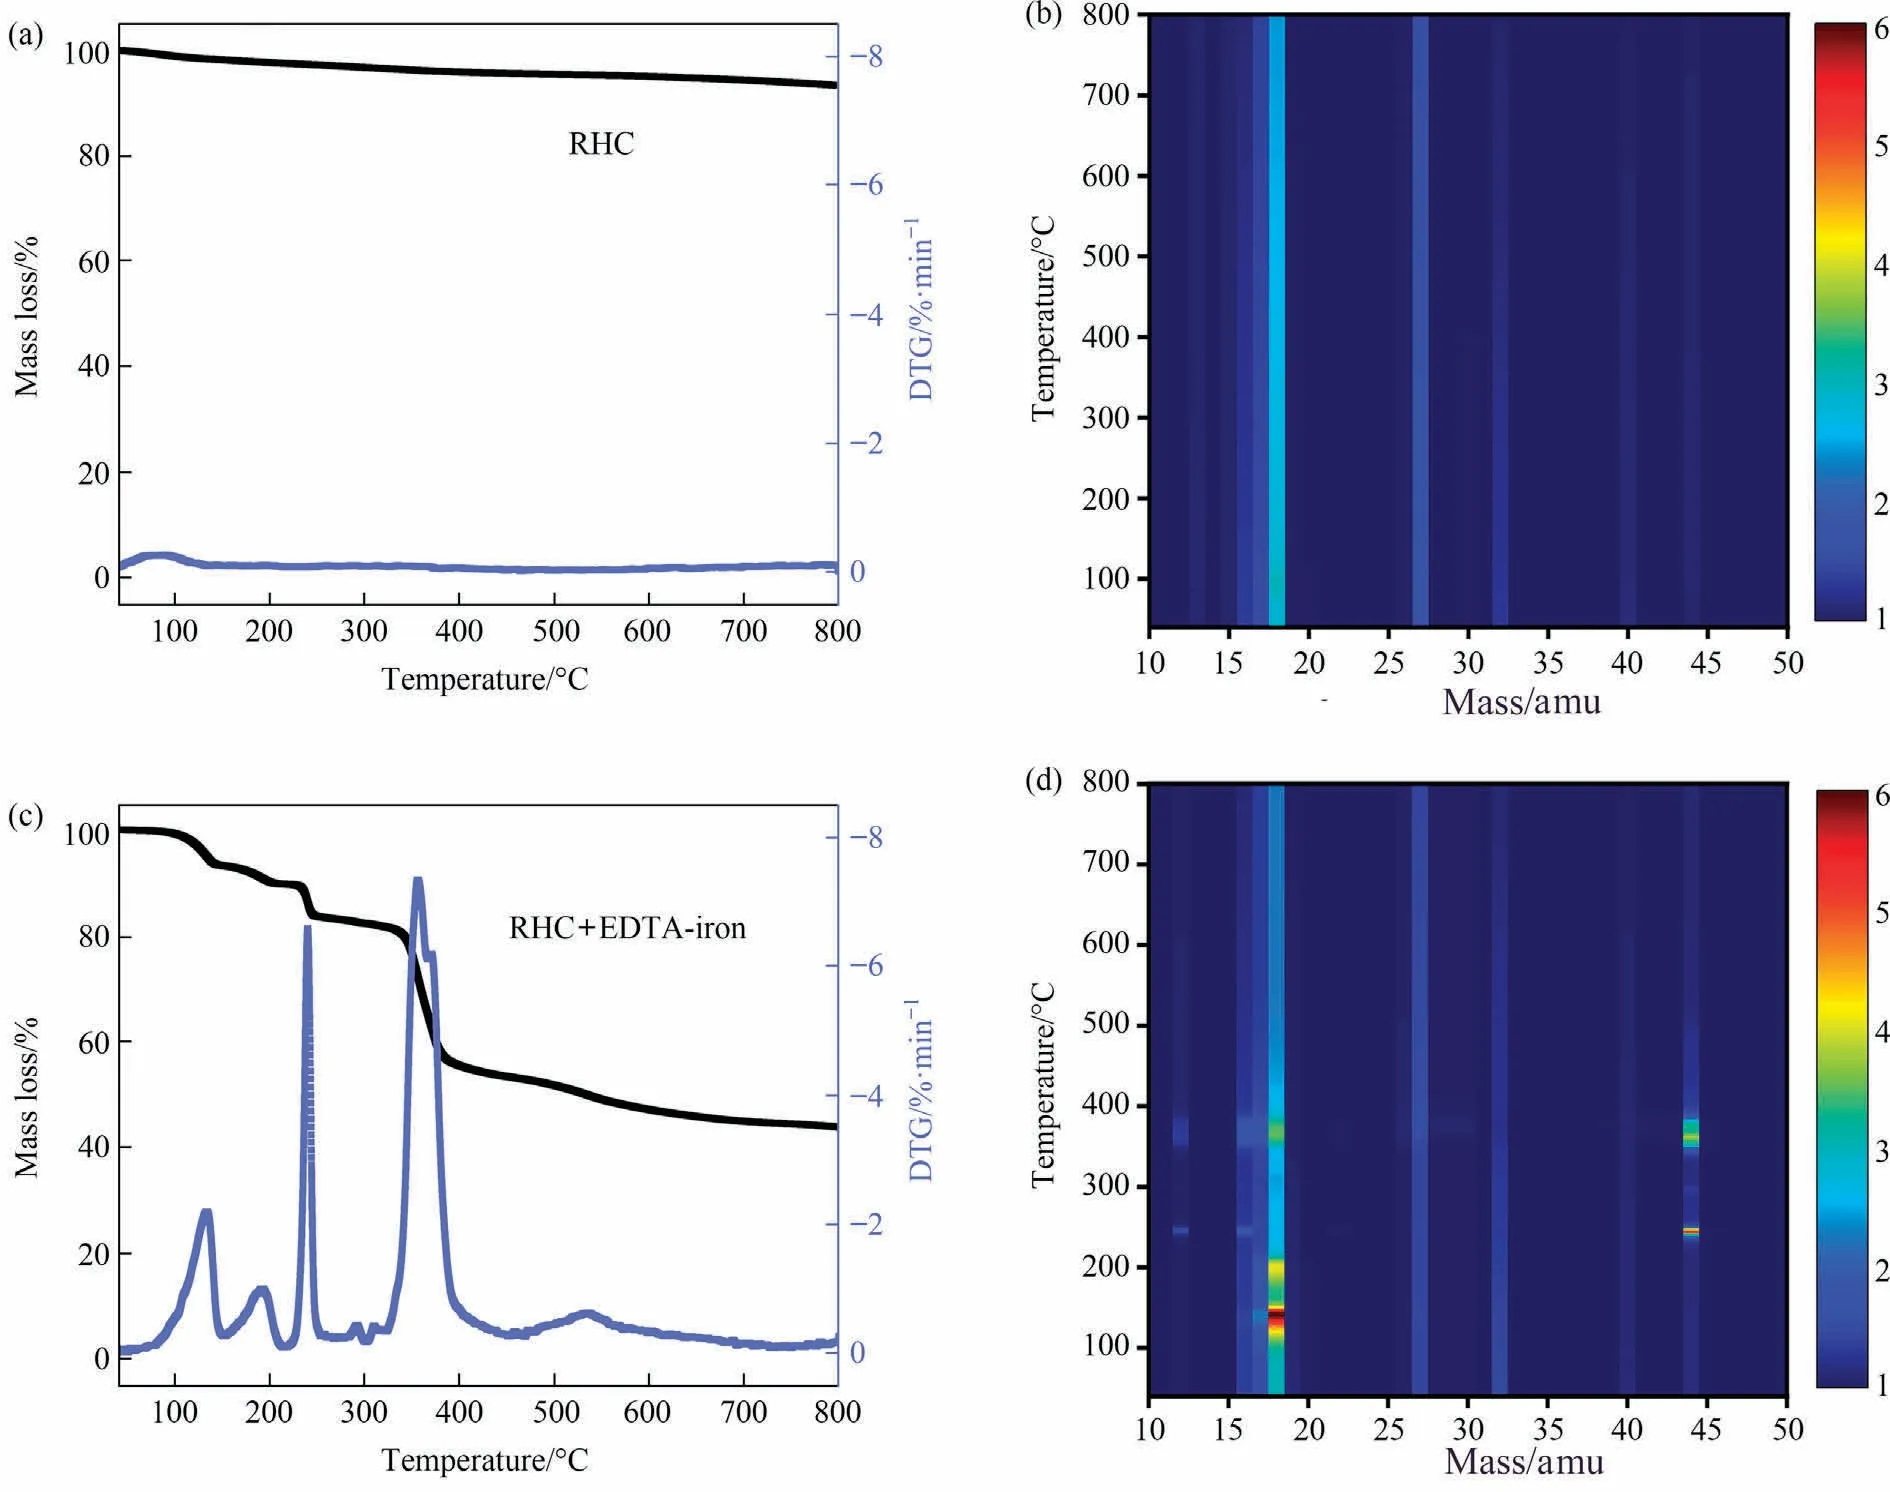
Fig.4.TG and DTG curves of the pyrolysis with mass spectrum of evolved gases(treatment temperature vs.mass/charge ratio)of(a,b)RHC and(c,d)RHC mixed with EDTAiron.(1 amu = 1.66×10⁻²⁴ g)
There is only one mass loss peak during 100°C in the DTG curve of RHC, as shown in Fig.4(a).Even if the temperature rises to 800 °C, the mass of RHC is nearly unchanged.Fig.4(b) shows the components of the thermal decomposition gas during the temperature of 100-800°C.It is identified as H2O(m/z =16,17, 18 amu).
The mass loss curve of the RHC mixed with 7 mmol EDTA-iron powder can be apparently divided into five ranges: 70-130 °C,130-190 °C, 190-255 °C, 255-405 °C, and 405-800 °C (Fig.4 (c)and(d)).Since there is nearly no mass loss for RHC in the temperature of 40-800 °C, the mass loss is attributable to the thermal decomposition of the catalyst EDTA-iron.In the first two temperature ranges,the system mainly loses water(H2O at m/z=16,17,18 amu).The first mass loss in the temperature range of 70-130 °C corresponds to the removal of two bound water molecules in EDTA-iron.The second mass loss between 130 °C and 190 °C is due to the removal of bound water in the EDTA-iron molecule.The sharp peak in the range of 190-255°C corresponds to the mass loss of carboxyl dissociation from the EDTA-iron.A clear, sharp peak centered at 362 °C is attributable to the separation and volatilisation of the glycine group from the EDTA-iron, and there is a heavy mass loss between 255 °C and 405 °C.Most gases are released in this temperature range.The gases evolved during graphitization are mainly CO2(m/z = 12, 22, 44 amu), CO (m/z = 12, 14, 28 amu), O2(m/z = 16, 32 amu), and H2O (m/z = 16, 17,18 amu) as well as signals from hydrocarbons such as CH4, C2H4,and C2H6(at m/z= 12-16,24-27, 38-44 amu.).In addition, decarboxylation continues in the subsequent temperature range, and the formed ethylenediamine also breaks the C—N bond after continuous heating (CH3CHNH2at m/z = 44 amu).In a closed atmosphere, most of the organic ligands in EDTA-iron are decomposed or vaporized into the above-mentioned components, and a small part of them act as the carbon source of GPC,which caused the volume of RHC to expand under the influence of the EDTA-iron(Fig.S2(a) and 2(b)).In addition, the more expansive structure will cover amorphous carbon and provide a larger contact area (permeation network) for iron droplets during catalytic graphitization.As the temperature continues to rise, the decomposition becomes slow and a residue of 24.37% remained at 800 °C, and GPC/Fe-800 still maintains the macro morphology of swelling (Fig.S2(c)).
3.3.Effect of reaction conditions on the graphitization evolution of GPCs
To probe graphitization evolution of the GPCs under various catalyst dosage (EDTA-iron), SEM, XRD, and Raman spectra were used to characterize the graphitized structure of GPCs at 1000 °C.As a reference, the XRD patterns of RHC and RHC heat-treated at 1000 °C without catalyst(RHC-1000)are shown in Fig.S3(a).Both RHC and RHC-1000 have a dispersion peak at about 23°, and RHC-1000 also has a wide and broad diffusion peak around 44°, representing their amorphous framework [25].This implies that the graphitization effect for biomass hard carbon is not prominent even at 1000 °C without a catalyst.The XRD pattern for the GPC/Fe-800-5 after catalytic graphitization is shown in Fig.S4.The most distinct peaks exhibit the existence of iron(Fe0),such as 43.38°and 44.67° ascribed to γ-Fe (ICDD: 01-071-4649) and α-Fe (ICDD: 00-006-0696), respectively.It demonstrates that most iron components changed from combined state to free state after annealing,which might be due to the carbothermal reduction [21].
As shown in Fig.5(a),for lower catalyst dosage(1-4 mmol·g-1),there are also the broad diffraction peaks around 23° and 44°ascribed to the (0 0 2) and (1 0 0) peaks of amorphous carbons,respectively.When the catalyst dosage increasing to 3 mmol·g-1,a weak reflection locked at 26° originating from the existence of turbostratic graphitic carbon.This is consistent with the SEM observations(Fig.S5(a)and(b)).GPC still maintains its nature porous structure of biomass,and obviously there is amorphous carbon from organic ligands of EDTA-iron on its surface and pore wall.It might be a result of iron droplets produced during pyrolysis [26],while few iron droplets produced at low catalyst dose are difficult to recrystallize graphite carbon from amorphous carbon.With the increase of catalyst dosage,the other graphitic peaks of GPCs begin to appear and gradually strengthen,such as(1 0 1)at 44.5°,(0 0 4)at 54.7° (1 1 0) at 77.5° and (1 1 2) at 87.1° (ICDD: 00-056-0159).Typically, the increasingly stronger (0 0 2) peak indicates that the graphitic structure of GPCs grows with well-stacked layers along the(0 0 2)lattice direction,suggesting a higher level of graphitization.For higher catalyst dosage(over 6 mmol·g-1),the(1 0 0)peak and (1 1 0) peak began to separate, and the complete separation was achieved till up to 7 mmol·g-1,which is due to the accumulation of the few iron droplets into the bigger iron droplets to perform catalytic graphitization.The SEM image in Fig.S5(c) and 5(d)could confirm the formation of the ordered graphitic structure.The carbon dissolved in a sufficient amount of iron droplets is precipitated and rearranged into nanoscale graphitic microcrystals after annealing,which are embedded and stacked with each other to form large multilayer graphitic carbon.This illustrates that the increase of catalyst dosage is conducive to the transformation of amorphous phase to regular graphitic phase.

Fig.5.XRD patterns of GPCs under different(a)catalysts dosage and(b)catalytic graphitization temperatures,Raman spectra of GPCs under different(c)catalysts dosage and(d) catalytic graphitization temperatures.
Raman spectra analysis is used to identify the anisotropic carbon structure formed during the catalytic graphitization [27].The sp2bond in graphite carbon is known to represent the G-band(in-plane bond stretching motion of E2gsymmetry),which is characterized as a graphitic band between 1520 cm-1and 1600 cm-1.Between 1320 cm-1and 1365 cm-1,the D-band is defined(breathing mode of A1gsymmetry), representing the disordered state of carbon structure.The degree of graphitization for a carbon material is represented by its ID/IGvalue.The Raman measurements(Fig.S3(b)and Fig.5(c))also agree with the XRD results.For using a lower concentration of catalyst (1 to 3 mmol·g-1), D-band shows the characteristics of wide and high, while GPC-1 to GPC-3 achieved around the ratio (ID/IG) of 1, indicating the high level disorder of their sp2hybrid carbon.With the increase of catalyst dosage from 4 to 7 mmol·g-1,the G-band keeps increasing and the full width at half maxima keeps narrowing, which indicates that the structural order and the crystalline orientation of the carbon materials are continuously improving.In addition, as the dosage up to 4 mmol·g-1, there is a 2D-band around 2660 cm-1appeared,indicating the existence of graphene-like few-layer microstrctures[28].Notably, the G-band redshift and the 2D-band blueshift of GPCs increase with increasing catalyst dosage, which results from the enhancement and recovery of sp2bond stretching vibration in graphene carbon structure [29].In a summary, the higher catalyst dosage contributing to the more iron droplets forming from catalytic graphitization of GPC, when the dosage of catalyst reaches 7 mmol·g-1, the GPC-7 has the highest graphitization degree of ID/IG= 0.19.
In order to obtain further insights for the graphitization evolution of the GPCs during different temperature under the optimal graphitization catalyst dosage of 7 mmol·g-1.After acid washing treatment of GPC-700,there are two broad humps(Fig.5(b))corresponding to the reflections of the(0 0 2)and(1 0 0)planes of amorphous carbon.This result agreed well with the SEM observation of the amorphous porous carbon (Fig.S6(a)).Furthermore, a small sharp peak at 26° appeared on the broad diffraction peak, which corresponds to the (0 0 2) plane of graphite, indicating that small graphite microcrystals begin to appear in the RHC at graphitization temperature of 700°C.Interestingly,when the graphitization temperature exceeds 800 °C, a sharp, symmetrical and strong peak appears at 26.5° in the XRD patterns of GPCs, together with other graphitic planes.And there still remains a basic biomass skeleton interspersing with graphitic crystalline in the GPC-800 as shown in Fig.S6(b).The(1 0 0)peak of GPC-900 becomes sharper,as seen by shifting of(1 0 0)and(1 0 1)plane profiles.And the particle surface of GPC-900 becomes slightly smooth with block structural order of turbostratic graphitic structure, as shown in Fig.S6(c).At higher temperature of 1000°C,the marked peaks corresponding to(1 1 2)plane of graphite reveal.Then the particle surface of GPC-1000 becomes relatively smooth with sharp edge and high-quality morphology(Fig.S6(d)),which is morphologically close to the previous study results of iron-loaded coke catalytic graphitization at 1300°C[21].With the increase of graphitization temperature from 700 °C to 1000 °C, the peaks of the (0 0 2) plane of GPCs become stronger and sharper, which suggests that higher graphitization temperature result in more complete graphite crystalline phase.This is consistent with the conclusions in previous studies[30,31].
Correspondingly,as shown in the Raman spectra of GPCs(Fig.5(d)), with increasing treatment temperature, the G-band intensity is enhanced in relation to the intensity of the D-band.And there is a separation of both bands, and the half-maximum of the Gband is narrowing.With the continuous increase of temperature,a 2D-band of GPC appears above 800 °C and its strength increases continuously, indicating the appearance of graphene-like layers.With the increase of graphitzation temperature, the symmetry of 2D peak gradually becomes worse, indicating that the number of graphene-like layers becomes larger.Similarly, the G-band is also very sensitive to the number of graphene layers[32].The blue shift of the G peak with increasing temperature suggests not only does the bond energy between graphene layers get weaker, but also a higher degree of graphitic order exists (multi-layered graphene).These changes are characteristic of the graphitic carbon structural order and good crystal orientation.In conclusion, and the highest graphitization degree of GPC can be obtained at 1000 °C (ID/IG= 0.19).
The effect of holding time on catalytic graphitization was investigated under the graphitization temperature of 1000 °C and catalyst dosage 7 mmol·g-1.As shown in Fig.S7, with the increase of holding time from 0.5 h to 3.0 h, there is an obvious graphite(0 0 2) peak together with other graphite peaks, such as (0 0 4),(1 0 0), (1 0 1), (1 1 0) and (1 1 2) peak from GPCs, which reflects the highest degree of crystallinity.The symmetry of the (0 0 2)peak becomes higher, indicating that the crystal form of GPC oriented along the (0 0 2) crystal plane is more complete.However,the 2θ position of the (0 0 2) peak did not shift significantly, indicating that the interlayer spacing of GPC did not change significantly.Therefore, prolonging the holding time during graphitization is beneficial to the growth of graphite grains,which is no obvious effect on the increase of graphitization degree.
3.4.Effect of reaction conditions on the pore structure of GPCs
The SBETand PSD of RHCs and GPCs were identified by N2adsorption-desorption test.Due to a large amount of SiO2existing in RHC/SiO2,on the one hand,it could affect the purity of the C element in GPCs,and on the other hand,it has an obvious effect in the pore structure distribution.Since the micropores in RHC mainly come from the disordered pores left by the volatilization of small organic molecules during the pyrolysis and carbonization of RH,and the mesopores mainly come from the retention of natural pore structure in RH during the carbonization [33].After desiliconization,the SBETand PSD of RHC have an apparent increase compared to RHC/SiO2from Table 1, which could provide more contact area for catalytic graphitization.And even heating at 1000 °C without catalyst, for the SBETand PSD of RHC-1000 no marked change is observed relative to RHC.

Table 1 The pore structural parameters of RHCs and GPCs with different catalyst dosage
As shown in Fig.6 and Fig.S8, the isotherms of GPCs and RHCs shows typical type IV curves with a sharp capillary condensation step around P/P0= 0.4-0.5, revealing the presence of mesoporous characteristic.The SBETand total pore volume (VTotal) for different catalyst dosage are summarized in Table 1.Compared with RHC,for lower catalyst dosage (1-3 mmol·g-1), the SBETof GPC-3(1187.2 m2·g-1) and the VTotalof GPC-4 (1.180 cm3·g-1) are morethan quadruple than those of RHC, respectively.There are two likely reasons for a substantial increase of the SBETand VTotalin GPCs.From TG-MS analysis, a large number of gasification products (H2O, CO2and so on) produced during the pyrolysis process.On the one hand, these gasification products form an atmosphere for physical activation within a confined space (Eqs.(1)-(3)) [34].On the other hand, the H2O and CO2generated from the pyrolysis of organic ligands from the catalyst combines to the iron for activation (Eqs.(4)-(9)) [35-37].For a contrast, GPC-3-T was prepared into a tube furnace under N2atmosphere.As shown in Fig.S8 and Table S3, compared to the GPC-3-T, the GPC-3 prepared in an atmosphere furnace possessed more abundant micromesopores structure and higher specific surface area.Both the SBET(1187.2 m2·g-1vs.415.2 m2·g-1) and VTotal(0.896 cm3·g-1vs.0.417 cm3·g-1) of GPC-3 are more than twice those of GPC-3-T.Therefore, it is believed that the gases generated from organic ligands of EDTA-iron during the formation of GPCs could play an effective activation role.While the catalyst dose increased to 4 mmol·g-1, the SBETof GPC-4 decreased to 859.8 m2·g-1.And the increase of mesoporous pore volume is accompanied by the decrease of microporous pore volume.Interestingly, the Raman analysis and XRD analysis also showed the results relative to effective graphitization (Fig.5(a) and (c)).This might be attributed to the formation of plenty of iron droplets, which dissolved and etched the pores to rearrange the amorphous carbon into ordered graphitic carbon,allowing the collapsed micropores transform into mesopores during the graphitization [38].With the continuous increase of catalyst dosage,the SBETand VTotalof GPCs declined significantly and eventually dropped to 47.6 m2·g-1and 0.238 cm3-·g-1.The continuous accumulation of iron droplets covering and penetrating on GPC,through rearrangement,not only the pores are collapsed,but also the amorphous carbon dissolved in the iron droplets are difficult to reactivate after cooling and annealing.Therefore, a lower catalyst dosage is favorable for the formation of micro-mesoporous structure in GPCs.
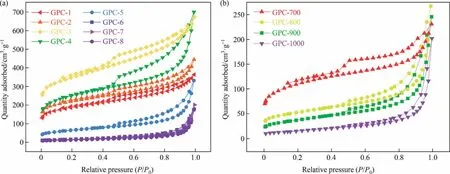
Fig.6.N2 adsorption-desorption isotherms of GPCs at different (a) catalyst dosage and (b) catalytic graphitization temperature.
The following equations are typical reactions during the graphitization [34-37]:
Under the 7 mmol·g-1of catalyst dosage, as the catalytic graphitization temperature increasing from 700 to 1000 °C, GPCs’SBETand together with VTotalalso increases at first, and then decrease (see Table 2).The highest SBET(382.5 m2·g-1) and micropore volume(0.066 cm3·g-1)of GPC is obtained at 700°C.It is possible that the organic ligands of the catalyst play an activation role because of gases produced in the pyrolysis process, which increases the micropore volume.Similarly, as the temperature exceed 800 °C, the size of the catalyst particles become larger[17], allowing the average pore size has increased significantly(4.63 nm to 10.73 nm).This means that when the graphitization temperature reaches 800 °C, the evolution of mesopores occurred from collapsed micropores that emerged during rearrangement of amorphous carbon to graphitic carbon, which witnessed to the results of XRD and Raman spectra analysis.This could be due to the fact that the Fe0can replace graphite carbon by etching the surface and permeating the pores of carbon material.Therefore,as the graphitization temperature over 800 °C, a more favorable etching for Fe0on GPCs is achieved, the degree of graphitization increase and the specific surface area decrease.This is the inevitable result of the gradual transformation of amorphous carbon into ordered graphitic carbon.

Table 2 The pore structural parameters of GPCs at different temperatures
3.5.Mechanism of catalytic graphitization of RHC by EDTA-iron
Based on the data and analysis above, a model to explain the action mechanism of catalyst (EDTA-iron) and graphite formation is suggested and depicted graphically in Fig.7.Firstly, EDTA-iron and RHC are effectively mixed evenly by ball milling.At initial heat treatment, water, carbon dioxide and other gases (identified by TGA/DTG/MS) are produced in this process.The pyrolysis gases generated during the process are able to penetrate the carbon material and engage in a physical activation process, as the entire pyrolysis process is conducted under an airtight environment.As the temperature increases, the iron in EDTA iron undergoes carbothermal reduction reaction and gradually transforms into ironcontaining oxides, as described by Eqs.(4)-(7).The macroscopic expansion structure forms at 400 °C (Fig.S2(b)), which serves as the permeation network to provide a more effective transmission medium for catalytic graphitization.At higher temperature (over 800 °C), the Fe0synthesized by carbothermal reduction reaction(Eqs.(8) and (9)), forming iron droplets through aggregation and adhesion, continuously penetrates and covers the pores and surfaces of carbon materials.Then,the pore wall and surface are continuously dissolved, so that the collapsed micropores and mesopores continue to evolve into mesopores and macropores.After annealing, the Fe0flooded the surface of graphitic carbon,showing a coral-like appearance (Fig.1(b)).Eventually the GPC of high purity and high graphitization degree with certain pore structure can be obtained after pickling.

Fig.7.Mechanism of catalytic graphitization by EDTA-iron catalyst.
SEM, Raman, XRD and BET results indicate that graphitization degree and pore evolution depend strongly on temperature and catalyst dosage.It is speculated that the Fe0can effectively etch amorphous carbon by infiltration downward and replacment to form graphite microcapsules after reaching it’s melting point of 800 °C.For a lower catalyst dosage, on the one hand, the gases in the pyrolysis process activates the carbon material by itself, and on the other hand,it reacts with zero-valent iron to play an activating role,which obtains high specific surface area carbon materials.With the increase of catalyst (EDTA-iron) dosage, the amount of iron droplets in the system increases,its contact area and the etching effect increases accordingly.The newly formed micropores will continue to be etched to form mesopores,resulting in the increasing proportion of mesoporous volume and the increasing graphitization effect.After sufficient iron droplets fully etch the RHC, the amorphous carbon in the original channel forms a stack of layered or flake structure after rearrangement.
3.6.Recycling of the catalyst
To further test the practical utility of the method,the process of acid pickling and waste liquor dealing were merged to the recycling of the catalyst (iron).After pickling GPC with EDTA solution,then the obtained solution is treated by adjusting the pH and ethanol precipitation.The obtained precipitate was dried to obtain the recovered catalyst with 97% yield.
The following equations are typical reactions in the oxidationreduction process of catalyst:
The recovered EDTA-iron was used for the graphitization of RHC at the same parameters as the GPC-1000 preparation for three times.The changes of structure and product characteristics are shown in Fig.S10.It can be seen from Fig.S10(a) that the FT-IR spectrum of the 1st and the 3rd recycled EDTA-iron is closely matches that for standard EDTA-iron.
Fig.S10(b) are the XRD patterns of the graphitic products from the three cycles,there are still obvious characteristic peaks of graphite,but the interlayer spacing of the(0 0 2)-plane spacing gradually increases,and after three cycles,the(1 0 0)peak and the(1 0 1) peak are difficult to separate.From the Raman spectrum(Fig.S10(c)) of the products, the ratio of the D band to G band intensity (ID/IG) becomes larger as the recycling times increase,representing that the degree of graphitization becomes lower,but it still has a high degree of graphitization (ID/IG<0.3).
These results indicate that the intrinsic activity of the catalyst still maintained well after three recycles with 92% catalyst recovery yield.
3.7.Properties comparison between GPC-1000 and commercial graphite
Compared with the XRD patterns and Raman spectra of the commercial graphite from Fig.8, GPC-1000 has the same characteristic peaks as commercial graphite, and the ID/IGvalue of GPC-1000 (0.19) is close to that of commercial graphite (0.15).
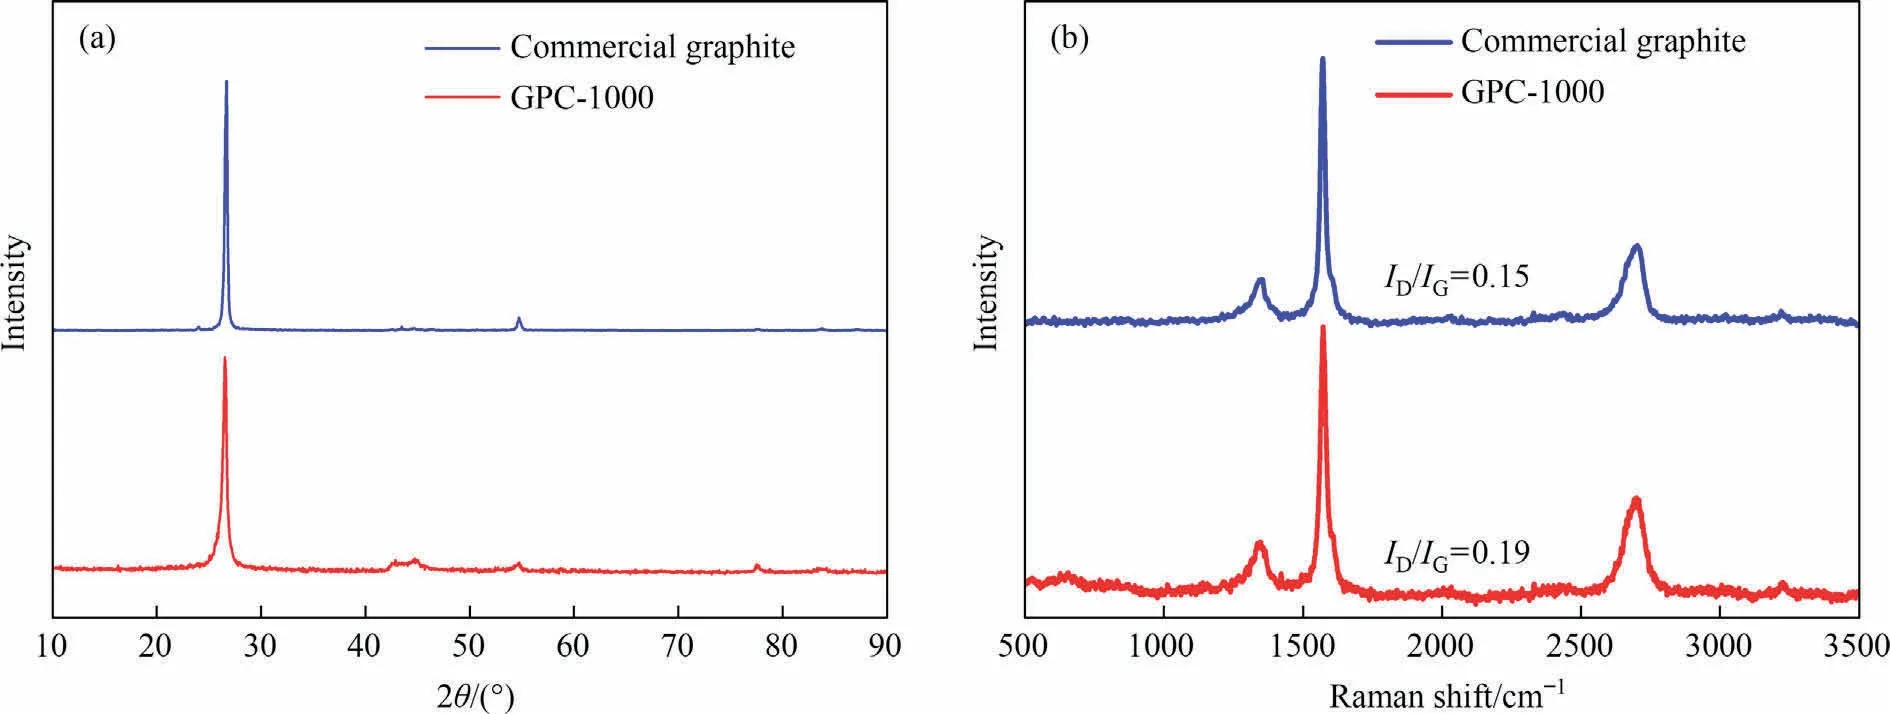
Fig.8.(a) XRD patterns and (b) Raman spectra of commercial graphite and GPC-1000.
Fig.9(a) and (b) shows the SAED patterns of commercial graphite and GPC-1000.Compared with commercial graphite, there are clear polycrystalline diffraction rings and onion-like structure from the SAED patterns of GPC-1000.Existence of diffraction rings can correspond to the observations during the XRD patterns, such as a strong diffraction ring from(0 0 2)reflection,weak diffraction rings of (1 1 0) and (1 0 0) reflections.Meanwhile, from TEM images of commercial graphite and the GPC-1000, GPC-1000 shows a primitive stacked lamellar structure (Fig.9(d)), which takes on the formation of graphitic stacking like commercial graphite (Fig.9(c)).In summary, EDTA-iron is an efficient and mild catalytic graphitization reagent, which can achieve high-degree and low-defect graphitization of rice husk carbon with the product properties close to commercial graphite.
4.Conclusions
High quality graphitized porous carbons(GPCs)from renewable resources of rice husk carbon (RHC) were successfully prepared with EDTA-iron by a facile, clean and energy-effective process(800-1000 °C).EDTA-iron plays multiple roles simultaneously as a catalyst, activation agent and part of carbon source.Graphitization temperature and catalyst dosage demonstrated the pronounced influence on the degree of graphitization.With the parameters of temperature of 1000 °C, catalyst dosage of 7 mmol·g-1, and holding time of 1.0 h, the highest graphitization degree of GPC (ID/IG= 0.19) can be obtained.The graphitization degree of the GPC at this conditions is comparable to that of commercial graphite.The GPC can posess a high surface area of 1187.2 m2·g-1at the conditions of temperature of 1000°C,catalyst dosage of 3 mmol·g-1,and holding time of 1.0 h,giving it a promising application potential in the fields of energy stroage and adsorbent.
In addition, this study preliminarily investigated the mechanisms of EDTA-iron catalytic graphitization at high concentration and pore formation at low concentration.In future research, on the basis of this study, the large-scale application of biomass high-purity graphite conversion and green energy storage will be further developed.
Declaration of Competing Interest
The authors declare that they have no known competing financial interests or personal relationships that could have appeared to influence the work reported in this paper.
Acknowledgements
This work is sponsored by the Science and Technology Research Project of Education Department of Jilin Province(JJKH20220683KJ), Natural Science Foundation of Jilin Province(20220101093JC).
Supplementary Material
Supplementary data to this article can be found online at https://doi.org/10.1016/j.cjche.2023.06.025.
 Chinese Journal of Chemical Engineering2023年12期
- Chinese Journal of Chemical Engineering的其它文章
- Intrinsic kinetics of catalytic hydrogenation of 2-nitro-4-acetylamino anisole to 2-amino-4-acetylamino anisole over Raney nickel catalyst
- Experiments and model development of p-nitrochlorobenzene and naphthalene purification in a continuous tower melting crystallizer
- α-Synuclein: A fusion chaperone significantly boosting the enzymatic performance of PET hydrolase
- Influence of water vapor on the separation of volatile organic compound/nitrogen mixture by polydimethylsiloxane membrane
- Mass transfer mechanism and relationship of gas-liquid annular flow in a microfluidic cross-junction device
- Enhanced photocatalytic activity of methylene blue using heterojunction Ag@TiO2 nanocomposite: Mechanistic and optimization study