
Mass transfer mechanism and relationship of gas-liquid annular flow in a microfluidic cross-junction device
2023-02-28 00:30XinXuNaXuWeiZhangJunwenWangYaoLiChenYang
Xin Xu, Na Xu, Wei Zhang, Junwen Wang, Yao Li, Chen Yang
1 Shanxi Key Laboratory of Chemical Product Engineering, College of Chemical Engineering and Technology, Taiyuan University of Technology, Taiyuan 030024, China
2 Shanxi Coking Coal in Yuncheng Salt Refco Group Ltd., Yuncheng 044000, China
Keywords:Gas-liquid microreactor Annular flow Mass transfer mechanism Mass transfer relationship Multi-objective particle swarm optimization
ABSTRACT Mass transfer performance of gas-liquid two-phase flow at microscale is the basis of application of microreactor in gas-liquid reaction systems.At present, few researches on the mass transfer property of annular flow have been reported.Therefore,the mass transfer mechanism and relationship of gas-liquid annular flow in a microfluidic cross-junction device are studied in the present study.We find that the main factors,i.e.,flow pattern,liquid film thickness,liquid hydraulic retention time,phase interface fluctuation,and gas flow vorticity,which influence the flow mass transfer property,are directly affected both by gas and liquid flow velocities.But the influences of gas and liquid velocities on different mass transfer influencing factors are different.Thereout,the fitting relationships between gas and liquid flow velocities and mass transfer influencing factors are established.By comparing the results from calculations using fitting equations and simulations,it shows that the fitting equations have relatively high degrees of accuracy.Finally,the Pareto front,namely the Pareto optimal solution set,of gas and liquid velocity conditions for the best flow mass transfer property is obtained using the method of multi-objective particle swarm optimization.It is proved that the mass transfer property of the gas-liquid two-phase flow can be obviously enhanced under the guidance of the obtained Pareto optimal solution set through experimental verification.
1.Introduction
Microreactor has broad application prospects in the field of chemical engineering [1,2] due to the good performance in eliminating limitation of mass transfer and enhancing chemical reactions [3,4].Gas-liquid two-phase flow and reaction widely exist in chemical industry.Under different gas and liquid flow velocities,there are five two-phase flow patterns generally in microreactor,i.e.,bubbly flow,slug flow,churn flow,slug-annular flow and annular flow[5].Among the five flow patterns,the gas phase is discontinuous in bubbly flow, slug flow, churn flow and slug-annular flow, but is continuous in annular flow [6].
Mass transfer performance of gas-liquid two-phase flow at microscale is of great significance for the study on miniaturization of gas-liquid contact process, as well as the basis of application of microreactor in gas-liquid reaction systems [7,8].The existing researches generally focus on investigating the mass transfer performance of bubbly or slug flow in different micro dispersers,i.e.cross-junction, T-junction and Y-junction microfluidic devices[9-11].It is shown that the mass transfer ability of gas-liquid micro-dispersion system depends on the two-phase flow pattern,microfluidic device structure, flow conditions, etc.
For patterns of bubbly and slug flow,the gas phases have different micro-dispersion mechanisms, giving rise to obvious differences in dispersing time of gas phase, mass transfer coefficient at bubble/slug forming and moving stages and contribution of bubble/slug forming and moving to the mass transfer of whole flow system [12-15].
Microfluidic device structure affects the internal and external flow field of bubble/slug at its forming stage, and further affects the mass transfer ability between gas and liquid phases.Namely,the stronger local shear of microfluidic device to flow,on one hand,generates smaller dispersion size of gas phase decreasing the gas diffusion distance, on the other hand, accelerates the renovation of liquid on the bubble/slug surface and increases the internal and external flow circulation strength of bubble/slug, thereupon,enhances the mass transfer efficiency of two phases [16,17].
The flow conditions, mainly referring to the flow velocities of two phases, show different influences on flow mass transfer at gas dispersing and moving stages.At gas dispersing stage, namely the bubble/slug forming stage, the flow mass transfer coefficient significantly increases with gas velocity.While at gas(bubble/slug)moving stage, the flow mass transfer coefficient increases with velocity ratio of liquid to gas,but is barely affected by gas flow rate[18,19].
Based on the above results, some mass transfer models have been established for the bubbly flow and slug flow[9,20,21].However,high velocity gas-liquid two-phase flow is necessary in some chemical industry processes, e.g.gas-liquid sulfonation process in microfluidic device [22-24], wherein the gas phase is continuous in general and the two-phase flow pattern is slug-annular or annular.At present, few researches [25-27] on the mass transfer property of annular flow have been reported.Deficiency of mass transfer model for annular flow limits the broader industrial application of microreactor.
In the present study,therefore,we carried out researches on the annular flow behaviors based on the gas-liquid sulfonation experimental system[24]to obtain the influence rules of two-phase flow velocities and cross-junction microfluidic structure on the interphase mass transfer performance, so as to explore the mass transfer characteristic and mechanism of gas-liquid two-phase annular flow in microfluidic device and establish the corresponding mass transfer relationship.Considering the limitation of experimental method in obtaining flow parameters of microfluidic device,numerical simulation method is utilized referring to the related researches [28,29].
2.Numerical Simulation Method
To simplify the calculation, we make some assumptions,namely (i) continuity assumption still holds; (ii) flow velocity on the wall surface follows the no-slip boundary condition; (iii) both gas and liquid flows are incompressible.
2.1.CLS-VOF method
It is difficult for two kinds of incompatible fluids to capture the free-phase interface in a dynamic motion process.Hence,Sussman and Puckett[30]proposed a calculating method(CLS-VOF)of coupling the level-set (LS) model with the volume-of-fraction (VOF)method.The cores of this method are using the VOF convection equation to achieve mass conservation, using the LS model to calculate the curvature,and using the normal vector to smoothly capture the phase interface [31].
The VOF method is using the phase function C as the Eq.(1) to calculate the volume fraction of each phase in each cell grid, in order to obtain the position and direction of the phase interface.The phase volume fraction represents the ratio of the volume of a phase to the volume of the grid wherein the phase locates in the multiphase flow.
where α is phase volume fraction.
Accordingly, the governing equations of volume fraction, mass and momentum conservation are defined as Eqs.(2), (3) and (4)correspondingly.
where U is velocity vector, p is pressure,ρ is density,μ is dynamic viscosity and f is the source item of surface force.The continuum surface tension is calculated by Eq.(5) proposed by Brackbill et al.[32].
where σ is the surface tension coefficient, δ is the delta function concentrated on interface, n is the unit normal vector of interface,and κ is the interface curvature which is described by the divergence of n.
For the VOF method,due to the discontinuity of the phase function C, it is difficult to accurately calculate the normal vector and curvature of the phase interface.While the LS model, defined as Eq.(8), is good at capturing the phase interface
where d is the distance from a certain point to the phase interface at a certain time t.
From Eq.(8),one can find that the phase interface is the isosurface as ?(x, t) = 0 at any time and satisfies.
Eq.(9) is the convection transport equation of LS function,reflecting the relationship between ? and t.
The LS model can calculate the curvature of the phase interface and smooth the physical quantities near the phase interface.However, mass loss will occur in the calculation because it cannot satisfy the law of conservation of mass.CLS-VOF method establishes the algebraic relationship between VOF method and LS model to achieve continuous smoothing of phase interface and meanwhile ensure mass conservation.
2.2.Turbulence model and solver
For the single-phase flow in microchannels with hydraulic diameter of 10-100 μm,an early transition from laminar to turbulent flow has been reported[33].At high liquid and gas flow rates,the deformed interface film was observed [34].Surface tension plays a dominant role in microflow [35].Besides, the gas phase plays strong shearing effect on the gas-liquid interphase under high gas flow rate.The confrontation between the surface tension of the liquid phase and the shear force of the gas phase leads to the failure of laminar flow.Zheng et al.[29] used turbulent model to investigate gas-liquid flow in a complex microchannel by numerical simulation.In his work,under the conditions of high gas/liquid flow rate and large flow rate ratio of gas to liquid, the interface of annular flow was waved which was observed by high speed camera.Therefore, the mixing of two phases in cross-junction is considered as local turbulent in the present study, and the gasliquid flow is described utilizing the RNG k-ε model, which can handle flows with swirls and large distortions.
For the more detailed descriptions of variables and constants in Eqs.(10)-(12), one can refer to Ref.[36].
A commercial solver based on the finite-volume method(ANSYS Fluent) is used in the present study.The momentum and mass transport functions are discretized using the second-order upwind scheme.For the pressure interpolation, the PRESTO scheme with a second-order accuracy is employed.The PISO algorithm is utilized for pressure-velocity coupling.The first-order non-iterative scheme is used to discretize the transient terms[37].For the flow channels, all the inlets are set as velocity-inlets and the outlet is set as pressure-outlet.The time step is chosen by limiting the maximum Courant number less than 0.25.
2.3.Gas-liquid sulfonation reaction and reactant property
In the present study, the gas-liquid continuous synthesis of dodecylbenzenesulphonic acid (DBSA) in microreactor is investigated.For the synthesis of DBSA, dodecylbenzene (DDB) is chosen as the sulfonation substrate and sulfur trioxide (SO3, gas, volume fraction 4%)mixed with dry air(volume fraction 96%of gas)is chosen as the sulfonation agent.
The sulfonation reaction of SO3and DDB can be simplified as Fig.1.Namely,DDB reacts with SO3firstly to form an intermediate(dodecyl benzene pyrosulfonic acid),and then DDB reacts with the intermediate to form DBSA.This is the main reaction process.In addition, the intermediate can react with itself to generate DBSA anhydride and pyrosulfuric acid,which can react with DDB to give DBSA.This is a slow reaction process.The related physical properties of reactants are shown in Table 1.

Table 1 Physical properties of reactants

Fig.1.Sulfonation reacton of SO3 and DDB.
2.4.Geometric model and grid independence test
The geometric model for simulation is established based on the experimental microreactor for SO3-DDB sulfonation reaction which consists of a cross-shaped channel and a straight channel connected with the exit passageway of cross-shaped channel as shown in Fig.2.The annular flow is recorded by a high-speed camera and transferred to a computer.As shown in Fig.3,the construction of calculating geometric model is similar with the experimental system.In Fig.3, the cross-sectional area of crossjunction is 1 mm × 0.26 mm, and the length of straight channel is 5 cm.The size of gas and liquid inlets is 2 mm × 1 mm ×0.26 mm.

Fig.2.Experimental microreactor for SO3-DDB sulfonation reaction.

Fig.3.Calculating (a) geometric model and (b) dimensions for microfluidic crossjunction device.
The computational domain is discretized using five different grids, containing 79172, 120392, 190466, 241024, and 359490 hexahedral cells respectively, to perform the grid independence test.The flow velocities of gas and liquid are set to 1 m·s-1and 0.01 m·s-1respectively in the test.Liquid film thickness, one of the most important features in annular flow, is chosen as the parameter to evaluate the different grid resolutions.The liquid film thickness varies with time and space, therefore, all the values of liquid film thickness in the present study are averaged in time and space.The detailed methods of extracting the liquid film thickness are as follows.
For the experimental picture of annular flow recorded by the high-speed camera at a certain time, the liquid film thickness at 30 points uniformly distributed along the straight channel of the microreactor is measured utilizing the ImageJ software[38].These 30 values are averaged and the averaged value is taken as the liquid film thickness of the annular flow at the moment.Five similar space-averaged values obtained at 5 different moments are averaged and taken as the final value of the liquid film thickness under a certain reaction condition.
For the simulation results, the iso-surface constituted by grids containing 10% (vol) of liquid is considered as the gas-liquid interphase of the annular flow.Different from the experimental results, the value of liquid film thickness can be extracted directly from the calculation result after the two-phase interphase being determined, i.e.extracting all the values of liquid film thickness at all grid nodes on the iso-surface.The averaging methods for the calculating values of the liquid film thickness in time and space are same with the methods for the experimental ones.
As shown in Fig.4,the calculating value of liquid film thickness decreases and tends to be stable gradually with increasing grid accuracy.Accordingly, the resolution containing 241024 grids is selected to proceed numerical calculations to optimize computational costs.Based on this grid resolution,there are at least 3 grids across the liquid film.

Fig.4.Grid independence test.
3.Results and Discussion
3.1.Validation of numerical computation
The numerical simulation result is compared with the experiment test under the same flow conditions, as shown in Fig.5.One can find that the simulation result, i.e., two-phase distributions in flow channel,is consistent with experimental one in quality, but with little error in quantity.
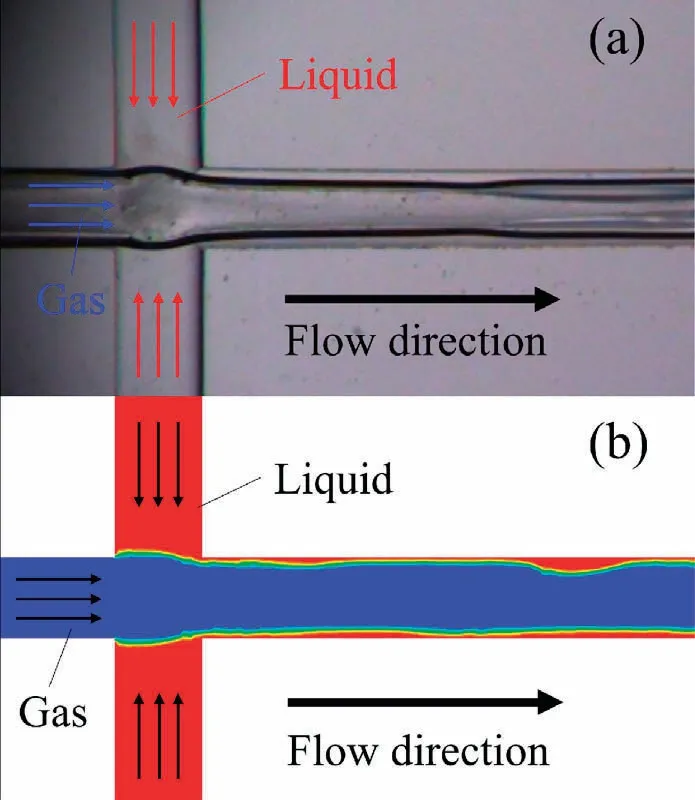
Fig.5.Comparison of (a) experimental test with (b) simulation results.Flow velocity of gas vg is 10 m·s-1 and flow velocity of liquid vl is 0.01 m·s-1.
Additionally, the values of liquid film thickness are extracted from results of calculating and experimental under conditions of fixed gas velocity 10 m·s-1but increasing liquid velocity, as presented in Table 2, to further verify the simulation accuracy.Note that all the velocities of gas and liquid flows in the present study are the inlet cross-sectional average velocity.The maximum and average deviations between calculating and experimental results are 1.56%and 1.03%,respectively.Based on the above comparisons,the simulating method and result are considered reliable.

Table 2 Comparison of liquid film thickness between simulation and experiment(vg = 10 m·s-1)
3.2.Effect of velocity on gas-liquid flow pattern
The gas and liquid encounter and mix in the cross-junction area of the microreactor.Under large velocity ratio of gas to liquid flow,the encountering interface of two phases has different locations and shapes with different flow velocities as shown in Fig.6.However, the location and shape of the encountering interface have some regular patterns.As shown in Fig.7(a),one typical case is liquid intrudes into cross-junction area and the two-phase interface wholly or partially locates in the cross-junction area when liquid flow speed is relatively high.The interface is higher than the horizontal level of the wall of straight channel in Fig.7(a)named convex surface.Another typical case, as shown in Fig.7(b), is gas intrudes into the channel of liquid flow and the two-phase interface locates in the channel of liquid flow when liquid flow speed is relatively low.Correspondingly, the interface in this case is named concave surface.
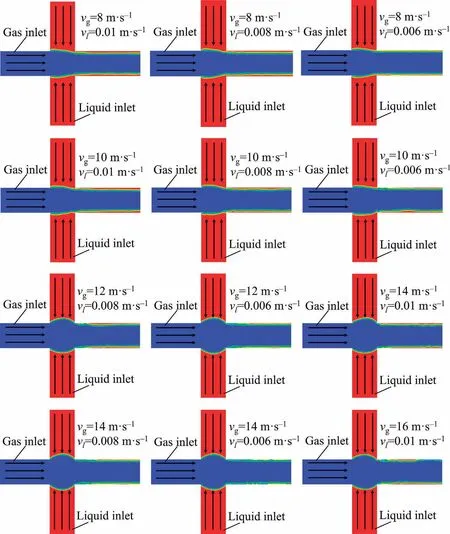
Fig.6.Encountering interfaces of two phases under different flow conditions.
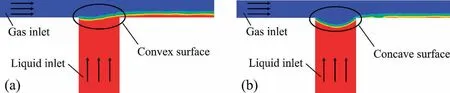
Fig.7.Two types of gas-liquid encountering interface: (a) convex surface (vg = 8 m·s-1,vl = 0.01 m·s-1); (b) concave surface (vg = 14 m·s-1,vl = 0.008 m·s-1).
Different encountering interfaces, forming under different gasliquid flow velocities, corresponds to different degrees of mixing between two phases.As shown in Fig.8, the vorticity magnitude of gas-liquid flow with different encountering interface is quite different in the cross and straight channels.Therefore,the relationship between encountering interface and flow is further studied.
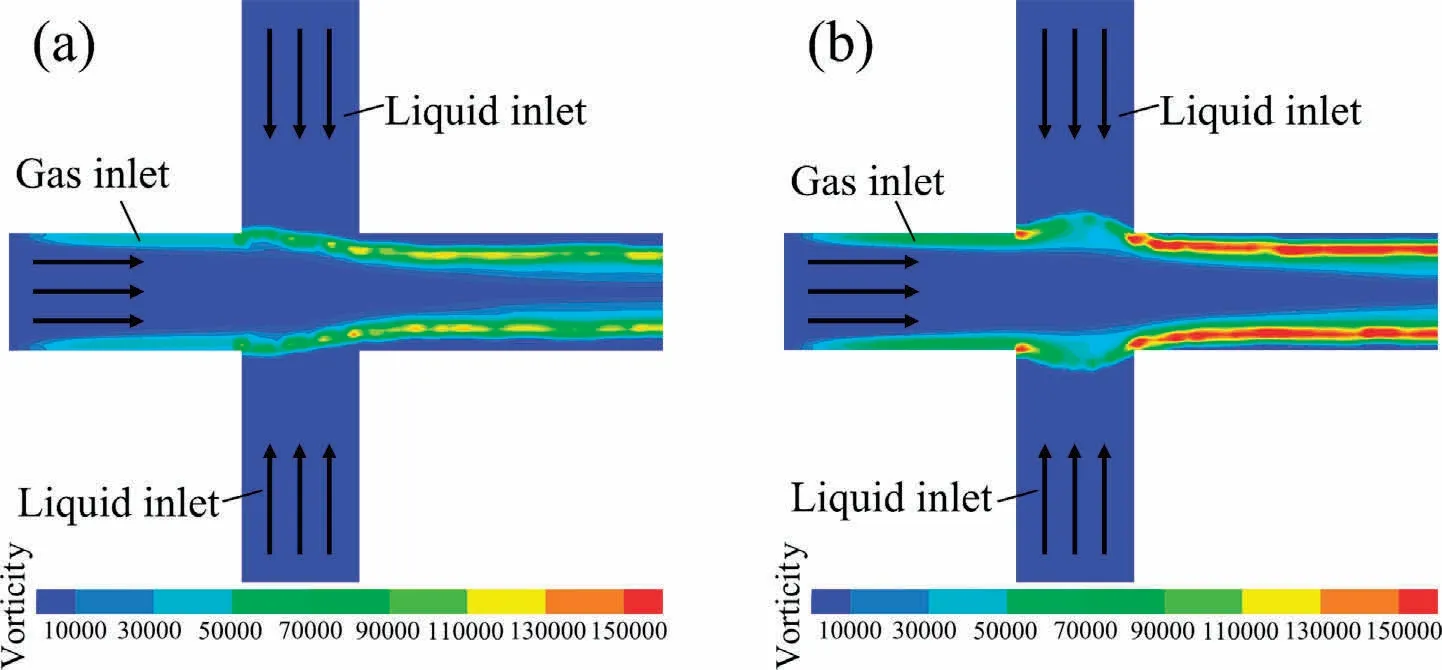
Fig.8.Vorticity magnitude of gas-liquid flow with different encountering interfaces of(a)convex surface(vg=8 m·s-1,vl=0.01 m·s-1);(b)concave surface(vg =14 m·s-1,vl = 0.008 m·s-1).
Obviously, the higher the speed ratio of gas to liquid flow, the more possibility the concave surface forming.It is found that the velocity condition for the transition of convex and concave surfaces can be described by Eq.(13), as illustrated in Fig.9.

Fig.9.Velocity conditions for different encountering interfaces.
With different encountering interfaces,the vorticity magnitude of gas flow is quantitatively shown in Fig.10.For the two flow cases,one can find that the vorticity magnitude of gas flow rapidly increases along the flow direction (i.e.position increasing in Fig.10) after encountering the liquid flow, and achieves dynamic stability not far behind the entrance of the straight channel.It means the forming of annular flow in this microreactor is very quick and happens in the areas of cross-junction and entrance of straight channel.In other words, flow velocity and microdisperser construction have great influences on the forming of annular flow.Comparing two groups of curves in Fig.10,the vorticity of gas flow at each developing stage in convex-surface case is smaller than that in concave-surface case, implying that the gas flow velocity has larger effect on the mass transfer performance between two phases than liquid flow velocity.

Fig.10.Vorticity magnitudes of gas flow with different encountering interfaces: (a) convex surface (vg = 8 m·s-1, vl = 0.01 m·s-1); (b) convex surface (vg = 8 m·s-1,vl = 0.008 m·s-1); (c) concave surface (vg = 14 m·s-1,vl = 0.01 m·s-1); (d) concave surface (vg = 14 m·s-1,vl = 0.008 m·s-1).t is flow time.
For liquid phase, the volume flow rate in the straight channel under different flow conditions is extracted and presented in Fig.11.The volume flow rate in the present study is defined as the volume of liquid passing through the cross section of the straight channel per unit time.It shows that the instantaneous volume flux of liquid substantially increases at a certain position of straight channel, then rapidly decreases after reaching the maximum value, and remains smaller than the inlet average value.Namely, the liquid has a stacking phenomenon [39-41] due to the viscous force between liquid internal layers is larger than that between two phases.However, the surface of accumulated liquid gradually goes deep into gas flow and bears increasing shearing force of gas flow.Accumulating to a certain extent,some liquid will be taken away by gas when shearing force of gas flow is larger than the viscous force in liquid.Thereafter, the liquid performs next cycle of stacking behavior in the straight channel.The intermittent stacking behavior of liquid should be responsible for the fluctuations of vorticity magnitude of gas flow in the straight channel in Fig.10.
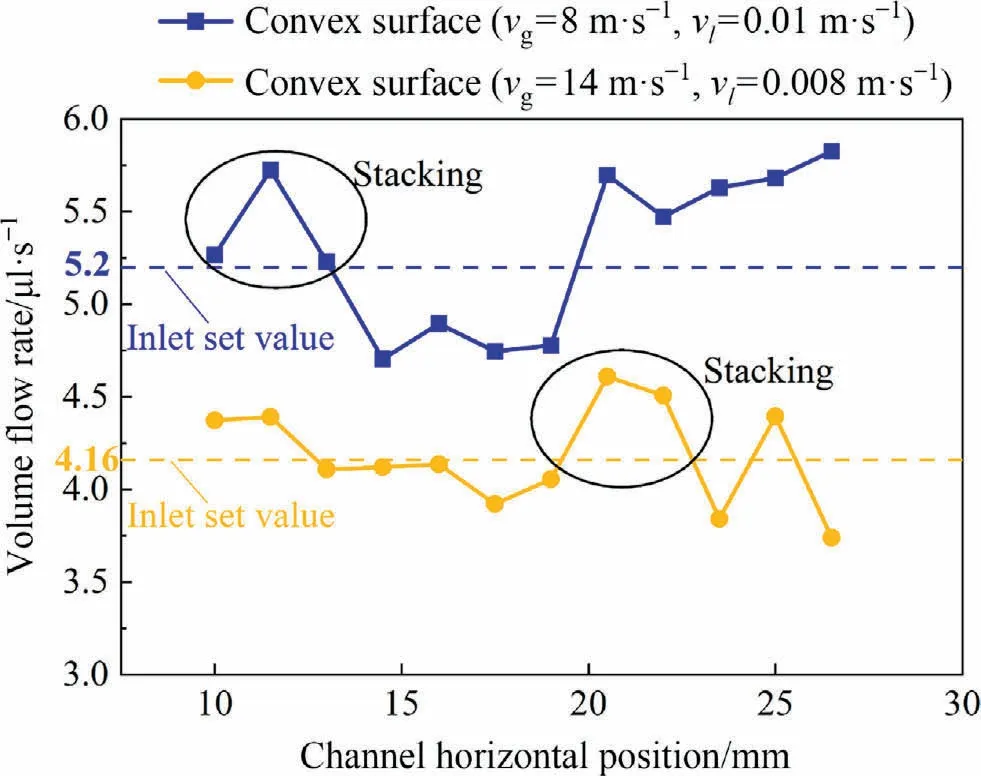
Fig.11.Instantaneous volume flow rate of liquid (i.e., the liquid volume passing through the cross-section of the straight channel per unit time) in the straight channel.
3.3.Effect of velocity on diffusion mass transfer of gas in liquid
The liquid phase flows along the wall in form of film in annular flow.The thickness of liquid film is one of the crucial factors influencing the diffusion of gas in liquid flow.The thinner the film, the larger the concentration gradient across the film for the same amount of gas diffusing into liquid, therefore the higher the diffusion rate of gas in liquid flow.Hence liquid film thickness is investigated under different flow velocities.Considering the stacking phenomenon of liquid flow, i.e.the liquid film thickness is not stable, the thickness value shown in Fig.12 is averaged in time and space.

Fig.12.Variations of liquid film thickness with velocities of (a) gas flow and (b) liquid flow.
As shown in Fig.12,the influences of gas and liquid flow velocities on the liquid film thickness are opposite.Namely, the liquid film thickness increases with the liquid flow speed, but decreases with the gas flow speed.Combined the influences, the response surface of liquid film thickness to flow conditions of two phases is obtained and presented in Fig.13.It is shown that the growth of liquid film thickness with liquid speed is very quick under relatively low gas speed, but slowing down under high gas speed due to the high shearing effect of gas flow.Therefore, although the speed of gas phase is much higher than that of liquid phase in annular flow, one should try to increase liquid speed but decrease gas speed to obtain larger liquid film thickness so as to maintain higher mass transfer rate of gas in liquid phase.
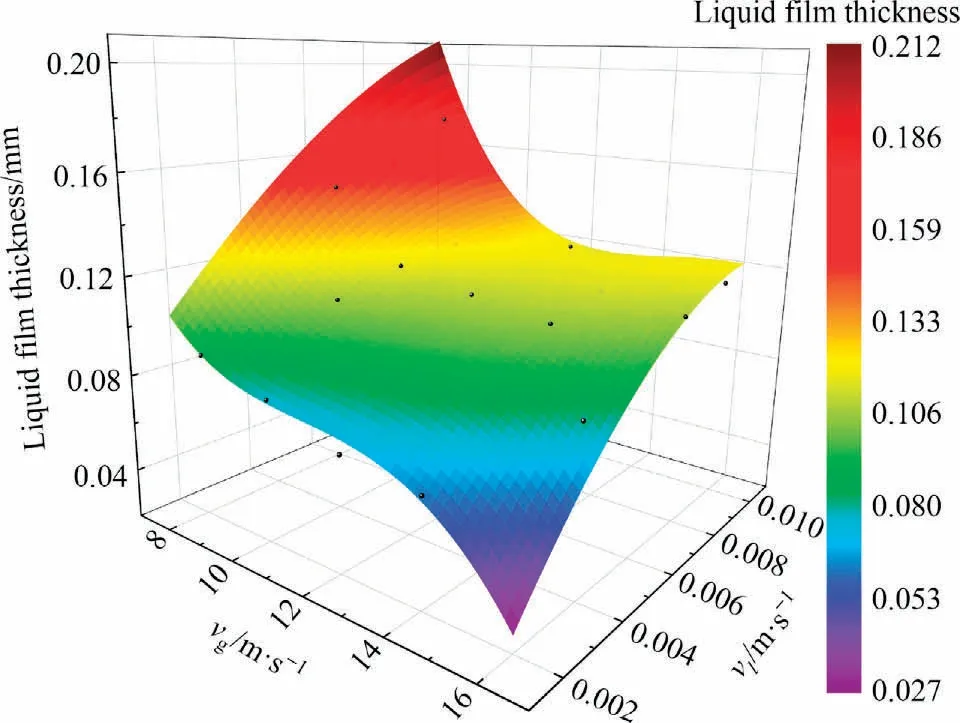
Fig.13.Response surface of liquid film thickness to flow conditions of two phases.
The hydraulic retention time (HRT) of liquid in microreactor is another crucial factor influencing the diffusion of gas in liquid flow.It reflects the contact time of two phases in the reactor.The surface renewal theory assumes that the gas-liquid contact time on the interface is an arbitrary value of from zero to infinity,and considers that the residence time of the liquid element on the interface is random.Therefore,the longer the gas-liquid contact time,namely the larger the HRT,the more times the liquid elements on the gasliquid interface are updated which is conducive to more gas elements entering into and diffusing in liquid phase.
The HRT of liquid,calculated as Eq.(14), is extracted under different flow conditions.Similarly,considering the flow instabilities,the value of liquid HRT is time-averaged.
where V is the liquid volume in the two-phase mixing region of microreactor, and Qsis the inlet volume flow rate of liquid.
As shown in Fig.14,the liquid HRT decreases both with gas and liquid flow velocities.The difference is the decrease of liquid HRT with gas speed is slower than that with liquid speed.That means the accelerating effect of gas shearing on liquid is strong when liquid flows slowly.Therefore, for improving the liquid HRT, the liquid speed should be decreased, and if the liquid speed is reduced to a relatively low level the gas speed should be decreased at the same time.
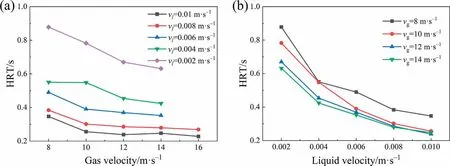
Fig.14.Variations of hydraulic retention time (HRT) of liquid with velocities of (a) gas flow and (b) liquid flow.
3.4.Effect of velocity on convective mass transfer
The change of flowing passageway and the interaction between phases both generate instabilities in gas and liquid flows after them flowing into the microreactor.The flow instabilities mainly lie in that the phase interface fluctuates continuously with flow and there are local turbulences in gas flow.Either kind of instability is conducive to improve the convective mass transfer property of the annular flow.In addition, for incompressible fluids, the deformation of the phase interface means that the elements of liquid bulk can move to the phase interface and contact with the gas phase to enhance mass transfer.
The fluctuations of two-phase interface with flow in the straight channel are extracted and averaged in time and space under different gas and liquid flow conditions.And the frequency and amplitude of the fluctuations in frequency domain are obtained from that in time domain by means of fast Fourier fransform (FFT), as shown in Fig.15.

Fig.15.Frequency and amplitude of phase interface fluctuations under different flow conditions.
It can be found that the fluctuation frequency mainly locates in the low-frequency region (0-100 Hz) and the variation tendency and range of fluctuation amplitude are similar under the calculation flow conditions.Specially,for flow conditions of vg=8 m·s-1&vl= 0.004 m·s-1,vg= 10 m·s-1&vl= 0.004 m·s-1,vg= 12 m·s-1&vl= 0.006 m·s-1, etc., there are distinctive fluctuations in the intermediate-frequency region (100-200 Hz) and the variation range of fluctuation amplitude in these cases becomes smaller.In order to search for the more explicit relationship of fluctuation with flow condition,the amplitude-weighted average value(calculated as Eq.(15))for frequency of each curve in Fig.15 is calculated and presented in Fig.16.

Fig.16.Relationship between fluctuation frequency and gas-liquid Reynolds number ratio.
It can be seen that the value of the averaged fluctuation frequency oscillates and gradually increases with Reg/Rel, and the oscillation is more frequently under low Reg/Rel.Thereby, from the perspective of intensifying the property of convective mass transfer,the flow velocity ratio of gas to liquid should be increased so that the two-phase interface can have stronger fluctuations.
As for the instabilities inside each phase,considering the liquid flow rate is quite small, only the turbulence inside the gas flow is researched in the present study.Thereupon, the vorticity in gas flow in the straight channel is obtained and averaged in time and space.As shown in Fig.17, the vorticity in gas flow increases both with gas and liquid flow velocities.Namely, the flow velocity increases of both phases can obviously intensify the local convective mass transfer property of gas flow.
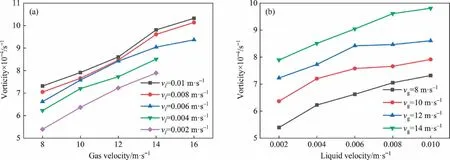
Fig.17.Variations of vorticity in gas flow in the straight channel with velocities of (a) gas flow and (b) liquid flow.
3.5.Mass transfer relationships and multi-objective optimization
In the above sections, we analyzed the effects of gas and liquid flow velocities on the main factors, i.e., flow pattern, liquid film thickness,liquid hydraulic retention time, phase interface fluctuation,gas flow vorticity,which influence the mass transfer property of gas-liquid two-phase annular flow.On the basis of above results, the fitting relationships between flow velocities and mass transfer influencing factors, i.e.liquid film thickness (σ), liquid hydraulic retention time(T),gas flow vorticity(Ω),are established as Eqs.(16)-(18), respectively.
Comparing the results from calculations using Eqs.(16)-(18)and simulations, the R2and root mean squared error (RMSE) of these fitting relationships are respectively above 0.97 and below 0.04 as shown in Table 3, indicating relatively high degrees of accuracy.

Table 3 Accuracies of fitting relationships
From the above analyses it can be found that gas and liquid speeds have different influences on different mass transfer influencing factors,while these factors are interrelated in flow.In order to get the two-phase velocity conditions under which the annular flow has best mass transfer property, the method of multiobjective particle swarm optimization (MOPSO) is utilized on the basis of the above established fitting relationships.
To get the best mass transfer property for the annular flow,the three influencing factors of σ,Ω and T should be as large as possible simultaneously.This optimization question can be described using Eq.(19).
where V ∈R2and is a two-dimensional vector constituted by gas and liquid velocities, and σ(V), Ω(V), T(V) are objective functions.On the basis of the above analyses, there are conflicts when simultaneously optimizing the three objective functions of σ(V), Ω(V)and T(V).It means that the multi-objective optimization problem has no unique global optimal solution making all objective functions optimal.Therefore, the Pareto front of two-phase velocity is obtained and presented in Fig.18(a), which is a surface consisted of Pareto optimal solution set of gas and liquid velocity conditions for the best flow mass transfer property.As shown in Fig.18(b),the optimal velocity range of gas is 11.271-13.074 m·s-1and liquid is 0.00592-0.00664 m·s-1.
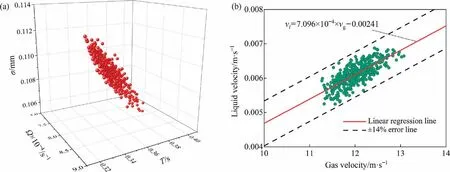
Fig.18.Pareto optimal solution set of gas and liquid velocity conditions for the best flow mass transfer property: (a) Pareto front; (b) optimal gas and liquid velocities.
In order to verify the above optimal solutions, some SO3-DDB sulfonation experiments are carried out in the microchannel.As shown in Table 4, three groups of experimental conditions (optimal operating conditions)are taken according to the linear regression equation in Fig.18(b) within the range of optimal conditions.Meanwhile, other two groups of experimental conditions (nonoptimal operating conditions)are taken out of the range of optimal conditions for comparison.

Table 4 Verification experiments for the optimal solutions
It can be seen from Table 4 that the DBSA yield under the optimal operating condition is obviously higher than that under the non-optimal operating condition.Therefore, our fitting Eqs.(16)-(18) and optimal solutions obtained from MOPSO have important guiding significance for enhancing the mass transfer property of annular flow in the similar microreactor.
4.Conclusions
The mass transfer mechanism and relationship of gas-liquid annular flow in a microfluidic cross-junction device is researched in the present study.The main conclusions are as follows.
(1) The main factors,i.e.,flow pattern,liquid film thickness,liquid hydraulic retention time,phase interface fluctuation,gas flow vorticity, which influence the flow mass transfer property, are directly affected both by gas and liquid flow velocities.But the influences of gas and liquid velocities on different mass transfer influencing factors are different.
(2) The fitting relationships between gas and liquid flow velocities and mass transfer influencing factors, i.e.liquid film thickness,liquid hydraulic retention time,gas flow vorticity,are established.By comparing the results from calculations using fitting equations and simulations,it shows that the fitting equations have relatively high degrees of accuracy.
(3) In order to get the two-phase velocity conditions for the best flow mass transfer property, the method of multi-objective particle swarm optimization is utilized on the basis of the established fitting relationships.Finally, the Pareto front,namely the Pareto optimal solution set, of gas and liquid velocity conditions for the best flow mass transfer property is obtained.It is proved that the mass transfer property of the gas-liquid two-phase flow can be obviously enhanced under the guidance of the obtained Pareto optimal solution set through experimental verification.
Data Availability
Data will be made available on request.
Declaration of Competing Interest
The authors declare that they have no known competing financial interests or personal relationships that could have appeared to influence the work reported in this paper.
Acknowledgements
The author would like to acknowledge the financial assistance provided by the National Natural Science Foundation of China(22178241, 21908152 and 21978189) and State Key Laboratory of Chemical Engineering, China (SKL-ChE-21A01).
 Chinese Journal of Chemical Engineering2023年12期
- Chinese Journal of Chemical Engineering的其它文章
- Intrinsic kinetics of catalytic hydrogenation of 2-nitro-4-acetylamino anisole to 2-amino-4-acetylamino anisole over Raney nickel catalyst
- Experiments and model development of p-nitrochlorobenzene and naphthalene purification in a continuous tower melting crystallizer
- α-Synuclein: A fusion chaperone significantly boosting the enzymatic performance of PET hydrolase
- Influence of water vapor on the separation of volatile organic compound/nitrogen mixture by polydimethylsiloxane membrane
- Enhanced photocatalytic activity of methylene blue using heterojunction Ag@TiO2 nanocomposite: Mechanistic and optimization study
- Comparative analysis on gas-solid drag models in MFIX-DEM simulations of bubbling fluidized bed