
Simulation based on a modified social force model for sensitivity to emergency signs in subway station
2023-03-13 09:18ZhengYuCai蔡征宇RuZhou周汝YinKaiCui崔銀鍇YanWang王妍andJunChengJiang蔣軍成
Chinese Physics B 2023年2期
Zheng-Yu Cai(蔡征宇) Ru Zhou(周汝) Yin-Kai Cui(崔銀鍇) Yan Wang(王妍) and Jun-Cheng Jiang(蔣軍成)
1Jiangsu Key Laboratory of Hazardous Chemicals Safety and Control,College of Safety Science and Engineering,Nanjing Tech University,Nanjing 211816,China
2Department of Public Administration,School of Law,Nanjing Tech University,Nanjing 211816,China
Keywords: modified social force model,emergency evacuation,insensitive pedestrians,emergency signs layout
1.Introduction
The rapid development of the urban economy has shown a large number of residents settling in cities.This swift increase in the urban population puts significant pressure on urban transportation systems.[1-4]The subway has become the primary travel tool for city residents due to its characteristics of large volume,punctuality,and fast speed.[5-7]The disadvantages of the subway are concentrated personnel density during rush hours and the need for unique underground structures.[8]These factors create a significant safety concern in the event of a fire,where evacuation becomes a considerable problem.[9-11]To address this problem,simulation technology has emerged as an essential method for studying subway station evacuation.
Numerous scholars have proposed various pedestrian dynamics models for studying the behavior and characteristics of crowd flow, including the cellular automata model,[12-15]the social force (SF) model,[16,17]the multigrid model,[18,19]the agent-based model,[20,21]and the Vicsek model(VM).[22]Among them, VM can effectively express group motion,
where the particles with constant velocity interact with the surrounding particles through the direction of motion.Compared with VM,the SF model proposed by Helbing and Molnar[16]can better reflect the impact of people on the environment(surrounding pedestrians or obstacles).The SF model is one of the most simplified mathematical models and has been widely used in pedestrian evacuation for all types of buildings.Many scholars have revised this model to study effective exit[23-28]and pedestrians’ classification.[24,29,30]Wanget al.[31]proposed a new avoidance model to remove the exclusion force in the social force model, which was more conducive to pedestrians reaching their destinations.And Ma and Wang[32]introduced the view radius into the original SF model,studying the relationship between view radius and escape time.Many scholars have also studied the effect of information transmission in evacuation.Yuanet al.[33]analyzed the impact of two types of emergency signs(wall and ground signs)on evacuation.Maet al.[34]studied the influence of different positions of emergency signs on evacuation under different field radii,and Houet al.[35]studied the influence of evacuation leaders on the overall evacuation dynamics through an improved model.Zhouet al.[36]combined the improved social force model with the perceiving probability model, proposed three emergency sign distribution schemes, and quantitatively analyzed the impact of the number and distribution of emergency signs on pedestrian evacuation.Most of these studies focus on the type and location of emergency signs, and all pedestrians are considered as a single category.However,due to individual differences in the ability of pedestrians to identify emergency signs,it is necessary to classify pedestrians to account for their different movement patterns with different emergency signs.
In this study,pedestrians are divided into two categories:sensitive and insensitive to emergency signs.We also introduce the visual field radius into the collective behavior of pedestrians.[34]The relationship between the proportion of insensitive pedestrians and the escape time is studied under different view radii.The remaining number of people in the station hall at different time points is analyzed.We also intercept the overall evacuation of pedestrians under four visual conditions and examine the distribution of pedestrians at different time points.A new layout method is proposed,and the pedestrian evacuation under the new layout is compared.
The remainder of this study consists of the following parts.Section 2 introduces the original model and the revised social force model.Section 3 applies the modified model to an example for simulation.Finally,Section 4 summarizes our findings and presents prospects.
2.Mathematical model
2.1.Vicsek model
The VM proposed by Vicsek is a motion model for studying the interaction between particles.[22]In this study, we introduce the view radiusRiin the original model,and the position of theithparticle is updated according to
wherevirepresents the velocity of theithparticle.We add the view radius to the original model and do not consider the noise factor,the particle direction is then updated according to

where〈?θ(t)〉Rirepresents the average angle of all particles of theithparticle within the view radius ofRi.〈?θ(t)〉Riis represented by arctan[〈sinθ(t)〉Ri/〈cosθ(t)〉Ri].
2.2.Modification of the SF model
2.2.1.Social force model
The SF model is a multifactor driving model based on the Newtonian mechanics.[16]It is used to simulate the movement of pedestrians based on their interactions.It can effectively determine the individual movement of pedestrians and the interaction between pedestrians in a high-density crowd.
In the original SF model,the movement of pedestrians is affected by the attraction of the exit, the interaction between pedestrians,and the interaction between pedestrians and walls.The motion formula of the SF model is listed as follows:
wherei,j, andwdenote the pedestrians, surrounding pedestrians, and obstacles, respectively.fdesireis the attraction of the exit to pedestrians.fi jis the interaction force between pedestrians.fiwis the interaction between pedestrians and obstacles.
The componentfdesirerefers to the attraction of the exit to pedestrians, that is, the self-driving force of pedestrians to evacuate.It is defined as
wheremiis the mass of pedestriani,vi(t)is the expected speed of pedestriani,ei(t) is the direction of the desired velocity,vi(t)is the actual speed of pedestrianiat timet,andτirepresents the interval of pedestrian response time.
Componentfijis the resultant force between pedestrianiand adjacent pedestrianj
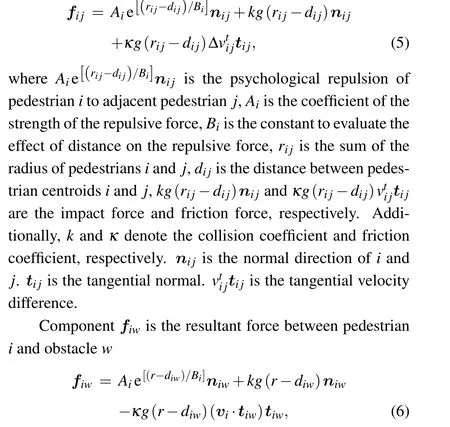
whereris the radius of the pedestrian,diwis the distance between the pedestrian’s center position and the obstaclew,niwis the normal direction ofiandw, andtiwis the tangential direction.
The functiong(x)is expressed as
whenxis less than 0,the value ofg(x)is equal to 0,meaning that the pedestrians do not have contact.
2.2.2.Modified SF model considering sensitivity to emergency signs
The original SF model is modified in this study, and the pedestrians are divided into sensitive and insensitive pedestrians.Houet al.[35]added the leader factor to the original SF model,in which the leader was aware of a clear exit direction,and their speed was slower than sensitive pedestrians.The results showed that the presence of a leader was more conducive to guiding evacuation.Therefore, we believe that evacuation signs also significantly impact the pedestrian evacuation process.When the pedestrians find an evacuation sign during the evacuation process,they will continue to move in the direction indicated.Thus,evacuation signs can help pedestrians get out of the station hall more effectively.
According to the VM,[22]the view radius is introduced into the SF model,it reflects the range that the pedestrian can see in the smoke environment of fire.When pedestrians cannot see the exits and evacuation signs because of their reduced field of vision, they will exhibit herding behavior.We also consider that some pedestrians will be insensitive to evacuation signs due to low safety awareness,panic during the evacuation,etc..Therefore,insensitive pedestrians may not be able to follow the instructions with evacuation signs to make corresponding movements.The specific pedestrian classification is shown in Fig.1.The following equation represents the direction of pedestrian movement under different conditions:
if the pedestrian can see the exit in the field of vision, pedestrianiwill move towards the exit,wherereindicates the middle of the exit;
if pedestrianicannot see the exit,but the evacuation sign appears in the field of vision,the pedestrians move according to the direction of the evacuation sign, wherere-rsstands for the direction of the evacuation sign to the exit.When two or more emergency signs appear at the same time in the pedestrian’s field of vision radius,the probability of the pedestrianichoosing evacuation signnis
whereH=∑nexp(-sin),sinrepresents the distance between pedestrianiand evacuation signn.Pedestrians are more likely to choose signs closer to themselves,as shown in Fig.2.When the exit is not in the field of vision, the probability of pedestrians choosing the exit is the same.When the exit appears in the vision, only the distance is considered as the standard for the exit selection.The pedestrian’s field of view radiusRiand distance functiong(r)are listed as follows:
whereRirepresents the radius of the current field of vision,rinis the distance between pedestrianiand the exit,andkris the distance index, taken as 1 in this study.Helbinget al.[17]introduced the pedestrian panic factorpi.The following formula expresses the herd behavior of people in panic:
wherepireflects the panic level of pedestriani,〈e0j(t)〉irepresents the average motion direction of pedestrianjaround pedestriani, and Norm is vector normalization.The whole equation shows that the degree of panic affects individual movement.When there are no exits and evacuation signs in the field of view radius of sensitive pedestrians,they are prone to panic and exhibit herd behavior.We also believe that insensitive people are prone to herding behavior before the exit due to their low sensitivity to evacuation signs.Thus,whenpiincreases,the herd behavior of pedestrians is more prominent.When the value ofpiis smaller, it indicates that pedestrians have a clear escape direction and individual behavior is more noticeable.

Fig.1.Pedestrian classification flow chart.
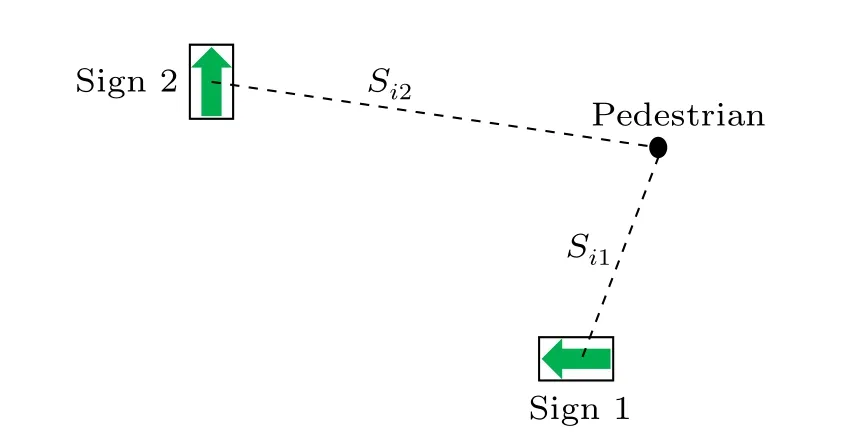
Fig.2.Pedestrian selection probability when multiple signs appear in the pedestrian field of vision.
3.Simulations and analysis
The h-shaped station hall of a subway station in Nanjing was taken as an example, written in C language, and simulated on Linux (shown in Fig.3).The evacuation in the fire of a subway station was simulated,and the smoke concentration was reflected by the view radius.To ensure the authenticity of the simulation, the size of the subway station hall is from the operational station with 70 m long and 16 m wide.The exit width is about 3 m,and three exits are distributed on both sides of the station hall.The evacuation indication signs were restored according to the actual situation.The number of simulated people wasN=400,which simulated the actual population density at rush hour according to the code for safe evacuation of metro.[37]The positions generated by pedestrians in each simulation were random, and the expected speed of pedestrians in different states was varied.The initial speed of each pedestrian wasvni=1 m/s,and when sensitive pedestrians encountered evacuation signs or exits,the speed reachedvei=1.5 m/s.[17]
The insensitive pedestrians did not accelerate when they saw the evacuation signs.Only when they were attracted by the exit, their speed reached 1.5 m/s.The panic factor of pedestrians before encountering evacuation signs or exits waspni=0.8.When signs or exits appeared in the vision of sensitive pedestrians,they could obtain clear escape information,their behavior became more apparent,and the panic factor was 0(pe/si=0).However,only when insensitive pedestrians saw the exit,the panic factor dropped to 0(pei=0).When pedestrians left the exit passage,the system automatically removed them.The detailed pedestrian parameters used in the simulation are shown in Table 1.
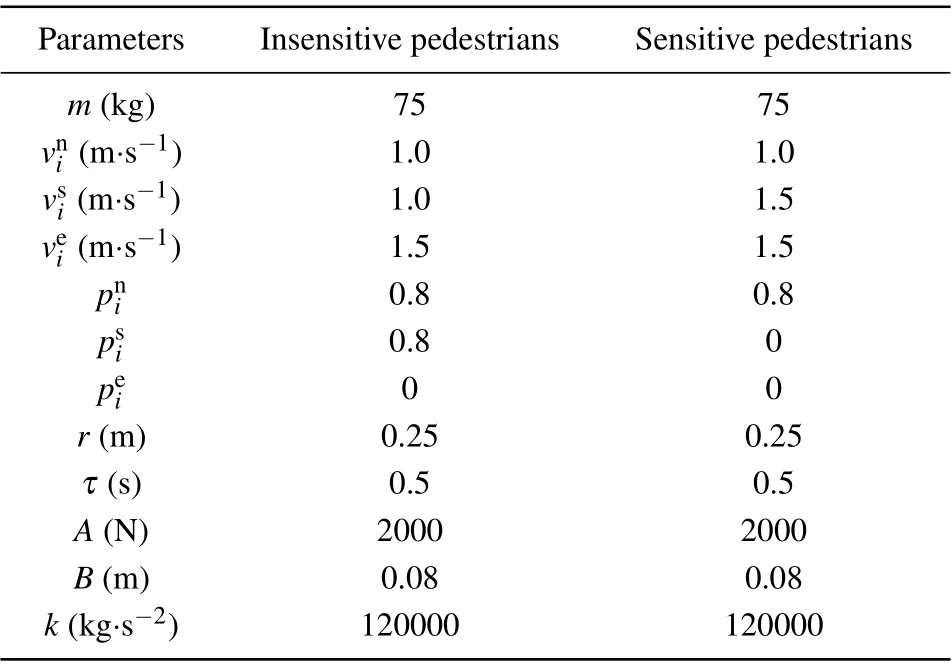
Table 1.Detailed parameters of pedestrians.

Fig.3.Plan of subway station hall.
3.1.Pedestrian dynamic of original emergency signs layout
The relationship between the proportion of insensitive pedestrians and escape time under different view radius conditions is shown in Fig.4.As it is impossible for all pedestrians to be insensitive pedestrians,we set the upper limit of the proportion of insensitive pedestrians to 60%.The different proportions of the two types of pedestrians are shown in Table 2,
where each group is simulated 10 times.When the view radius of pedestrians increases from 5 m to 10 m,it can be seen that the escape time decreases significantly with the increase of the view radius.This shows that sensitive pedestrians can obtain more evacuation information and have a clear escape route with the increase of the view radius.Their movement direction also affects insensitive pedestrians.In this case,sensitive pedestrians play the role of dynamic information guides to lead insensitive pedestrians to the correct exit.With an increase in the proportion of insensitive people, this guidance effect is gradually weakened,which increases the escape time.However,it should be noted that the impact of the proportion of insensitive pedestrians on the escape time is significantly greater whenRi=10 m than whenRi=5 m.
Therefore, takingRi=5 m andRi=10 m as examples,we compare the rest of the number of these two types of pedestrians with the same number in the station hall at different time nodes.The result is shown in Fig.5.It can be observed that when the view radius is large,there are more insensitive people left in the station hall at the later stage of evacuation.Whent=40 s in Fig.5(a), there are 53 insensitive people and 25 sensitive pedestrians.However,Fig.5(b)shows that when the escape time reaches 40 s, 40 insensitive pedestrians are left,while only 11 sensitive pedestrians are left.Whent=50 s,the number of sensitive pedestrians in the station hall in Fig.5(b)is 0.

Table 2.Proportions of the two categories of pedestrians.
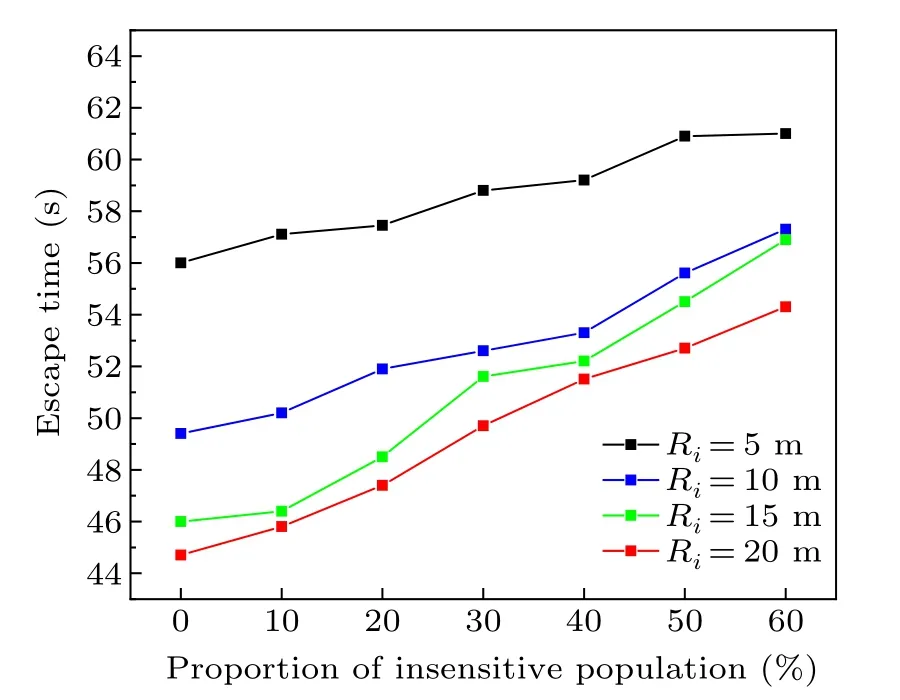
Fig.4.Relationship between the proportion of insensitive people and escape time under different view radii.

Fig.5.The number of pedestrians in the station hall at different time nodes under two vision conditions when the proportion of the insensitive population is 50%.
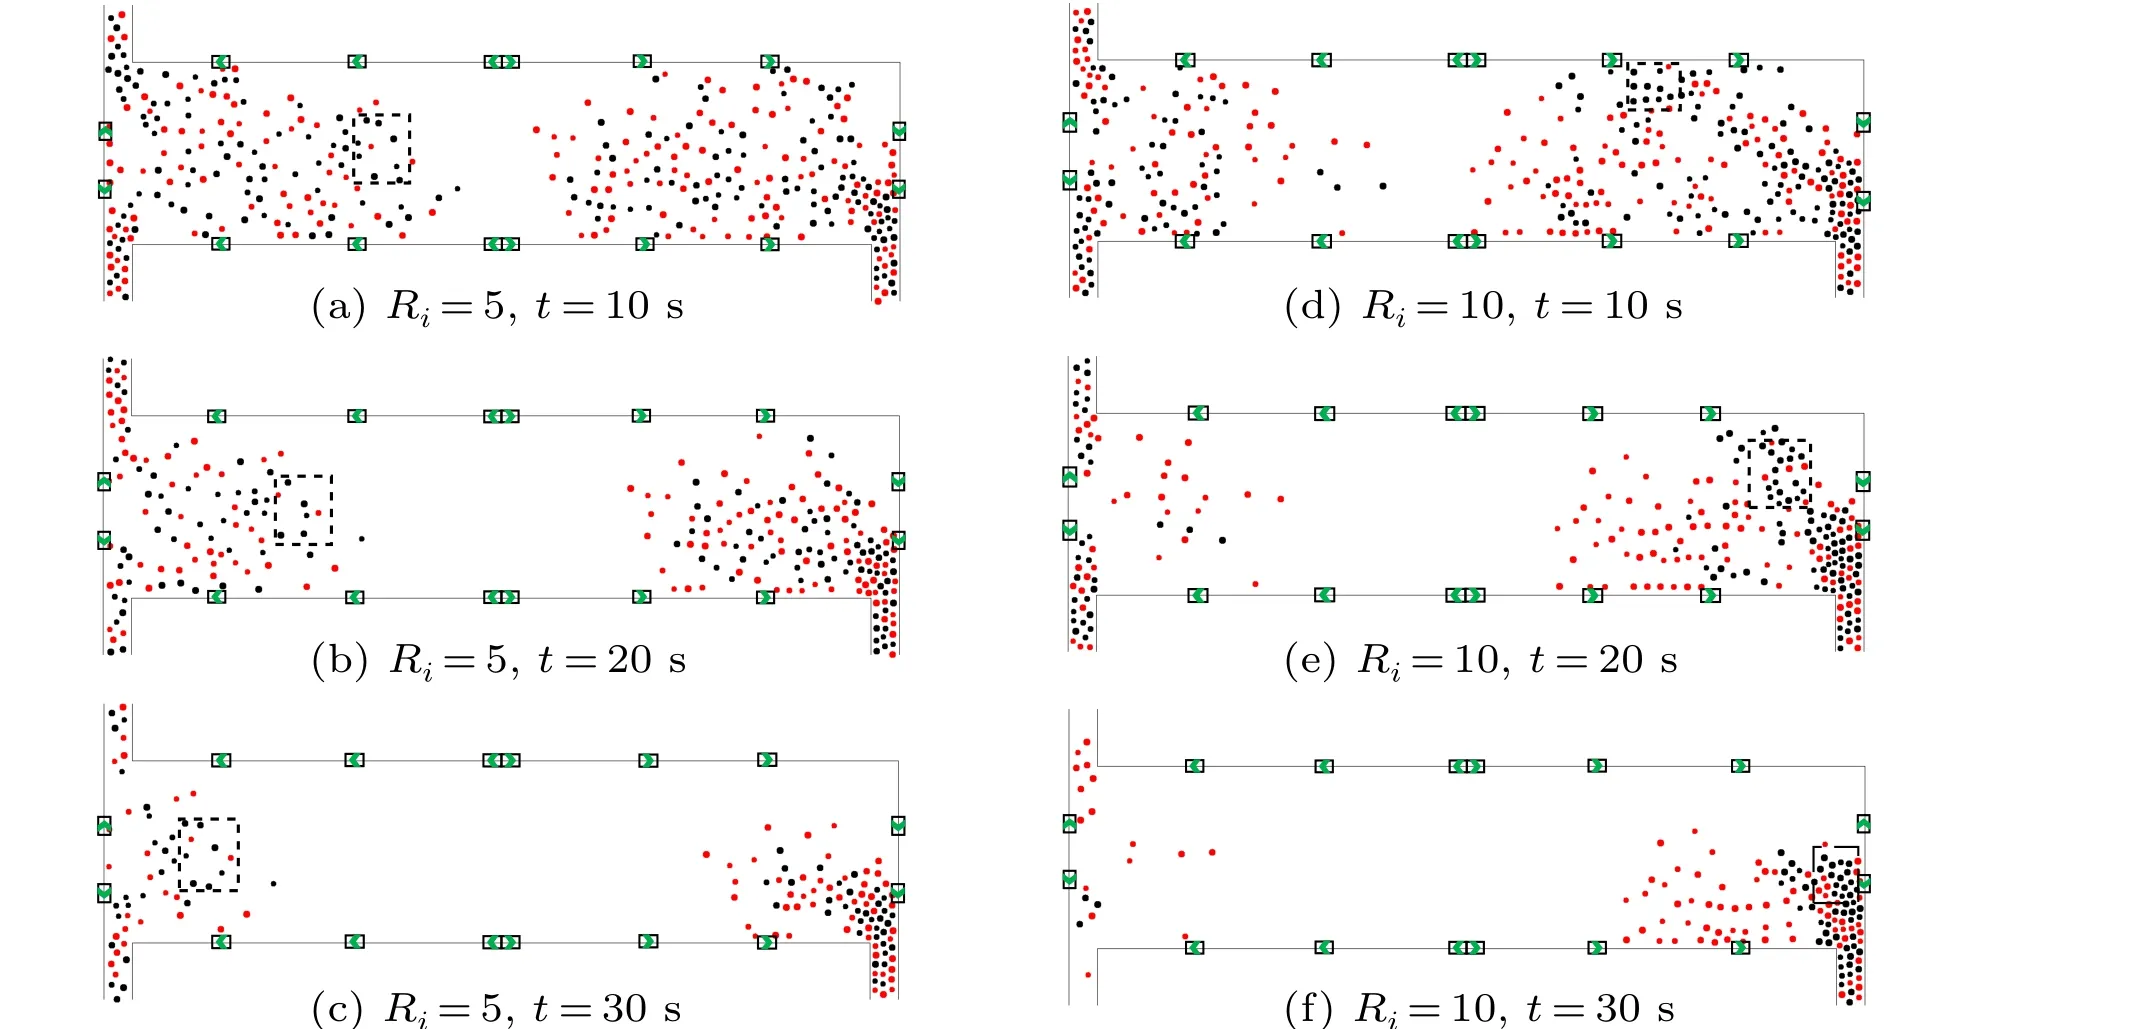
Fig.6.Pedestrian evacuation at three time nodes under two visual conditions when the proportion of the insensitive population is 50%.
In the early evacuation stage, the number of the rest of the two types of pedestrians in the station hall is very close under any vision,but the time of the turning point is different.When the radius of vision is 5 m,a large number of sensitive pedestrians walk out of the station hall between 20 s and 30 s.However, when the field radius is 10 m, this situation occurs between 10 s and 20 s.Therefore,we analyze the evacuation process of the station hall with the same number of the two types of pedestrians, as shown in Fig.6.The red dots represent insensitive pedestrians,and the black dots represent sensitive pedestrians who respond quickly to evacuation signs.Figures 6(a)and 6(c)show the pedestrian distribution in the evacuation process at each time node when the visual condition is 5 m.The visual conditions are relatively poor, the escape information that pedestrians can obtain is limited, and pedestrians are seriously disturbed by herd behavior.Thus, the escape time is relatively longer.We select some pedestrians with black dashed frame lines whent=10 s.It can be observed that the overall trend of pedestrian evacuation is the same with an escape time between 10 s and 30 s.Figures 6(d)and 6(f)show the pedestrian distribution in the evacuation process when the view radius is expanded to 10 m.It can be observed that with the expansion of the view radius, more pedestrians can obtain escape information,and the escape time of pedestrians is reduced.Meanwhile,the individual behavior of pedestrians is more evident because of the improvement in visual conditions.In the black dashed frame line,sensitive pedestrians will overtake insensitive pedestrians to reach the exit faster.Comparing Figs.6(b)and 6(e),sensitive pedestrians with clear escape information go to the exit more quickly because of the improvement in visual conditions.There are more insensitive pedestrians in the middle of the station hall.This phenomenon is more evident in Figs.6(c) and 6(f).Therefore, with a small view radius,the escape time increases slightly with the increase of the proportion of insensitive people.However, with the improvement of visual conditions,the change in escape time with the proportion of insensitive people will be more obvious.As shown in Fig.4, when comparing the view radii of 15 m and 20 m,it is found that when the visual field range enlarges to a certain extent, the escape time changes lightly.The visibility may no longer be an essential factor affecting the escape time.As there are two exits on the left side of the station hall, the utilization rate of the left exit is higher than that of the right exit.The pedestrian density at the right exit is high, and the pedestrians become increasingly crowded,forming a blocking effect at the exit.In this case,the exit setting may also become an essential factor affecting the escape time.
3.2.Pedestrian dynamic of new emergency signs layout
To make the whole evacuation process more coherent,reduce information blind areas during the evacuation,and maximize the utilization of each escape indication sign,we present a new layout of the ground emergency signs in the station hall.The proposed layout is shown in Fig.7.The current view radiusRiis taken as the distance between emergency signs so that sensitive pedestrians can maintain the correct escape direction during the whole evacuation process.At the same time,the moving direction of sensitive pedestrians also affects the moving direction of insensitive pedestrians.Four visual environments are simulated to test the rationality of the layout under this layout condition.
Figure 8 shows the relationship between the proportion of insensitive pedestrians and escape time under the new layout conditions,compared with the previous simulation results in Fig.4.A significant variation in escape time can be observed under the new escape sign layout.Firstly, the escape time of pedestrians is significantly reduced,indicating that the improved sign layout is indeed conducive to pedestrian evacuation.The view radius is taken as the standard of the distance between emergency signs.The information blind area is significantly reduced.From Figs.8(a) and 8(b), the changing trend of escape time in the new layout is more noticeable than that of in the original escape sign layout.This phenomenon is more evident in the small view radius environment.In addition,we also find that the smaller the proportion of insensitive pedestrians,the more significant the role of the new evacuation sign layout.With an increase in the proportion of insensitive pedestrians,the escape time difference between the two layout conditions gradually decreases.Figures 8(c)and 8(d)show the relationship between the proportion of insensitive pedestrians and escape time under the new evacuation sign layout when the field of vision reaches 15 m and 20 m.It can be observed that compared with the original layout,the impact of the new evacuation sign layout on the escape time will become increasingly weaker.WhenRi=20 m,there is almost no difference between the escape time under the new layout and the original layout.This shows that the impact of the new layout on the escape time is more evident in the small view radius.
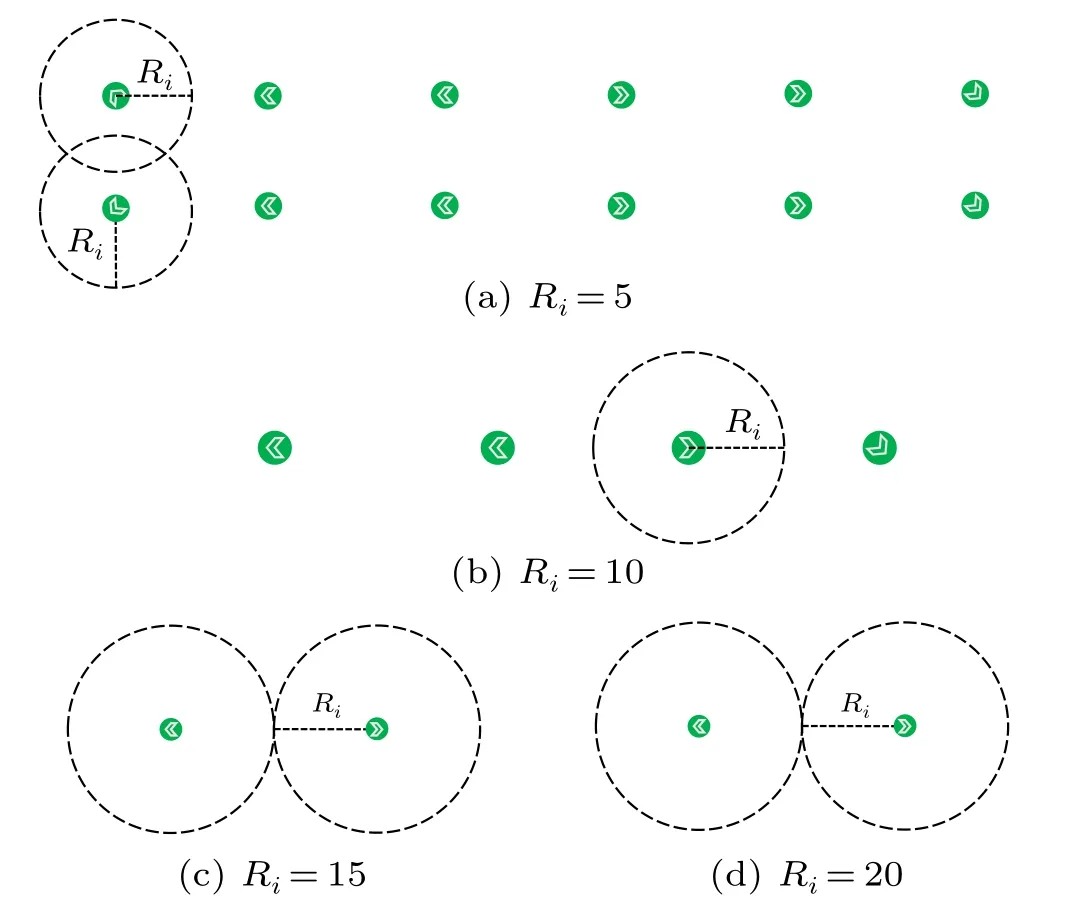
Fig.7.The layout of ground escape signs improve according to the field of view radius.
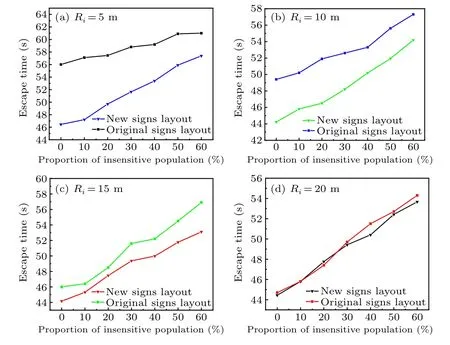
Fig.8.The relationship between escape time and the proportion of insensitive pedestrians under four visual conditions using the new emergency sign layout and compared with the previous layout simulation results.
In order to further explore the impact of the new layout on pedestrian evacuation from a small view radius, we analyze the distribution of pedestrians in the evacuation process whenRi=5 m.Figure 9 shows the evacuation situation at different time nodes with three proportions of 10%,30%,and 50%, and the view radius is 5 m.The evacuation of pedestrians in Fig.9 is very different from that in Fig.6.No matter what proportion,insensitive pedestrians are separated from the crowd.With an increase in their proportion,more insensitive pedestrians stay in the station hall.The evacuation will no longer be holistic, even in the small field of vision environment.Because the layout of the new emergency signs can provide more escape information to sensitive pedestrians,the individual behavior of sensitive pedestrians will be more prominent,and they will quickly surpass insensitive pedestrians.Figure 9 shows that an increasing number of insensitive pedestrians will be left in the station hall with an increase in the proportion of insensitive pedestrians.Therefore,compared with the original escape sign layout,the escape time of pedestrians will change significantly with an increase in the proportion of insensitive people, and the guidance effect of the new escape sign layout will weaken.

Fig.9.Pedestrian evacuation in the station hall at different time nodes with the new emergency signs layout when the view radius Ri=5 m and the proportion of insensitive pedestrians is 10%,30%,and 50%.
To verify the effectiveness of the modified SF model,we compare the evacuation simulation results of the four visual fields under the new layout with pathfinder simulation results.The comparison is shown in Fig.10,and Table 3 provides the detailed parameter settings.With an increase in the proportion of insensitive pedestrians,the modified SF model has the same trend as the pathfinder simulation results.Due to the difference in parameter settings,the escape time will be slightly different, but the same growth trend proves the effectiveness of the modified SF model.

Table 3.Detailed parameters of the pedestrians in pathfinder.
In this situation, the exit setting may become the main factor affecting the escape time.Therefore, taking the view radiusRi=20 m as an example, we change the station hall’s exit width and conduct the simulation again.The results are shown in Fig.11.When the exit width is expanded from 3 m to 4 m, the escape time is reduced, but the escape time is not notably different.Due to the long length of the station hall,the three exits are distributed on both sides.It may be more effective to add another exit in the middle of the station hall than to increase the width of the original exit.However, the exit layout is not the focus of this study.

Fig.10.Comparison between the simulation results of four visual fields under the new signs layout and pathfinder simulation results.

Fig.11.The relationship between escape time and the proportion of insensitive pedestrians when the exit width is 3 m,3.5 m,and 4 m.
4.Conclusion
In this work,the modified SF model with the view radius from VM was proposed by dividing pedestrians into sensitive and insensitive pedestrians.A subway station hall in Nanjing was used as the simulation scene to observe how pedestrians escape from a station hall.The results are listed as follows:
(i)The escape time was directly proportional to the number of insensitive pedestrians and inversely proportional to the view radius.However,when the view radius was large enough,the change in escape time was no longer noticeable.
(ii)The results indicated that the evacuation of people in a small view environment tended to be more integrated.With the increase in visual field radius, pedestrians could obtain more evacuation information, and the individual behavior of pedestrians was more prominent.
(iii)A new emergency sign layout was presented by taking the current pedestrian field of vision radius as the distance between emergency signs, which could ensure the continuity of pedestrian evacuation and reduce the blind area of pedestrian evacuation.
(iv) This new layout could effectively reduce the escape time,whenRi=5 m,the change in escape time was more obvious with an increase in the proportion of insensitive pedestrians.But, when the view radius was larger, the change was little.
(v) When the radius of view was large, the escape time under the new layout was not much different from the original layout.WhenRi=20 m,there was almost no disparity.
(vi) Increasing the exit width could reduce the escape time to a certain extent.
In subsequent work,we will study the choice of two types of pedestrians for multiexits,set the corresponding evacuation mechanism according to the pedestrian density of exits.And consider how the model can be applied to real life.
Acknowledgments
Project supported by the National Natural Science Foundation of China(Grant Nos.51874183 and 51874182)and the National Key Research and Development Program of China(Grant No.2018YFC0809300).
Appendix A

Table A1.The following symbols are used in this study.

- Chinese Physics B的其它文章
- Matrix integrable fifth-order mKdV equations and their soliton solutions
- Comparison of differential evolution,particle swarm optimization,quantum-behaved particle swarm optimization,and quantum evolutionary algorithm for preparation of quantum states
- Explicit K-symplectic methods for nonseparable non-canonical Hamiltonian systems
- Molecular dynamics study of interactions between edge dislocation and irradiation-induced defects in Fe-10Ni-20Cr alloy
- Engineering topological state transfer in four-period Su-Schrieffer-Heeger chain
- Spontaneous emission of a moving atom in a waveguide of rectangular cross section