
Analysis of refraction and scattering image artefacts in x-ray analyzer-based imaging
2023-03-13 09:20LiMingZhao趙立明TianXiangWang王天祥RunKangMa馬潤康YaoGu顧瑤MengSiLuo羅夢絲HengChen陳恒ZhiLiWang王志立andXinGe葛昕
Chinese Physics B 2023年2期
Li-Ming Zhao(趙立明) Tian-Xiang Wang(王天祥) Run-Kang Ma(馬潤康) Yao Gu(顧瑤)Meng-Si Luo(羅夢絲) Heng Chen(陳恒) Zhi-Li Wang(王志立) and Xin Ge(葛昕)
1Department of Optical Engineering,School of Physics,Hefei University of Technology,Anhui 230009,China
2Institute of Biomedical Engineering,Shenzhen Bay Laboratory,Shenzhen 518067,China
Keywords: x-ray imaging,analyzer-based imaging,image artefacts
1.Introduction
X-ray phase-contrast imaging has gained popularity owing to the ability of imaging weakly absorbing objects with a high contrast at high x-ray energies.In hard x-ray regime,the sensitivity of phase-contrast imaging is expected to be at least two orders higher than that of absorption imaging for samples made of light elements.[1]During the past two decades,x-ray phase contrast imaging relies on several interference or analyzer methods to transform the phase shifts into measurable intensity modulations in the detector plane.These techniques include x-ray crystal interferometer,[2]analyzerbased imaging,[3-6]propagation-based imaging,[7]gratingbased interferometric imaging[8-14]and edge-illumination imaging.[15,16]In recent years, the great potential of x-ray analyzer-based imaging has been explored, including but not limited to noninvasive soft tissue engineering,[17]functional lung imaging,[18]damage evolution,[19]detection of 3D printing technology,[20]measuring the airway size of emphysema[21]and imaging of fresh agricultural products.[22]
In x-ray analyzer-based imaging, x-ray refraction and scattering images have been demonstrated to provide complementary information to conventional attenuation-based radiography and computed tomography.[23]However, the sample’s absorption, refraction, and scattering signals are measured simultaneously in the acquired radiographic images.[24]This information superposition can make the image interpretation ambiguous in practical applications.Therefore,several algorithms have been developed in order to separate the three different signals and accurately quantify them.[5,25-32]Quite recently, Gaussian generalized diffraction enhanced imaging(G2DEI)algorithm has been presented to retrieve the absorption,refraction,and scattering properties of an object by use of only three intensity measurements.[31]Owing to the extended angular acceptance range,G2DEI algorithm is expected to be a quantitative characterization tool with sufficient structural sensitivity on a submicron length scale.[31]Previous studies demonstrated that precise angular positioning of the analyzer crystal within sub-arcseconds was indispensable for the precise detection of phase shifts.[33]However,external vibrations of experimental environments,as well as mechanical imprecisions of system components,e.g.,the precision of motor,can induce deviations of analyzer angular positions,and hence errors in the acquired raw data.
Image artefacts will deteriorate image quality,and hence hinders future practical applications of x-ray analyzer-based imaging.Therefore,it becomes quite necessary to quantify the refraction and scattering image artefacts resulting from deviations of analyzer angular positions.To the best of our knowledge,this topic has not been adequately studied in previous literatures.We note that in x-ray grating interferometry,stepping errors due to external vibration,thermal drift or mechanical inaccuracies will cause obvious Moir′e artefacts in the retrieved refraction and dark-field images.[34]Theoretical expressions of Moir′e artefacts were derived by using a Taylor series expansion.Based on those expressions,a simple algorithm was presented for correction and removal of these artefacts.[35]Laboratory experimental results confirmed the feasibility of the algorithm.
In this work, we present analysis of image artefacts resulting from deviations of analyzer angular positions.For refraction and scattering retrieval, we consider the G2DEI algorithm.[31]A Taylor series expansion is utilized to establish theoretical models to correlate deviations of analyzer angular positions with artefacts in the retrieved refraction and scattering images.Finally, theoretical models are verified by synchrotron radiation experiments and the obtained results are discussed.The results of this work can be useful for further development of advanced algorithms to suppress image artefacts, and for correct image interpretation, especially in applications of in-laboratory x-ray analyzer-based imaging instruments.[36-38]
2.Theoretical analysis of image artefacts
In the following, we will theoretically analyze the correlation between deviations of analyzer angular positions and artefacts in the refraction and scattering images retrieved by G2DEI algorithm.As detailed explained by Aefelliet al.,[31]the G2DEI algorithm can be traced back to the fact that the sample’s refraction generates a shift of the center of the local rocking curve by ΔθR, while Gaussian scattering with a standard deviationσ2sincreases the width of the measured local rocking curve.[25,26]The power of G2DEI algorithm relies on the Gaussian approximation of the measured rocking curve(RC).Under this approximation,three intensity measurements are acquired at three well separated analyzer angular positions for multi-contrast image retrieval.When the analyzer is set to a given angular positionθi, the intensity measured by the detectorI(θi)can be written as follows:[29,31,39,40]
whereσ2is the standard deviation of Gaussian approximated intrinsic rocking curve.Equation(1)contains three unknown parameters, including the absorptionIR, the refraction ΔθR,and the scatteringσ2s.With three acquired intensity measurementsI(θi) (i=1,2,3), the G2DEI algorithm allows quantitatively retrieval of the refraction and scattering signals on a pixel-by-pixel basis,
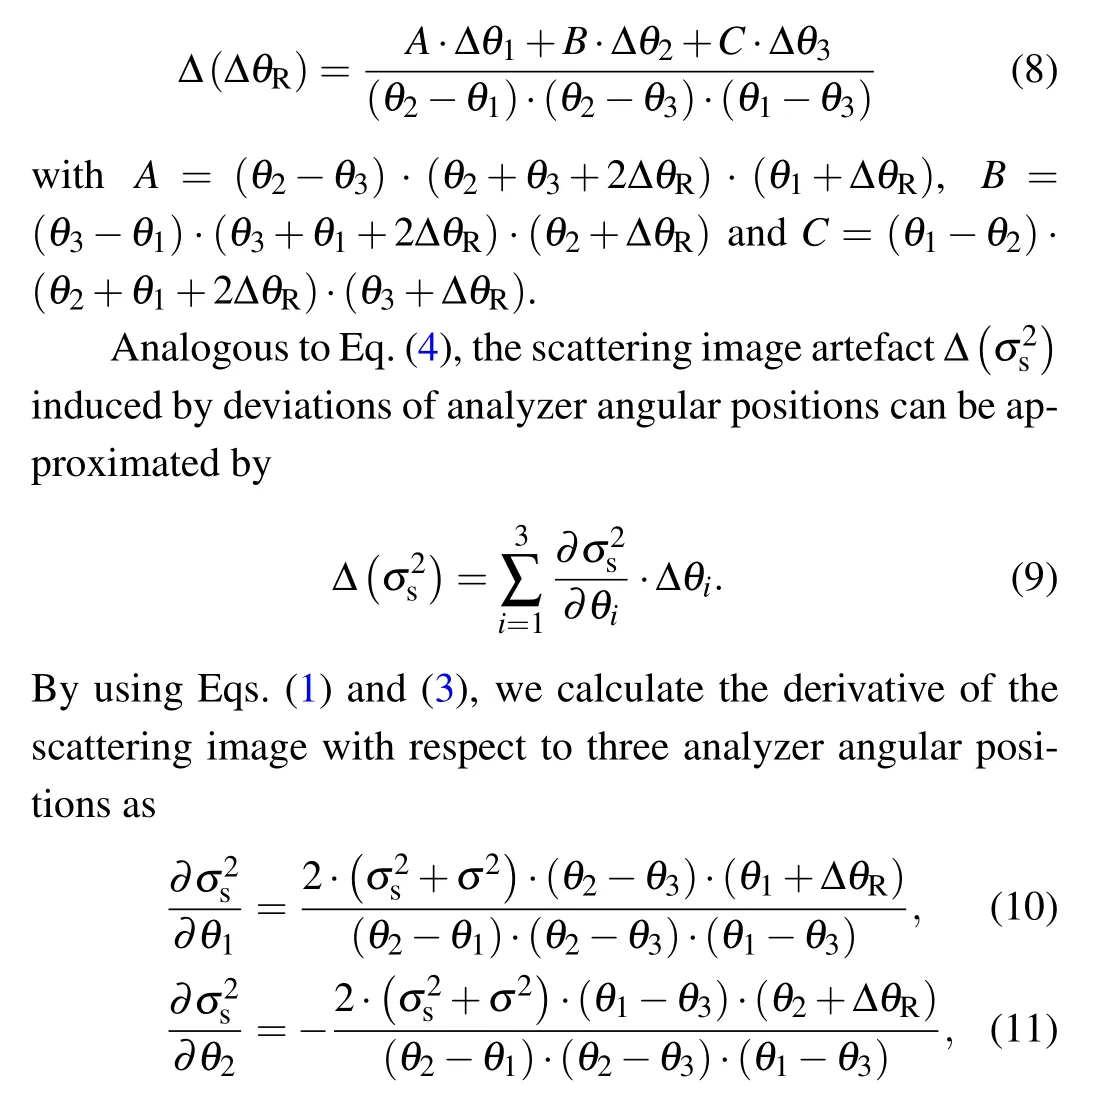
For further analysis, we define Δθi(i=1,2,3) as deviations of analyzer angular positions with respect to the target positions.A Taylor series expansion is used to examine the effects of deviations Δθion retrieved refraction and scattering images.In the case of slight analyzer angular position deviations, a Taylor series expansion can be reasonably truncated after the first order.This results in the following approximation of the influence of analyzer angular position deviations Δθion the retrieved refraction ΔθR:
where Δ(ΔθR)is specified as the refraction image artefact.By use of Eqs.(1)and(2), the derivative of the refraction image with respect to analyzer angular positionsθican be calculated as follows:
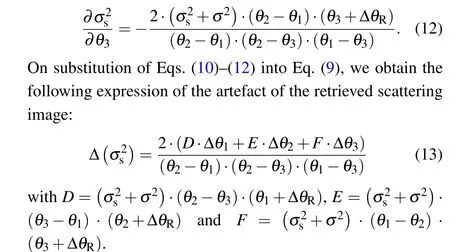
Substituting Eqs.(5)-(7)into Eq.(4)yields the following analytical expression of the refraction image artefact:
3.Experimental results
To verify the analytical results of image artefacts and visualize effects of analyzer angular position deviations on the retrieved refraction and scattering images, synchrotron radiation experiments were performed at the 4W1A beamline of Beijing Synchrotron Radiation Facility.[41]As schematically shown in Fig.1,x-ray ABI setup utilized a first Si(111)crystal to monochromize the incident x-rays.The beam with a photon energy of 15 keV was then selected and incident on the sample.The beam exiting from the sample was analyzed by a second Si(111)crystal.Finally,the intensities were recorded by a high-resolution x-ray digital camera system FDS694 by Photonic Science Ltd.,which has a small pixel size of 4.5μm.A demineralized mouse joint was used as the sample.A total of 85 intensity measurements were acquired,with the analyzer angular position ranging from-84μrad to 84μrad with an increment of 2 μrad.At each analyzer angular position,a flat-field image without sample was acquired.Three intensity measurements were selected and processed by the G2DEI algorithm, and the retrieved refraction and scattering images served as the ground truth,and were used as inputs for calculations of Eqs.(8)and(13),respectively.

Fig.1.Schematic diagram of x-ray ABI setup.
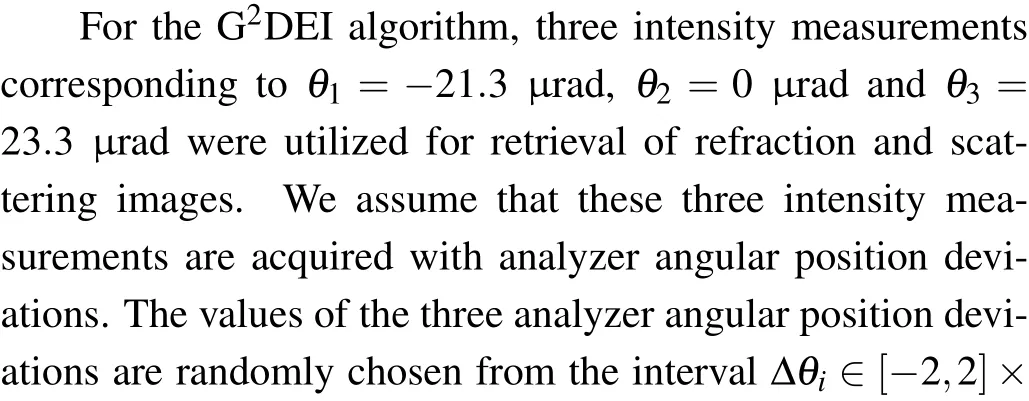
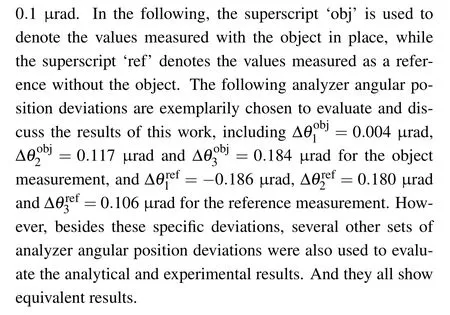
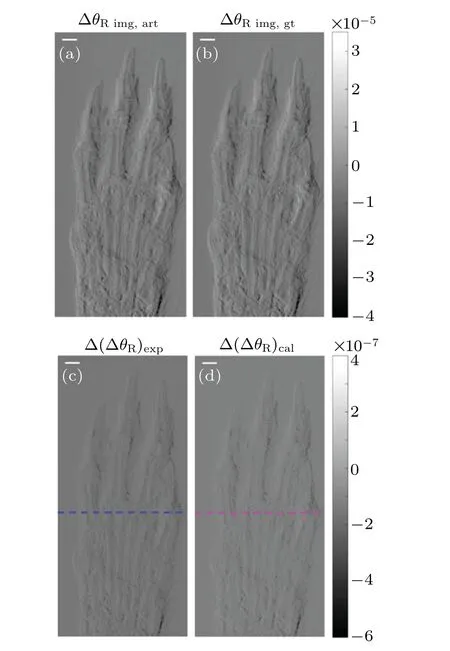
Fig.2.(a)Experimental refraction image with artefact.(b)Experimental refraction image without artefact.(c) Experimental artefact image.(d)Calculated artefact image.Scale bar is 0.45 mm.
Definingθi+Δθi(i=1,2,3)as the target positions without deviations,we can retrieve the refraction image with artefacts by applying the G2DEI algorithm to three measured intensities with analyzer angular position deviations.The retrieved refraction image with artefacts is shown in Fig.2(a)(additional subscript ‘img, art’).As a comparison, the corresponding refraction image without artefacts is shown Fig.2(b)(additional subscript ‘img, gt’).The pixelwise difference of Figs.2(a)and 2(b)is calculated,and thus the artefact image resulting from analyzer angular position deviations is deduced.While Fig.2(c)(additional subscript‘exp’)shows experimental artefact image, Fig.2(d) (additional subscript ‘cal’) displays the calculated artefact image by using Eq.(8) and the ground truth image.Qualitatively, the visual equivalence between Figs.2(c) and 2(d) verifies the validity of Eq.(8) for calculating the refraction image artefact.
For a quantitative evaluation, Fig.3 shows a line profile comparison along the line marked by the dashed line in Figs.2(c)and 2(d).The solid blue line corresponds to the experimental result, while the magenta line corresponds to theoretically calculated result.The agreement of the two line profiles is quantitatively excellent, confirmed by that the calculated correlation coefficient has a great value of 0.9981.However, the existence of some locally minor discrepancies between experimental and calculated line profiles can be explained by the first-order truncation of the Taylor series expansion used in the derivation of Eq.(8).
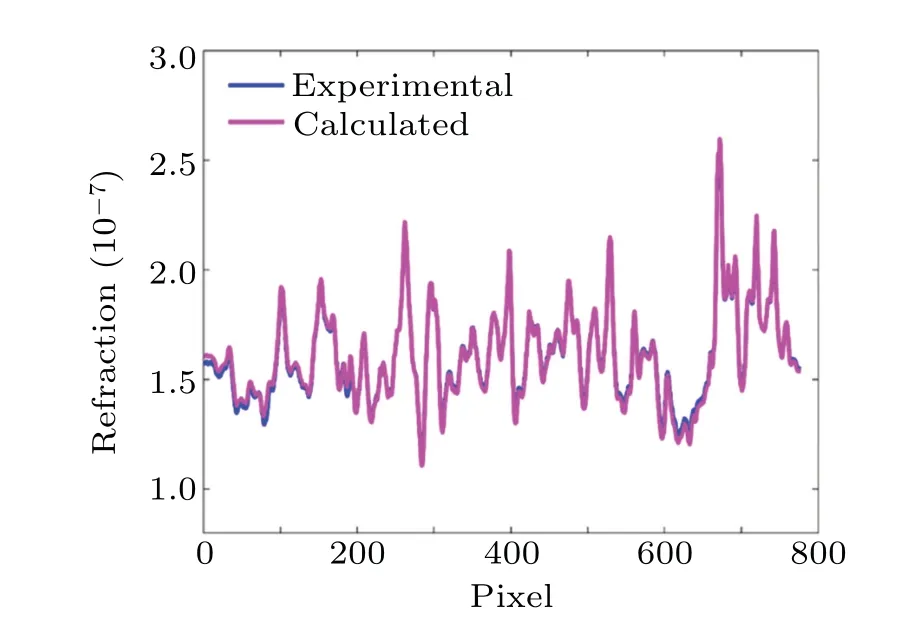
Fig.3.Line profile comparison of refraction image artefact along the dotted line in Figs.2(c)and 2(d).
Figure 4 shows the results of scattering images,retrieved by the G2DEI algorithm using the same experimental data as Fig.2.The scattering image with artefacts is shown in Fig.4(a) (additional subscript ‘img, art’), while the corresponding scattering image without artefacts is presented in Fig.4(b) (additional subscript ‘img, gt’), as the ground truth image for artefact image calculation.Figure 4(c) (additional subscript‘exp’)displays the experimental artefact image,obtained by the difference between Figs.4(a) and 4(b), and Fig.4(d) (additional subscript ‘cal’) depicts the calculated artefact image by use of Eq.(13),Figs.2(b)and 4(b).A qualitative comparison of Figs.4(c)and 4(d)clearly demonstrates that theoretically calculated artefact image agrees well the experimental image.
To obtain a quantitative evaluation, Fig.5 shows a line profile comparison of the scattering image artefacts along the dotted line in Figs.4(c) and 4(d).Despite a few slight local deviations, the two line profiles exhibit a quantitatively good agreement, supported by a calculated correlation coefficient of 0.9862.The consistence between the two line profiles confirms the validity of theoretical models of the scattering image artefact.
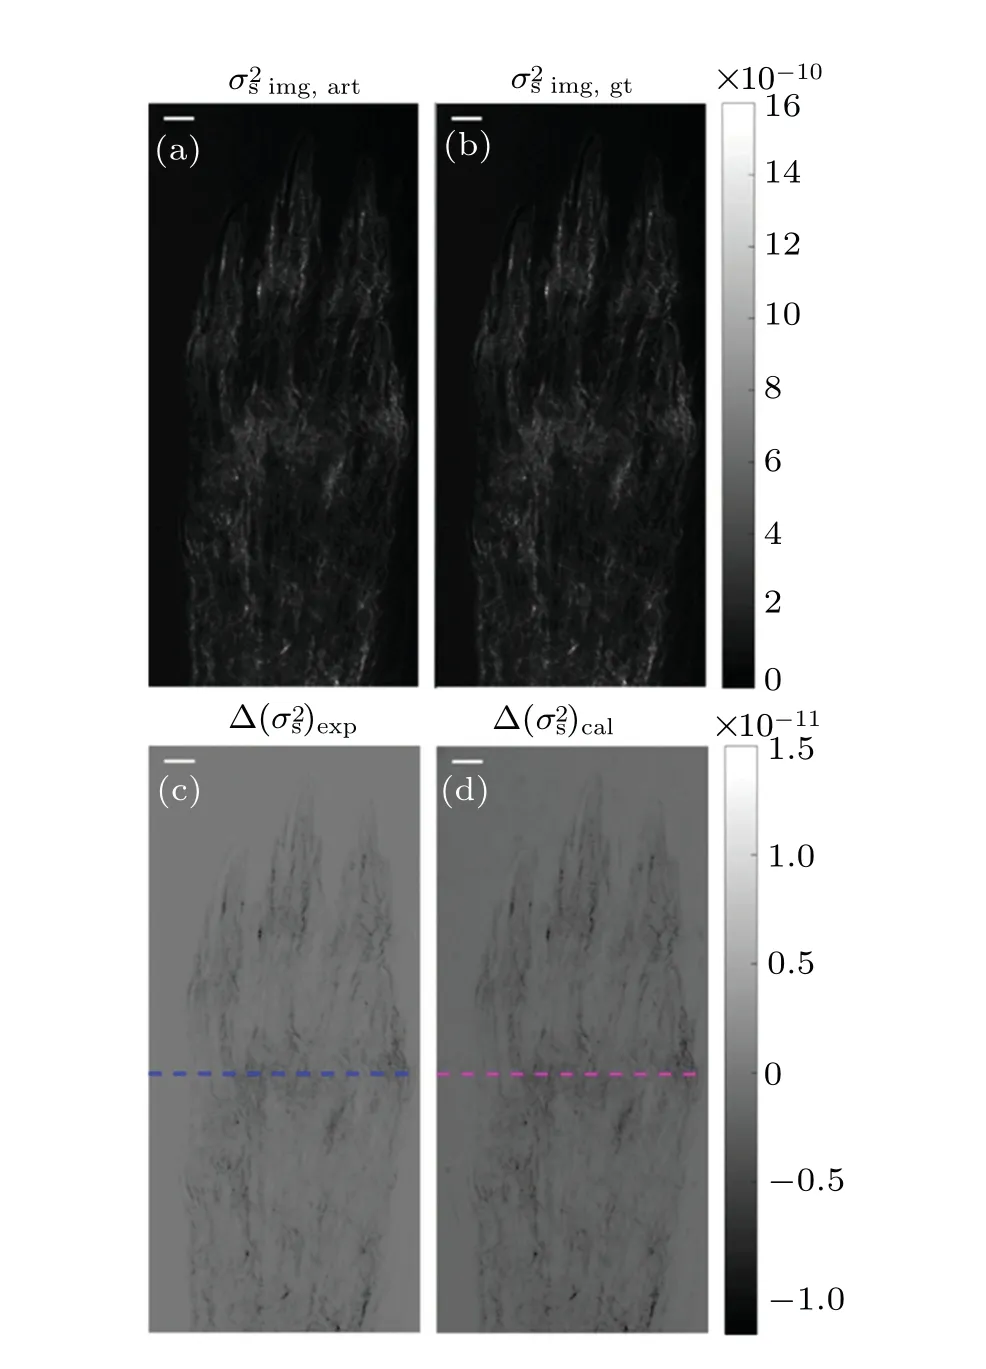
Fig.4.(a)Experimental scattering image with artefact.(b)Experimental scattering image without artefact.(c) Experimental artefact image.(d)Calculated artefact image.Scale bar is 0.45 mm.

Fig.5.Line profile comparison of scattering image artefact along the dotted line in Figs.4(c)and 4(d).
Finally, due to stochastic nature of analyzer angular position deviations, several other sets of deviations are also investigated,and the corresponding line profile comparisons are performed.The analyzer angular position deviations used for evaluations are listed in Table 1.Note that those deviations correspond to a misalignment of less than 10%of analyzer angular intervals during intensity measurements.The calculated correlation coefficients are listed in Table 2 for refraction and scattering images,respectively.
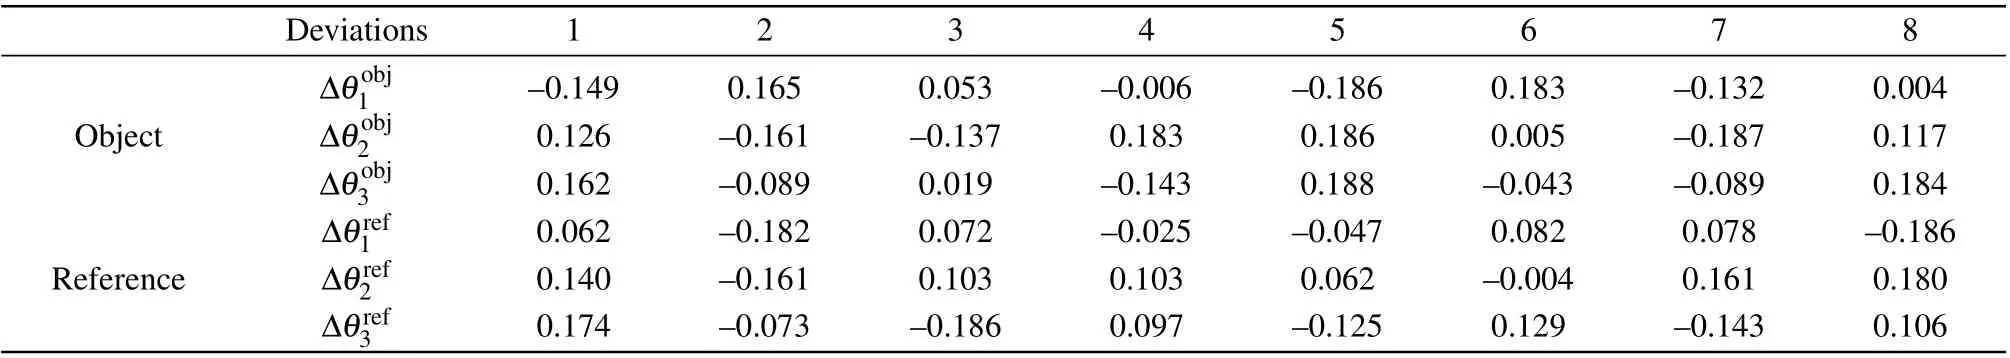
Table 1.Several other sets of deviations in units ofμrad used for evaluations.

Table 2.Calculated correlation coefficients between experimental and calculated artefacts.
As summarized in Table 2,the calculated correlation coefficient has a mean value of 0.9874 with a standard deviation of 0.0071 for the refraction image artefact, and a mean value of 0.9921 with a standard deviation of 0.0074 for the scattering image artefact, respectively.Those results again confirm the good agreement between experimental results and theoretical calculations,thus validating our theoretical analysis results,i.e.,Eqs.(8)and(13).
4.Discussion
Equation (8) revealed that the refraction image artefact is dependent on the three analyzer angular positions and their deviations, and also the sample’s refraction.However, it is expected that the three deviations contribute differently to the magnitude of image artefact.As shown in Eq.(8), the contribution is determined by the three defined coefficients.Figure 6(a) displays the coefficients of refraction image artefact as a function of the refraction signal.For the calculations,we have usedθ1=-13.6μrad,θ2=1.9μrad andθ3=15.5μrad from a recent literature.[31]These three analyzer angular positions are close to low-angle 48%, high-angle 98%, and highangle 31%,respectively.[31]The values of the coefficients have been normalized by the term (θ2-θ1)·(θ2-θ3)·(θ1-θ3).The results demonstrate that the magnitude of the coefficients can be comparable to that of refraction signal.Besides,the analyzer angular position deviations contribute quite differently for different features characterized by different refraction signals.And Eq.(8) can be used for predictions before experiments and experimental optimization.
Similarly, Eq.(13) showed that artefact of the scattering image is dependent on analyzer angular positions and their deviations, and both the sample’s refraction and scattering, but not on absorption.However, the three angular position deviations contribute differently to the artefact magnitude.Figures 6(b) and 6(c) show the three defined coefficients as a function of refraction and scattering, respectively.The same parameters as that of Fig.6(a) were used, and the coefficient values were also normalized.Different from Fig.6(a),a linear behavior is observed, with a smaller value.However, noting the difference in the magnitude of refraction and scattering,the magnitude of scattering artefact can also be comparable to that of scattering signal.Moreover, the contribution of analyzer angular position deviations is quite different for different refraction and scattering.Thus,Eq.(13)provides a simple tool for error estimations and experimental optimizations.
In experimental applications,especially for laboratory xray analyzer-based imaging instruments, deviations of analyzer angular positions can be easily induced by vibrations and other external influences.It is difficult to increase the stability of x-ray ABI setup sufficiently in experiments.And therefore, development of enhanced retrieval algorithms becomes quite necessary,which can effectively suppress the artefacts in the retrieved refraction and scattering images.On this sense,this work provides the foundation to develop advanced multicontrast retrieval algorithms.This will be one of our forthcoming work.
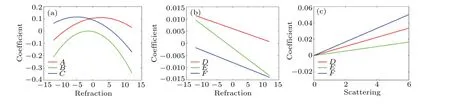
Fig.6.(a) Coefficient of refraction image artefact as a function of refraction.(b) Coefficient of scattering image artefact as a function of refraction.(c)Coefficient of scattering image artefact as a function of scattering.
5.Conclusion
In this work,we presented analysis of refraction and scattering image artefacts resulting from analyzer angular position deviations in x-ray analyzer-based imaging.A first-order Taylor series expansion is utilized to establish theoretical models to correlate deviations of analyzer angular positions with artefacts in the retrieved refraction and scattering images.Theoretical models were validated by synchrotron radiation experiments.The results revealed that for the refraction image,the artefact was independent of the object’s absorption and scattering signals.By contrast, artefacts of the scattering images were dependent on both the object’s refraction and scattering signals,but not on absorption signal.The derived dependency of image artefacts on deviations of analyzer angular positions could be used to develop advanced multi-contrast image retrieval algorithms that suppress image artefacts,and for correct image interpretation especially in laboratory x-ray analyzerbased imaging instruments.
Acknowledgements
Project supported by the National Natural Science Foundation of China (Grant Nos.U1532113, 11475170, and 11905041), the Fundamental Research Funds for the Central Universities (Grant No.PA2020GDKC0024), and Anhui Provincial Natural Science Foundation, China (Grant No.2208085MA18).

- Chinese Physics B的其它文章
- Matrix integrable fifth-order mKdV equations and their soliton solutions
- Comparison of differential evolution,particle swarm optimization,quantum-behaved particle swarm optimization,and quantum evolutionary algorithm for preparation of quantum states
- Explicit K-symplectic methods for nonseparable non-canonical Hamiltonian systems
- Molecular dynamics study of interactions between edge dislocation and irradiation-induced defects in Fe-10Ni-20Cr alloy
- Engineering topological state transfer in four-period Su-Schrieffer-Heeger chain
- Spontaneous emission of a moving atom in a waveguide of rectangular cross section