
Braking distance prediction for vehicle consist in low-speed on-sight operation: a Monte Carlo approach
2023-06-14 00:16RaphaelPfaff
Railway Engineering Science 2023年2期
Raphael Pfaff
Abstract The first and last mile of a railway journey,in both freight and transit applications,constitutes a high effort and is either non-productive(e.g.in the case of depot operations) or highly inefficient (e.g.in industrial railways).These parts are typically managed on-sight,i.e.with no signalling and train protection systems ensuring the freedom of movement.This is possible due to the rather short braking distances of individual vehicles and shunting consists.The present article analyses the braking behaviour of such shunting units.For this purpose,a dedicated model is developed.It is calibrated on published results of brake tests and validated against a high-definition model for lowspeed applications.Based on this model,multiple simulations are executed to obtain a Monte Carlo simulation of the resulting braking distances.Based on the distribution properties and established safety levels,the risk of exceeding certain braking distances is evaluated and maximum braking distances are derived.Together with certain parameters of the system,these can serve in the design and safety assessment of driver assistance systems and automation of these processes.
Keywords Freight rail ?Shunting ?Braking curves ?Brake set-up ?Driver assistance system ?Automatic train operation
1 Introduction
Given the worsening climate crisis,many nations,including Germany,are committed to a shift of freight from road to rail[1].To achieve this,it is necessary for freight rail to not only carry the mass goods as it was originally invented for but also offer a competitive service in low-density highvalue goods.
A rail freight service that is competitive requires cost to be comparable to road transportation but also a timely delivery [2].The first and last mile in rail freight is costly and exceptionally time-consuming due to numerous manual processes,starting from train formation [3] via technical inspection to brake test [4].To overcome this,frequently multi-modal solutions,substituting the first and last mile with lorry services and using rail freight only for the long haul,resulting in a multi-modal transport chain,are proposed [5] as well as automation of technical inspection and brake test [6].
A further challenge is given in the form of a high amount of labour required for operation on first and last mile.Frequently shunting units need to reverse several times in the siding,since the layout has been developing historically within confined space [7].Operation in such layouts requires either two persons or the use of a remote control and considerable walking times.
Many railways,especially in Europe,are confronted with a shortage in drivers and are thus investigating means to reduce personnel requirements.A viable option may be the addition of an advanced driver assistance system(ADAS) to the final wagon of the shunting group and potentially to the locomotive as proposed in[8].In order to strengthen single wagon load (SWL) traffic by implementation of assistance systems in an addition to the measures proposed in [9],this paper analyses the braking behaviour of shunting units on order to enable the appropriate design of such ADAS.
The braking behaviour is different from that of mainline railway operation in several aspects.First and foremost,regulations concerning the usage of brakes are far less strict with the aim of reducing brake pipe coupling and uncoupling effort for siding operation.Second,the velocities allowed in shunting are considerably lower,leading to different friction behaviour.Third,the brake test typically conducted before train operation is not required.
In addition to the braking behaviour,a notable difference between mainline and shunting operation lies in the fact that most if not all shunting operations are conducted on sight,i.e.that the driver observes the space ahead of the shunting unit and is responsible for its freedom of movement.
This paper is organised as follows: Sect.2 introduces the state of the art,particularly into the pneumatic and mechanic parts of the railway air brake system and shunting operation.Further the acceptable risk levels are derived from regulations.In Sect.3,the numerical model is developed and calibrated on published experimental braking distances.It is further validated against braking distance data stemming from a high-definition model.Section 4 applies the developed model to cases of railway braking in shunting operations,both in comparably low numbers of Monte Carlo runs and in high numbers aiming to determine the risk of exceeding a certain braking distance.Section 5 discusses the results in the light of development of driver assistance systems.
2 State of the art
The state of the art stems from operational aspects,in particular shunting operation as well as technical details of braking.The technical details include brake control as well as brake force generation,i.e.the friction brake.
Contrary to mainline operations,most of the braking process takes place during brake cylinder filling in addition to the low friction velocities present;therefore,a special emphasis is given to the friction behaviour.
2.1 Shunting operation
The efficient point-to-point transport of heavy bulk goods was the initial value proposition of rail freight,leading to its widespread use and growth.Later,rail freight grew into higher value,more individual products and systems for single wagon loads were added.The transport of single wagon loads was set up by help of a multi-stage process in order to maintain a high usage (i.e.long trains) on the mainline segment.
The segments of a rail freight journey between loading and unloading point and their respective closest marshaling yard are costly and time-consuming.Cost arises in the manual handling of the wagon settings,required inspections,manual coupling,line usage for transfer to the yard as well as personnel cost for shunting and regional collection.
The shunting units are mostly controlled on an on-sight basis,requiring that the freedom of movement is controlled by the driver or assistants where applicable.Besides some stop orders and switch positions,no signalling is present.For this purpose,shunting velocities are kept well below typical mainline velocities,with a maximum of 25 km/h typically prescribed across Europe [10,11].
Shunting processes are very labour intensive and tend to be prone to accidents.Due to the low velocities and train masses,many of these accidents may be considered minor.However,this paves the way for the development of advanced driver assistance systems (ADAS) and potential automation and autonomous operation as proposed by [8].
2.2 Railway air brake system
The railway air brake system according to[12]needs to be automatic,continuous and inexhaustible.To achieve these requirements,in the freight sector a pneumatic brake pipe(BP) is used in conjunction with a distributor valve,an auxiliary reservoir and the brake cylinder as main components.This pneumatic system is controlled from the locomotive by help of the driver’s brake valve which can increase or decrease the pressure in BP.
Details on the air brake system,specifically for numerical modelling,is provided in [13].
In the UIC or TSI setting,two filling times are standardised and controlled by the brake mode selection of the individual wagon,namely brake mode G (formerly goods)and brake mode P (formerly passengers).The filling timestfare measured from brake request to achieving 95%of the maximum brake cylinder pressure.The required values aretf=3-5 s in brake mode P andtf=18-30 s in brake mode G.
The brake cylinders are filled to a nominal cylinder pressurepcof 3.8 bar in case of an emergency brake application,with a tolerance ± 0.1 bar.
2.3 Braking force generation
The braking force resulting from the cylinder pressure is typically generated by help of a tread brake,acting on each wheel.The force is distributed from the single brake cylinder by a mechanical brake rigging,which in many cases also realises the load dependent brake (i.e.empty/loaded selector)[14].Since the wheel–rail adhesion is well utilised,with μ=0.12 for many cases,this ensures that sliding is prevented under most conditions.The mechanical rigging applies the brake blocks to the wheels,typically from both sides in order to balance forces.
2.4 Friction behaviour
The instantaneous friction coefficient of the brake blocks for low velocities plays a vital role in this analysis.In many cases in brakes design,average friction coefficients can be used;however,these are typically averaged from velocities of 80 km/h and above.Whereas in [15],instantaneous friction coefficients are required,the prescribed ranges typically exclude lower velocity ranges.For this reason,the empirical formula developed by Karwatzki [16] is used.Following Karwatzkis approach,the instantaneous friction coefficient is calculated according to
withFblockbeing the block force,vthe vehicle velocity and coefficientski(i=1,2,...,5) modelling the friction behaviour of different friction materials.In order to provide a simulation model for current and future applications,throughout this paper onlyKblocks are assumed.
Further work in the area of tread brakes focuses mostly on thermal and wear behaviour,and notable publications include Refs.[17–19] on temperatures as well as Ref.[20]for wear.Other studies focus on single ingredients of the brake block [21,22],or on the behaviour under different weather conditions [23].
2.5 Braking curves and braking distance distributions
While nowadays widely employed in design and analysis of train protection systems,the first consideration of the term braking curve known to the author is [24].The braking curve is a plot of the current velocityv(t′) of the vehicle or train under consideration over the distance covered up tot′,denoted as
Braking curves are helpful in analysing the braking behaviour with respect to a certain distance between distant signal and signal,as well as to the point of danger.Of particular interest in this context is the probabilistic nature of the braking behaviour,as the probability density of the braking distances is used in safety analyses of the train protection system [25,26].The safety of the system under consideration can be assessed by help of a probabilistic braking curve analysis.For this purpose,an analytical model of the braking performance,including the significant parameters for variations,is derived.The repeated simulation of this model yields a braking distance density and can be analysed for dangerous events such as signal passed at danger.
2.6 Required safety
Railway operations are considered safety critical [27];however,required safety levels vary largely between mainline and shunting operation as well as freight and passenger trains.The safety levels required for operation can be derived e.g.from those imposed on signalling systems,in a German context laid out in [28].This standard applies a risk score matrix to define the acceptable risks for certain accident classes.
The relevant accident classes according to [28]for lowspeed on-sight operation,mostly shunting,are the accident classes A and B:
? A:Examples include crash of shunting unit with buffer or object not leading to injuries.
? B: Examples include crash in shunting operations,derailment of shunting units leading to minor injuries.
The above accident classes are considered examples but may be considered representative for events encountered in railway shunting operation.Relatively low requirements are imposed on these risks,with no safety requirement or a hazard rate of 10-5h-1or less for classes A and B,respectively.
2.7 Brakes usage in shunting
While the GermanBremsvorschrift(Instructions for brake usage and operations) [10] allows a maximum of 40 unbraked wheelsets,this study assumes full usage of the brake pipe throughout the train.Not using the continuous air brake in shunting units leads to long braking distance beyond the range of feasible sensors for driver assistance systems.
3 Method
The braking curves are analysed in terms of a Monte Carlo simulation(MCS).MCS allows to obtain an estimate of the probability density of a system under random influences,as is the case for the friction processes taking place during braking.To obtain the MCS,repeated numerical simulations of the braking procedure under the influence of varying parameters are executed and the resulting braking distances are recorded.
The model used for the MCS is developed,calibrated and validated following this process:
1.Analytical modelling of the relevant aspects,e.g.filling times and friction behaviour.Since this study aims to modernise freight rail operation,Kblocks are assumed for the friction behaviour throughout all simulations.
2.Calibration of unknown parameters against standard braking distance measurements published in [29].These measurements were taken as slip tests fromv0=100 km/h using wagons equipped with P10 blocks.
3.Validation of the obtained model against low-velocity emergency brake applications fromv0=30 km/h published in [29].
Step 3 of this process indicates the validity of the approach to predict the velocities for lower velocities than usually the case;in particular,it shows that the Karwatzki formula yields an applicable description of the friction behaviour for these cases.
The simulations are executed in a time-step approach[14] with a time increment of 0.01 s.The code is implemented in Python and executed via Jupyter Notebook [30]or directly in Python 3.10 in a multiprocessing set-up to reduce computation time.
For the purpose of this study,only four-axle Eanos wagons are considered.
3.1 Wagon braking performance analysis
3.1.1 Vehicle behaviour
The vehicle is modelled as a lumped mass with only one degree of freedom.The rotating masses are included in the model by help of a dynamic factor of 1.04 for the loaded wagon.
The ride resistance of the wagons is expressed by help of the Strahl equation,providing a resistance force of
wheremtrainis the train mass,gthe gravitational constant andvthe current velocity of the train [16].
3.1.2 Driver’s brake valve and brake pipe
Since only the emergency brake functionality is analysed in this study,the model of the driver’s brake valve is a step drop from the release pressure of 5.0 bar to 0 bar without considering a venting time constant.This is faster than prescribed in Ref.[31];however,the shunting groups are shorter,and thus,the brake pipe volume is lower.
With respect to the shorter shunting units considered in this study,the brake pipe behaviour is approximated by increasing the filling time for wagoniin the group by
with the propagation velocityc=250 m/s as required by[32]andlithe length of thei-th wagon.No further dynamic behaviour of the brake pipe,e.g.the low pass filtering approximation of the couplings as proposed in [33],is considered due to the low number of couplings.Since the propagation velocitycis the minimum required velocity,no random variation is analysed.
3.1.3 Distributor valve
The distributor valve provides the brake cylinder pressurepcin brake modes P and G,respectively.The filling time behaviour of the brake cylinder pressure in brake mode P is a linear increase from 0 bar to the maximum brake cylinder pressurepc,max=3.8 bar over the filling time
In brake modeG,an initial brake application with a low force is implemented in the distributor valve;for this reason,the brake cylinder pressure is expressed as
withp0=0.1pc,max.The filling time is assumed to be vary equally distributed with the tolerances specified for the MCS.
The maximum brake cylinder pressure has a nominal value ofpc,max=3.8 bar which for the random study is assumed to vary within ±0.1 bar around this value.The variation is modelled as a normal distribution withbar,yielding a 99.7% probability of the actual value within this interval.
3.1.4 Brake cylinder and rigging
The brake cylinder diameter considered isdC=406 mm as a de facto standard for four-axle wagons.Within the cylinder,a return spring is exerting a counter force ofFR=1.5 kN.The force is then transmitted via the brake rigging to the brake blocks [14].
The mechanical transmission has a nominal efficiency of η=0.83 [14],which is assumed to vary within ±5%around this mean [26].
3.1.5 Friction behaviour of brake blocks
Since the purpose of the model is the simulation of lowspeed braking processes,the typically used mean friction levels of brake pads or blocks are not appropriate,since the averaging takes place over a far larger velocity range.For brake blocks in freight wagons,the velocity range applied in dynamic testing is 0–100 km/h or 0–120 km/h [14].As discussed above,this study uses the Karwatzki approach to model the instantaneous friction coefficient.
The friction behaviour of brake materials is among the most varying parameters in a brake system,as it is influenced by ageing,weather and even prior use.This is modelled by increasing or decreasing the instantaneous brake block friction coefficient by multiplication of the instantaneous friction value acc.to Karwatzki formula with a normally distributed factor having a mean of 1 and a standard deviation of 0.025 as proposed in [27].
3.1.6 Wheel–rail interaction
The wheel-rail contact of a rail vehicle may,in the case of wheel slip,significantly increase the stopping distance.The wheel-rail utilisation during shunting braking was analysed in [34].The study was adapted to the case analysed in this work;adhesion utilisation curves are shown in Fig.1.From this figure,the adhesion values below 0.15 always and below 0.12 most of the time indicate that the required adhesion level is available under most conditions.

Fig.1 Adhesion utilisation over braking distance for wagons,adapted from [34]
3.2 Locomotive brake system analysis
The DB class 363 shunter is assumed as the locomotive for the MCS.It has a service mass of 53 t and a braked weight of 56 t in brake mode P as well as 33 t in brake mode G.This yields a braked weight percentage λLoco=105% in P mode.
In[34],an analysis of the braking performance yielding
is presented,which indicates a braking forceFbr,Loco=45.8 kN.
Since no data on the brake block pressure are available,this braking force is assumed to be constant.Since the brake assessment was executed from an initial velocity of 60 km/h,which is close to the target velocity for this study,the variations in instantaneous braking force are not expected to be as dominant as for the wagon subsystem.Due to the comparably low influence of the locomotive and no known parameters,no random variations are assumed.
3.3 Model calibration and validation
3.3.1 Model calibration
Calibration was possible against braking distance data published in[29].These data were collected in slip tests as prescribed in [14] using four-axle Eanos wagons in both empty and loaded setting.The vehicle data were obtained from [35]for length and mass while the brake system data were taken from [14].For the empty simulation,the rotating mass factor was increased to 1.15 as given in[16].
Table 1 shows the calibration results.In order to tune the model,the brake rigging transmission ratio was adapted from the values given in [14] in order to meet the experimental braking distances.The braking distances are met well,with a slight overestimation leading to a conservative margin.
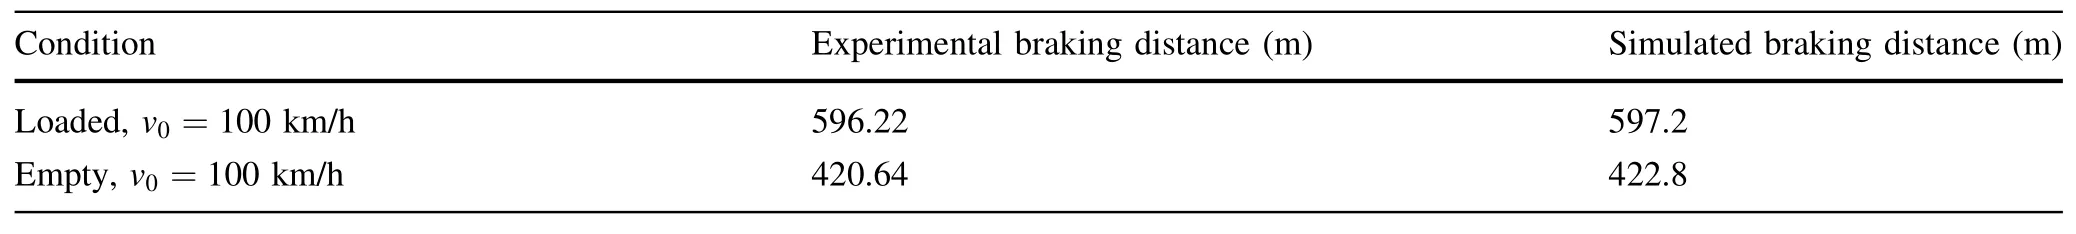
Table 1 Calibration results compared to [29]
3.3.2 Model validation
The model developed in [14] also provides braking distances for emergency braking of trains in different brake modes.These values are derived from the model developed in the article.No details on the model set-up as well as the leading vehicle are given.
The model developed for this study is validated by replicating the emergency brake simulations published in[29].The results are given in Table 2.

Table 2 Braking distance validation
For the purpose of validation,the results from [29] are considered true while the results generated by the method used for this study are labelled val.Thus,in Table 2,mtrueandmvaldenote true and validation masses andstrue,P10andstrue,LLdenote the true braking distances assuming P10 andLL blocks,respectively,whilesvaldenotes the data to be validated.Since it is not sensible to model partly loaded wagons,the train masses considered as true values were approximated by full 90 t-wagons.Only Eanos wagons and the respective results were considered.
In [29],P10 cast iron and low friction composite LL blocks were modelled.It is important to note that this study assumes high friction composite block,so-called K blocks.The initial velocity for all experiments wasv0=30km/h.
The cases described are as follows:
? Case 1,brake mode P:all vehicles’brake mode set to P.
? Case 2,brake mode GP: all wagons’ brake set to P,locomotive in brake mode G.
? Case 3,brake mode LL: locomotive and first 4 wagons set to brake mode G,rest of train in brake mode G.
? Case 4,brake mode G: all vehicles’ brake mode set to G.
The emergency braking distance from low velocity in brake modes P and G is well met by the method developed in this article.
4 Results
4.1 Study of braking distance distributions using Monte Carlo simulations
The braking distance distribution is analysed for shunting groups in certain arrangements.The arrangements are distinguished by help of the number wagons,the brake mode and the initial velocity.
In shunting operation,it is not strictly necessary to perform a brake test before departure of the shunting group.For this reason,even smaller groups may remain in brake mode G,e.g.in case they arrived at the yard as part of a train that had to be operated in brake mode G.
Since loaded wagons denote the worst case in terms of braking performance,only loaded wagons with massm=90 t are assumed.For all cases,104Monte Carlo simulation (MCS) runs are performed.
It is important to note that the vehicles are assumed to be in a nominal working condition,i.e.that no failure modes are included in the simulation.Further,the initial velocities are assumed to be met without tolerance,which may not be the case for real world brake tests.Further,all simulations employKblocks as friction material.
4.1.1 Brake mode P,5 wagons
The case of brake mode P with 5 wagons constitutes a frequent case in shunting.The filling time was adapted to this case by setting the mean filling time to 4 s and the standard deviation to 0.33 s.The initial velocity of 25 km/h leads to a mean braking distance of 38.3 m,a standard deviation of 0.48 m as well as a longest attained braking distance of 40.13 m.The distribution is shown in Fig.2.
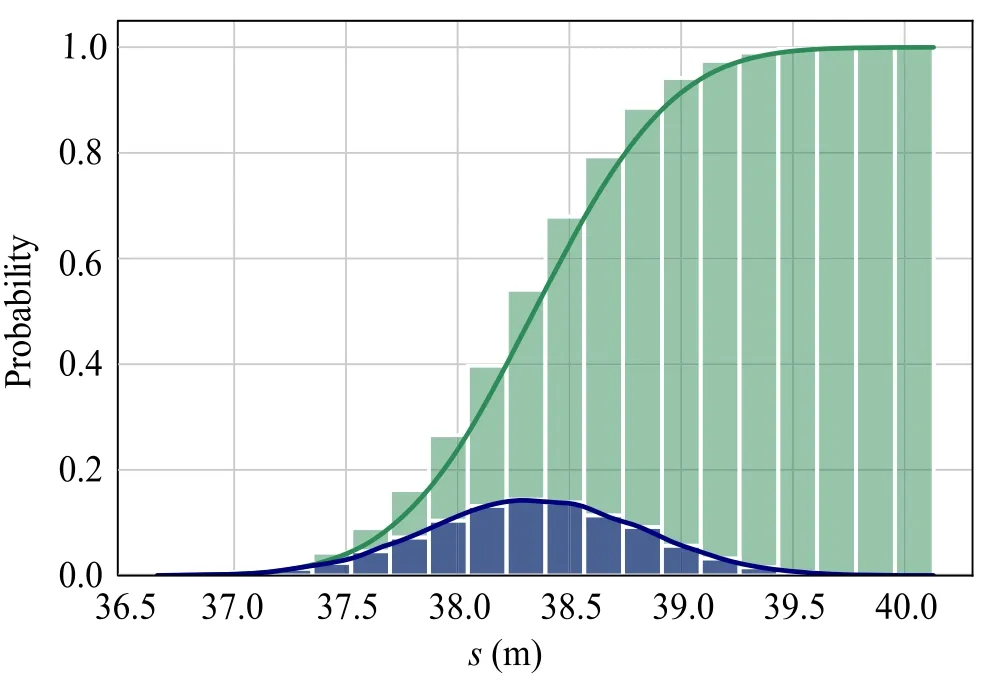
Fig.2 Histogram (blue) and cumulated frequency (green) for 5 wagons in brake mode P
4.1.2 Brake mode G,5 wagons
For brake mode G,the filling time is assumed as a normal distribution with a mean of 24 s and a standard deviation of 2 s.This places 99.7% of the realisations within the tolerance for the distributor valve.
From an initial velocity of 25 km/h,the mean braking distance is 64.21 m,with a maximum braking distance of 67.22 m attained in this simulation.
The plot in Fig.3 as well as the relatively low standard deviation of the braking distance distribution of 0.82 m shows that despite the large variation in filling times,these converge to a centralised distribution.

Fig.3 Histogram (blue) and cumulated frequency (green) for 5 wagons in brake mode G

Fig.4 Histogram (blue) and cumulated frequency (green) for 20 wagons in brake mode G
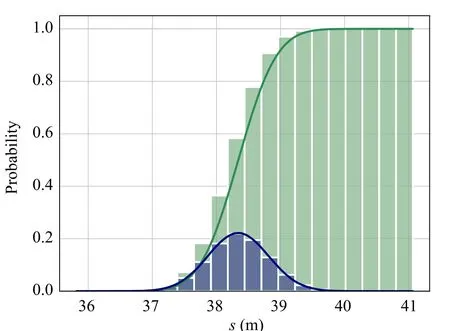
Fig.5 Braking distance distribution for shunting group(DB class 363 with 5 wagons) in brake mode P
4.1.3 Brake mode G,20 wagons
In brake mode G,it is possible to safely operate longer and heavier trains.For this purpose,a shunting group ofN=20 wagons was simulated.The initial velocity of 25 km/h was kept constant compared to the previous simulations.
The mean braking distance increased to 71.3 m while the standard deviation is reduced to 0.54 m.This is due to the higher number of random parameters taken into account,yielding an even higher concentration of the braking distances around the mean.The highest observed braking distance is 73.7 m.Figure 4 shows the respective distributions.
4.2 Risk analysis for development of ADAS systems
4.2.1 Brake mode P,5 wagons
The case of a small wagon group consisting ofN=5 wagons in addition to the shunting locomotive as analysed above was simulatedM=107times.With respect to the safety targets,M≥100pis satisfied and the observed frequencies of the braking distance distribution may serve as an indicator for the associated risk.
Figure 5 shows the histogram as well as the cumulated frequencies of the individual braking distance.It is obvious from this figure that braking distances of more than 40 m are rare,which is supported by the relative frequencies shown in Table 3.

Table 3 Relative frequencies(p)of braking distances d exceeding a distance of s for brake mode P
The results shown in Table 3 indicate that an emergency braking distance of 41 m is exceeded with a probability of less than 10-5.This result is supported by noting that the 100 longest simulated braking distances are in the interval[40.35,41.06]m.
Taking into account that emergency stops occur less than hourly,this satisfies the requirement ofp<10-5h-1as given above.For this reason,it is possible to configure sensor arrays and processing units such that obstacles are detected within a range.
wheretpandtRdenote processing time of the ADAS and reaction time of the driver,respectively.
This may be compared to the analytical result provided by[14],which allows to determine an average deceleration of
which,for a typical loaded wagon with λ=65% and an equivalent unbraked time oftf/2,relates to a braking distance of 56.7 m.
4.2.2 Brake mode G,5 wagons
Similar to the simulation in the case of brake mode P,a short shunting unit in brake G was simulated.The number of MCS runs was set toM=107and the simulation time step was increased to 0.2 s due to the longer braking time.The result is a mean braking distance of 58.97 m with a standard deviation of 0.67 m,similar to the case reported in Sect.4.1.3.
Figure 6 shows histogram and cumulated density plots of the resulting distribution.It is interesting to note that the three local increases in relative frequency are also visible in this plot.These were already slightly visible in Fig.6.
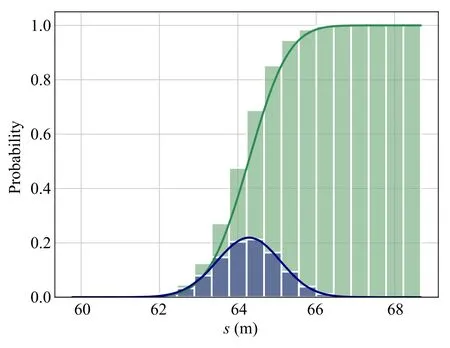
Fig.6 Braking distance distribution for shunting group(DB class 363 with 5 wagons) in brake mode G
The associated risks for a brake distance above a threshold distancesare shown in Table 4.The risk falls below the required level of 10-5h-1for braking distances of 67.6 m.This result constitutes an improvement over the analytical result of 126.1 m which is provided by the calculation given in [14].

Table 4 Relative frequencies(p)of braking distances d exceeding a distance of s for brake mode P
4.3 Summary of results
The individual cases can be summarised as given in Table 5.

Table 5 Summary of simulation results
The braking distances are shorter thanks to the appropriate modelling of the braking behaviour in the low-velocity range using the Karwatzki formula for instantaneous friction coefficient.
5 Discussion and conclusions
The method for low-velocity braking distance calculation is different from previous approaches in that it aims to express the instantaneous friction coefficient as well as the nonlinear behaviour of the distributor valve more closely,focussing on low-speed braking processes.These processes are chosen since in executing them in an assisted or automated fashion lies considerable potential for improvement of the cost and performance of the freight rail system.
The model was calibrated using published results of brake tests and validated against unseen data of low-speed emergency brake applications obtained from a well-tuned parameter-rich model [29].
The random parameters were obtained from previous studies aiming on mainline braking curves [26].They may be too narrow for the purpose,in which case a repeated number of emergency brake measurements in shunting will be helpful.However,these would require a large body of different wagons with respect to age,friction pairing as well as pneumatic system,which appears to be unpractical to perform.
The results may be used in the design and development of driver assistance systems as well as systems for automatic shunting.While it is a simplified model,the parameters are physically meaningful,and thus,it may be adapted to different use cases.An extension of the validityto e.g.disc braked vehicles is possible by using the appropriate parameters in the Karwatzki equation as well as vehicle data followed by a calibration on recorded braking distances.
When processing and,in the case of a driver being assisted,a reaction is known or can be estimated,a safe distance for the sensor design and validation can be calculated.It is also possible for given sensors to derive a maximum safe velocity.
The resulting sensor requirements are less demanding than the analytical approach laid out in [14],which can be explained by the higher instantaneous friction coefficients during low velocities.
This study is limited in that it does not include the adhesion conditions in the simulation.In mainline train protection systems,the fact that adhesion levels influence braking distances is expressed by a correction factor.A similar approach may be viable to overcome this.
Since the low-velocity braking distances used to validate the model are obtained from a parameter-rich model instead of measured braking distance,the approach could be improved by measurements of such braking distances.This may also help to further investigate the validity of the Karwatzki formula for low-velocity applications.
Further work in this area will be focussing on the extension of the model validity to disc brake vehicles as well as the implementation of Importance Simulation in order to reduce processing time,thus enabling the software to estimate braking distance distributions for arbitrary consists at set-up of the shunting group.
AcknowledgementsAn initial study inspiring the published results was conducted in collaboration with Katharina Babilon and Matthias Blumenschein,both FH Aachen.Their support is gratefully acknowledged.The author thanks the reviewers for their comments leading to a substantial improvement of the paper.The author further acknowledges funding of the SAMIRA project by the European Regional Development Fund under grant number 0801689.
Open AccessThis article is licensed under a Creative Commons Attribution 4.0 International License,which permits use,sharing,adaptation,distribution and reproduction in any medium or format,as long as you give appropriate credit to the original author(s) and the source,provide a link to the Creative Commons licence,and indicate if changes were made.The images or other third party material in this article are included in the article’s Creative Commons licence,unless indicated otherwise in a credit line to the material.If material is not included in the article’s Creative Commons licence and your intended use is not permitted by statutory regulation or exceeds the permitted use,you will need to obtain permission directly from the copyright holder.To view a copy of this licence,visit http://creativecommons.org/licenses/by/4.0/.
Data and material availabilityThe generated data can be found following the links in the project repository https://github.com/RailProfAC/ShuntingBrakingCurves.
Code availabilityThe generated code can be found in the project repository https://github.com/RailProfAC/ShuntingBrakingCurves
 Railway Engineering Science2023年2期
- Railway Engineering Science的其它文章
- HIL testing of wheel slide protection systems: criteria for continuous updating and validation
- An approach for simulating the air brake system of long freight trains based on fluid dynamics
- A simplified pneumatic model for air brake of passenger trains
- Influence of quick release valve on braking performance and coupler force of heavy haul train
- A numerical method for the simulation of freight train emergency braking operations based on the UIC braked weight percentage
- The effect of controllable train-tail devices on the longitudinal impulse of the combined trains under initial braking