
A fault recognition method based on clustering linear regression①
2023-12-15 10:43CHENLeiSHIJiaqiZHANGTing
High Technology Letters 2023年4期
CHEN Lei(陳 雷), SHI Jiaqi, ZHANG Ting
(?Computer School, Beijing Information Science and Technology University, Beijing 100101, P.R.China)
(??Faculty of Information Technology, Beijing University of Technology, Beijing 100124, P.R.China)
Abstract
Key words: fault recognition, clustering, linear regression, curve fitting, seismic interpretation
0 Introduction
Fault recognition is an important section in seismic interpretation.The traditional method is to select the discontinuous sampling points in the seismic section manually, and then connect these points into curves.The manual method can accurately identify faults, but it is time-consuming and subjective.To overcome the shortcomings of the manual method, various fault recognition methods have been proposed successively since the early 20th century.Generally, these methods use the discontinuities such as correlation coefficient,gradient or variance between the seismic samples of different seismic traces in seismic data to detect faults.
The classical coherence cube algorithm has developed from the first generation coherence cube algorithm(C1) to the third generation coherence cube algorithm(C3).It is the earliest automatic fault identification method.Bahorich et al.[1]proposed C1, in which,fault was extracted by the correlation value between the neighboring three seismic traces based on the classic normalized cross correlation.Marfurt et al.[2]proposed second generation coherence cube algorithm (C2), in which, the number of seismic traces used in correlative computation was increased to multi-traces contained in a cuboid or a ellipsoid.Gersztenkrn and Marfurt[3]proposed C3, the eigenvalues of the covariance matrix of the seismic traces contained in analysis window were used for the computation of coherence attribute.These widely used coherence algorithms have their own advantages and disadvantages.Experiments have confirmed that C1 works faster, but it is sensitive to the interference of coherent noise, C2 is better in accuracy and noise resisting compared with C1, however, it requires more computing work, C3 is more efficient compared with C2, but the exact fault location can not be decided.Furthermore, mean effect is the common feature of C1 to C3 where lots of small faults are missed easily.
In addition to the coherence cube algorithm, the ant tracking algorithm is famous in the field of automatic fault identification, and it has been applied in seismic data interpretation software Petrol, which is developed by Schlumberger, the oilfield technology service company in the USA.Based on the ant colony optimization (ACO), ant tracking algorithm identifies faults by ants crawling on fault-like points in seismic data[4-7].The micro fault can be detected by this method.However, many fault-like points which should be judged as seismic horizon are mistaken as fault.In addition, this method has a high computational cost.
Besides coherence cube and ant tracking algorithm, other automatic fault identification methods have also been proposed.Refs.[8-9]proposed a fault recognition method based on Hough transformation and implemented it successively in two and three dimensional space.The discontinuities were computed by C2 and the likely fault regions were highlighted through threshold discontinuities, then, Hough transformation was utilized for fault recognition.This method can not work well when the number of the faults in a seismic section is greater than one.Wang et al.[10]proposed a fault recognition method based on directional complex-valued coherence attribute.The Hilbert transform of a real seismic trace was used as the corresponding complexvalue seismic trace, then the coherence value between the adjacent weighted complex-value seismic traces along multiple azimuths were calculated, and the point with the minimum value was judged as fault.The mean effect still exists and some horizontal information is left.Xiong et al.[11]extracted three small two-dimensional(2D) seismic section in the seismic data volume in three directions, horizontal, vertical and axial, respectively, as the three color components of color image RGB, and tried to identify faults with a five-layer convolutional neural network(CNN),but the reliability of the obtained faults was low due to low accuracy training samples.Dou et al.[12]presentedλ-binary cross-entropy (BCE) andλ-smooth L1 loss to train three-dimensional(3D) CNN by few slices from 3D seismic volume label, so that the huge workload the task of image segmentation requires can be reduced,and proposed an attention module that can be used for active supervision training and embedded in the network to suppress seismic noise, however, the accuracy of the fault detection results obtained is low, and some horizons are incorrectly identified as faults.Shafiq et al.[13]presented an approach for detecting faults within seismic volumes by using a saliency detection framework that employs a 3D fast Fourier transform(3D-FFT) local spectra and multi-dimensional plane projections.The complex fault networks which are hardly conspicuous within original seismic volume can be detected effectively by this method.But the accuracy of faults is difficult to guarantee, some shorter bending horizons are wrongly judged as faults, and the results are accompanied by a lot of noise.Mahadik et al.[14]used multispectral coherence to characterize faults.Through spectral decomposition, spectral balance and statistical fusion of coherence images, more refined and sharper faults can be obtained.However,the results are noisy, and the accuracy is still insufficient.In addition,there are many other methods,such as the fault identification method proposed by Yu et al.[15].
Generally, the overall trend of the fault is in the shape of a straight line or an approximate straight line.It is a very effective fault identification method to detect line segments from seismic coherent attribute images through Hough transform.However, when the seismic section image contains multiple faults, it is necessary to cluster the line segments first to obtain the correct fault number and identification results.In view of the linear relationship between the line segment endpoints of the same fault, it is an effective method to cluster the endpoints of the line segment using the clustering linear regression method in mathematical statistics.After the segment endpoints are correctly clustered, the least squares curve fitting method can be used to generate the fault based on each class of endpoints.
Based on the endpoints of line segments detected by Hough transform on the results of coherence cube algorithm and the clustering linear regression algorithm, a fault recognition method based on the adaptive clustering linear regression is proposed in this paper.Following, the paper first introduces the principle of clustering linear regression algorithm, and then the specific process of the fault recognition method based on adaptive clustering linear regression is given; finally, the proposed fault recognition method is verified and analyzed through experiments on model seismic data and actual seismic data.
1 Clustering linear regression algorithm
Clustering is the process of dividing a collection of physical or abstract objects into multiple classes composed of similar objects[16-17].Regression is a statistical analysis method to study the relationship between one set of random variables and another set of variables[18].Clustering and regression play an important role in pattern classification, data mining, production forecasting and other fields.In practical problems, many data can not only be divided into different categories, but also the regression functions corresponding to each category are different.If you want to design a classifier for such data, you need a method to obtain the regression function of each category as the discriminant function.This method is called clustering regression algorithm.In the cluster regression problem, clustering and regression are two interrelated processes.The data are clustered according to the distance from different regression functions, and the clustering results play a decisive role in determining the corresponding regression functions.When the two reach a balance, the cluster regression problem can be solved.Clustering linear regression refers to the case that all regression functions are linear functions, which is the most basic clustering regression problem.The purpose of clustering linear regression is to cluster data and find the optimal linear regression function for each type of data to minimize the regression error.The principle of clustering linear regression is described as follows.
Assume there areNsamples:A={(x1,y1),…,(xN,yN)}, wherein,xiis the independent variable andyiis the dependent variable, that is, the function value that varies depending onxi, andi=1,…,N.The linear model corresponding to various samples after cluster regression is shown in Eq.(1).
where,pis a positive integer, used to define different regression errors, and the value is usually 2.The purpose of clustering linear regression is to calculate the clustering numberkand regression coefficient (μ(j),β(j)),j=1,…,k, so as to minimize the sum of regression errors of all data.Thus, the objective function to be optimized for clustering linear regression problem is shown in Eq.(3).
The existing clustering linear regression algorithms solve the clustering linear regression problem by optimizing the objective function shown in Eq.(3).At present, two widely used solutions are the Spath algorithm[19]and the incremental algorithm[20].Spath algorithm gives a solution to the clustering linear regression problem under the assumption that the number of clusters is known.It is a classical algorithm to solve the clustering linear regression problem with known the number of clusters.The incremental algorithm also assumes that the number of clusters is known, but before reaching the known number of clusters, one cluster is added in each iteration, and then based on the clustering results obtained in the current iteration, a better initial solution is provided for the next iteration, which solves the optimization problem of the initial solution in each iteration when solving the clustering linear regression problem.
2 Fault recognition method based on clustering linear regression
The existing clustering linear regression algorithms usually assume that the number of categories of the given sample data is known, but in fact, the number of clusters is unknown.Shao and Wu[21]proposed a criterion for determining the optimal number of clusters,but it was not applied to the clustering linear regression algorithm.Based on this criterion and the incremental algorithm, this paper proposes an adaptive clustering linear regression algorithm that automatically determines the number of clusters, and applies it to fault recognition.
2.1 Adaptive clustering linear regression
The criterion proposed in Ref.[21] can determine the optimal number of clusters, but it can not guarantee the optimal clustering results, while the Spath algorithm can obtain the optimal clustering results when the number of clusters is given.Therefore,this paper organically combines the two, uses Spath algorithm to solve the clustering regression problem in the iterative process of incremental algorithm, and proposes an adaptive clustering linear regression algorithm.The specific steps of the proposed algorithm are as follows.
(1) Calculate the linear regression function of the entire given data setA,expressed with (μ(l),β(l)),and initialize the variablelas 1.
(2) Letl=l+1, assume (μ(j),β(j)),j=1,…,l-1, are the solutions of the (l-1)th clustering regression problem, calculate the solution set of thelth clustering regression problem, and locally optimize the initial solution.
(3) Assume each optimized initial solution is (u,v), letμ(l) =u,β(l) =v, (μ(l),β(l)) and (μ(j),β(j)),j=1,…,l-1, form a new initial solution set (μ(j),β(j)),j=1,…,l.Use the new initial solution set to cluster the original sample data, and use Spath algorithm to solve thelth clustering regression problem to get the solution set of it.The solution can be expressed as Eq.(4).
(4) Calculate the new linear regression problem of thelth clustering, and the calculation method is shown in Eq.(5).
(5) Determine whether it is the optimal cluster number according to the criteria proposed in Ref.[21].If so, stop iteration, or return to the second step to continue iteration.The criterion for determining the optimal number of clusters is shown in Eq.(6).
where, Пk=Ck1,…,Ckk=(μ1,β1),…, (μk,βk) is a possible clustering situation of the original sample data, andkis less thanM;q(k) is a strictly increasing function with respect tok; andWNis a constant sequence.The first term in the square brackets at the right end of the equation is the sum of residual squares, which is used to measure the fitting of regression functions.The second term is the penalty term for over fitting.For clustering case Пk, first fitkcluster regression functions to obtainkleast squares estimatesβ′kjand then calculate the best estimatek′ of the real cluster number.
Through the above steps, not only the best clustering number of sample data can be determined, but also the best linear regression function corresponding to each sample point (determined by regression coefficient) can be obtained, which means the best clustering of the sample set have been achieved, so that the clustering linear regression problem is solved.
2.2 Fault recognition
In this paper, the starting point and ending point of the line segment detected by Hough transform are taken as the key points, and a fault recognition method based on adaptive clustering linear regression is proposed.This section will introduce the overall process of fault identification and the least squares curve fitting fault generation method.
(1) Overall process
The flow chart of the proposed fault identification method is shown in Fig.1.

Fig.1 Diagram of the fault recognition method based on adaptive clustering linear regression
The implementation method of seismic data loading, coherence image acquisition, and Hough transform in Fig.1 is the same as that of the corresponding part of Hough transform based fault recognition method in Refs [8,9].The difference is that after the line segments of seismic section coherence image was detected using Hough transform, the fault recognition method proposed in this paper does not directly generate faults using the detected line segments.Instead, the two endpoints of each line segment are taken as the key points to determine the fault, then, the adaptive clustering linear regression algorithm proposed in this paper is used to cluster the key points.Finally, the fault is generated based on the clustered key points, and the method of fault generation is based on the least square curve fitting method.The proposed fault recognition method based on adaptive clustering linear regression omits the process of error features deleting in the method in Refs [8,9], and effectively reduces the amount of calculation.In addition,the clustering linear regression algorithm can adaptively cluster the key points according to their linear relationship, which can ensure the accuracy of identifying multiple faults in the seismic section and provide an effective solution for fault intelligent identification technology.
(2) Least squares curve fitting
After the key points are clustered by the adaptive clustering linear regression algorithm, a fault can be determined based on the key points of the same category.The fault may be close to a straight line or an irregular curve.In order to improve the accuracy of fault identification further, a fault generation method based on least squares curve fitting is proposed in this paper,which uses the quadratic least squares curve fitting method to fit the key points of the same class, and the fitted curve is regarded as the fault.
The least square fitting is to find the coefficients of the fitting polynomial function according to the known data, so as to minimize the square sum of the error between the fitting function value and the original discrete point[22-24].Because this fitting method can minimize the sum of squares of errors, it is also called the best fitting.The principle is as follows.
Suppose there areNpoints, the independent variables in these points arex1,x2,…,xN,and the corresponding function values arey1,y2,…,yN.The purpose of the least squares fitting is to find a polynomial function that minimizes the sum of squares of the error between the value of the function on the independent variablex1,x2,…,xNand the real function valuey1,y2,…,yN.Assuming that the data is fitted with ak-degree polynomial function, the fitting polynomial function is shown in Eq.(7).
The square sum of the error between the fitting polynomial function value and the original function value is given in Eq.(8).
where,y′irepresents the function value of the fitting polynomial function at theith independent variablexi.The purpose of least-squares fitting is to find the best set of coefficientsa0,a1,…,akto minimize the sum of squares of errorsδ2.The solution of the best fitting polynomial functiony′ is shown in Eq.(9).
Calculate the partial derivative ofai(i=1,2,…,k) and simplify the items on the right of Eq.(8) in order to obtain the conditions that the best set of coefficients must meet, as shown in Eq.(10).
Assuming that the first matrix on the left side of Eq.(10) is represented byx,A=[a0,a1,…,ak]T,Y=[y0,y1,…,yk]T, the simplified expression of the conditions that the best set of coefficients must meet is shown in Eq.(11).
The calculation method of the best set of fitting polynomial coefficients can be obtained from Eq.(11)as shown in Eq.(12).
From Eq.(12), the best coefficientsai(i=1,2,…,k) can be obtained, thus the analytical expression of thekth best fit polynomial function can be obtained,and then the best fit polynomial function valuey′i(i=1,2,…,N) can be calculated.In other words, from Eq.(12),the analytical expression of the curve fitting by least squares for the same category of key points can be obtained,and the curve is the fault to be identified.
3 Experiments and analysis
To verify the effectiveness of the proposed adaptive clustering linear regression algorithm, this paper first uses the proposed adaptive clustering linear regression algorithm to experiment on the model data, and then compares the fault recognition method based on adaptive clustering linear regression with other fault recognition methods on actual seismic data.The experimental actual seismic data is 200 frames of seismic section data provided by PetroChina from a work area in western China (100 frames of seismic section data for multiple uncrossed faults and 100 frames of seismic section data for multiple crossed faults), of which the size of seismic section data containing multiple crossed faults is 301 ×101 sample points, and the size of seismic section data with multiple uncrossed faults is 301×301 samples.Experimental tool is Matlab 2015a.
3.1 Experiments on model data
A clustering linear regression experiment was carried out on two types of model data to verify the effectiveness of the proposed adaptive clustering linear regression algorithm.One type is 63 data points with normal distribution near three disjoint lines, and the other type is 63 data points with normal distribution near three intersecting lines.The original model data before clustering and the model data clustered by adaptive clustering linear regression algorithm are shown in Fig.2 and Fig.3, respectively.
Among them, points with the same identifier in Fig.3 indicate that after clustering regression, these points belong to the same linear regression function,that is, they belong to the same class, while points with different identifiers indicate that they belong to different classes.
It can be seen from Fig.2 and Fig.3 that the proposed adaptive clustering linear regression algorithm can not only accurately determine the number of clusters of sample points, but also correctly cluster sample points that meet different linear relationships, thus its effectiveness in model data is verified.
3.2 Comparison experiment on actual seismic data
To verify the effectiveness of the proposed fault recognition method based on adaptive clustering linear regression, it is experimentally compared with the traditional method on two kinds of actual seismic section data with multiple uncrossed faults and multiple crossed faults.The comparison of fault recognition results obtained from two data of different methods is shown in Fig.4 and Fig.5.
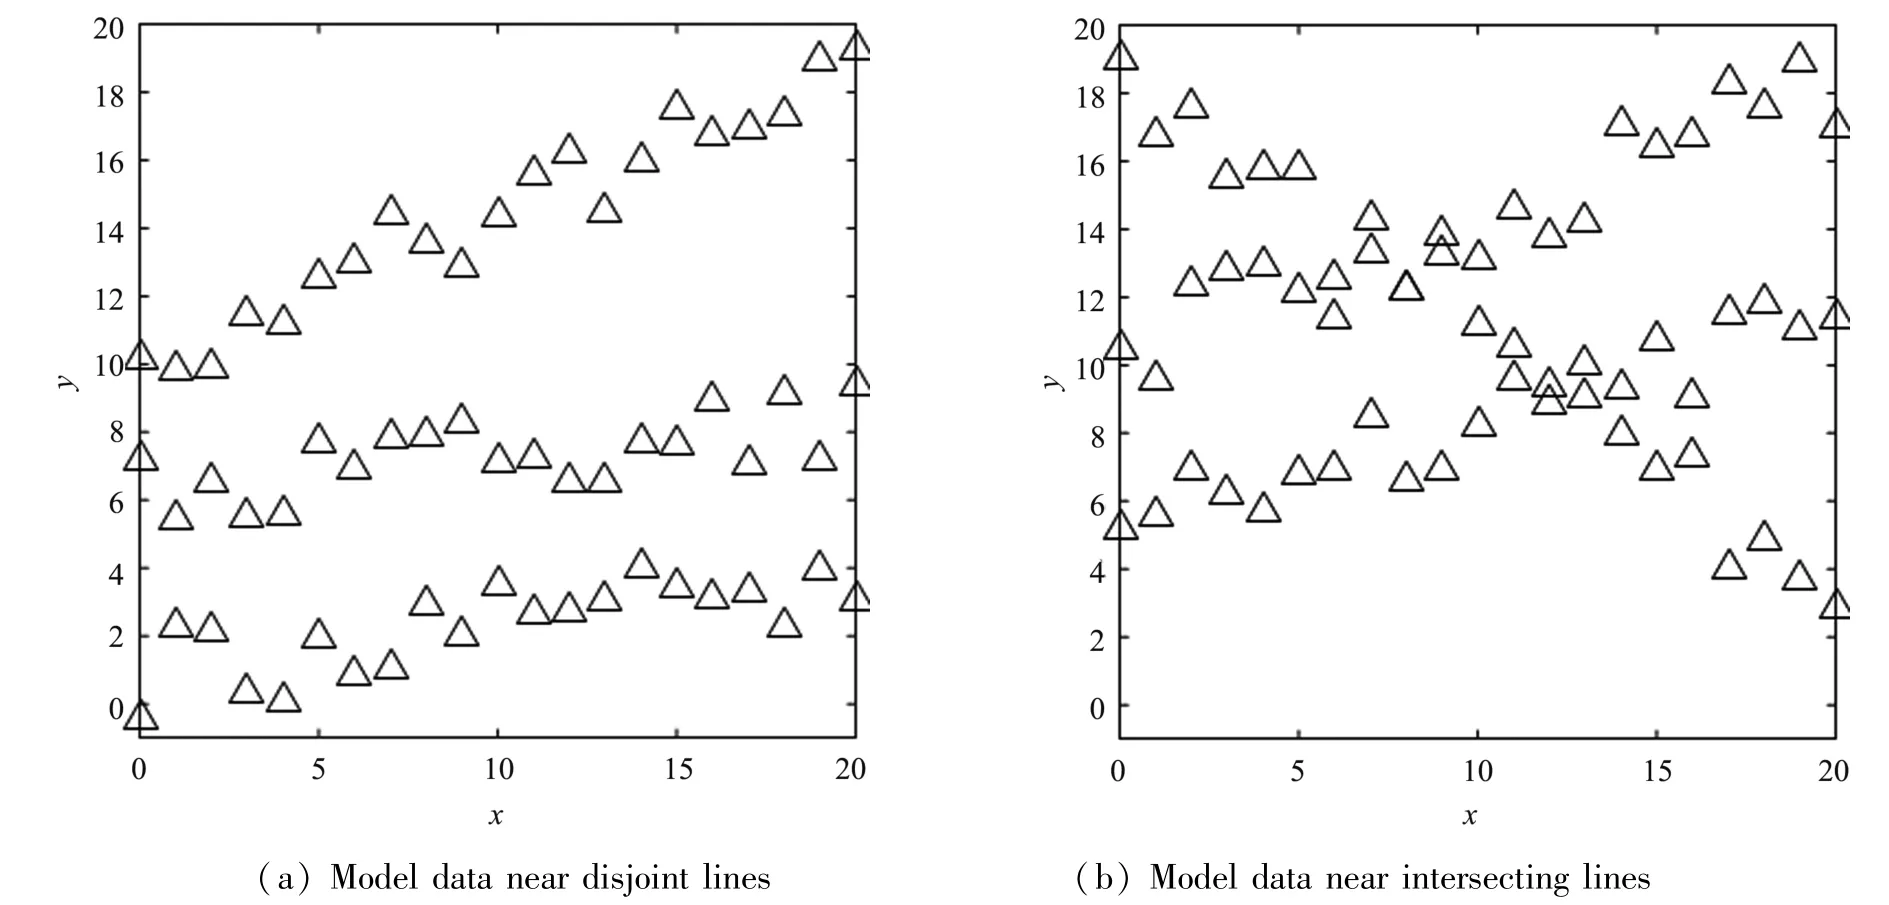
Fig.2 Model data of the adaptive clustering linear regression experiment

Fig.3 Cluster results of the model data
From Fig.4 and Fig.5, it can be seen that the fault identified by manual method is more accurate,the fault identified by C3 algorithm is more noisy, and it is difficult to accurately identify the fault location.The method in Refs [8,9] cannot accurately identify multiple faults in the seismic section because it does not cluster the line segments detected by Hough transform.The fault recognition method based on adaptive clustering linear regression proposed in this paper can correctly identify multiple non-intersecting faults and multiple intersecting faults in seismic sections.Besides the recognition results, the objective performance of the fault recognition algorithm is also analyzed and compared.The time consumption and average time consumption of each method on each frame of seismic section under different conditions are shown in Fig.6 and Table 1, respectively.
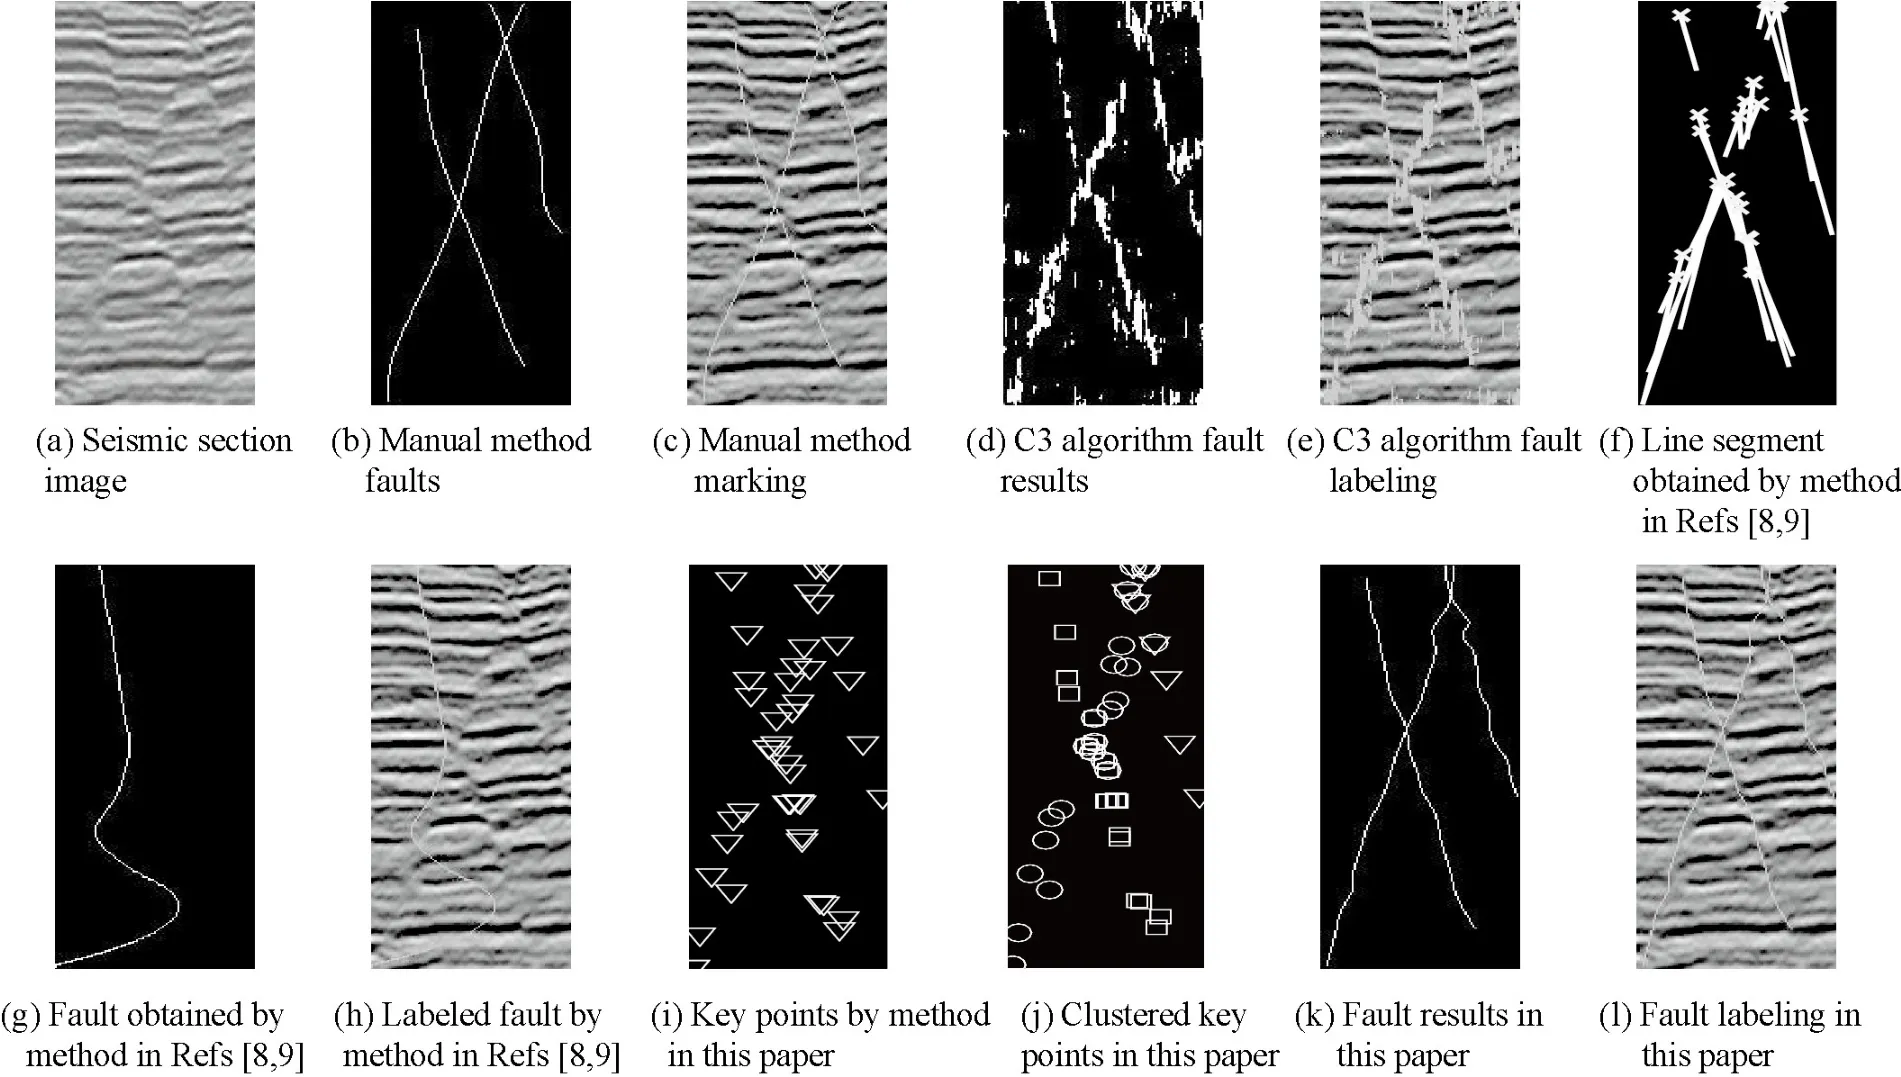
Fig.5 The case when there are multi crossed faults contained in the seismic section image

Fig.6 Comparison of time consumption by different methods in different situations
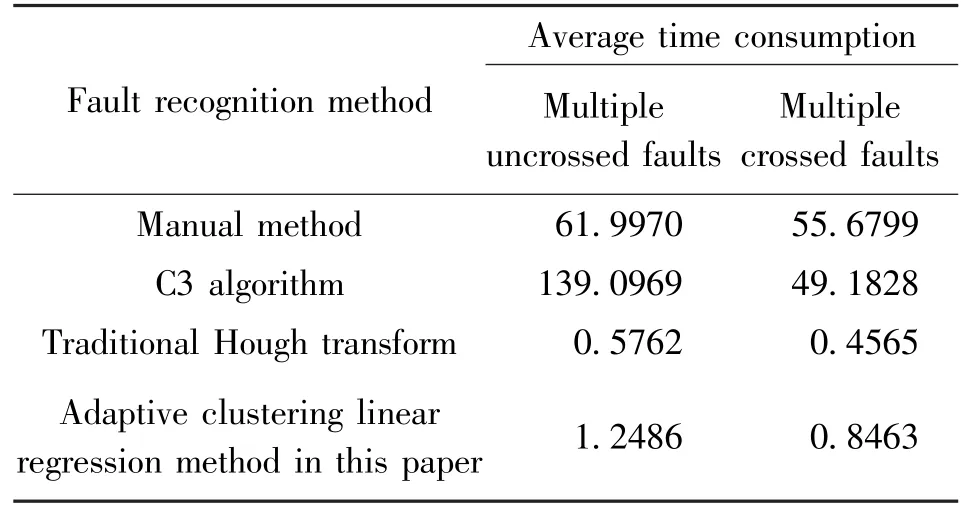
Table 1 Comparison of average time consumption in fault recognition
From the data in Fig.6 and Table 1, it can be seen that the method in Refs [8,9] has the least time consumption, and the fault recognition method based on adaptive clustering linear regression proposed in this paper has a slightly longer time consumption.The reason is that the method in this paper consumes a certain amount of time to cluster the key points (the endpoints of the line segment detected by Hough transform), but the extra time is less than 1 s.This is because the method in Refs [8,9] needs to delete the error feature, and the error feature deletion needs to calculate the absolute distance and horizontal distance between each line segment.These calculations will consume a certain amount of time, but the method proposed in this paper does not require error feature deletion.The C3 algorithm consumes the most time because it needs a lot of cross-correlation calculations.For the manual method, its time consumption is affected by both subjective factors and the number of fault in the seismic section and the complexity of fault structure, which has a large fluctuation.
In order to verify the correctness of the proposed fault recognition method based on adaptive clustering linear regression, this section separately counts the number of faults identified by the proposed method and the manual method on each frame of seismic section when the seismic section contains multiple uncrossed faults and multiple crossed faults, the change curve of the number of faults in various cases is shown in Fig.7(the C3 algorithm is not included in the comparison of the number of faults due to the C3 algorithm can not get the number of faults in the seismic section).The total number of faults identified by the manual method,the traditional Hough transform method in Refs[8,9]and the method in this paper are given in Table 2 when there are multiple uncrossed and multiple crossed faults.
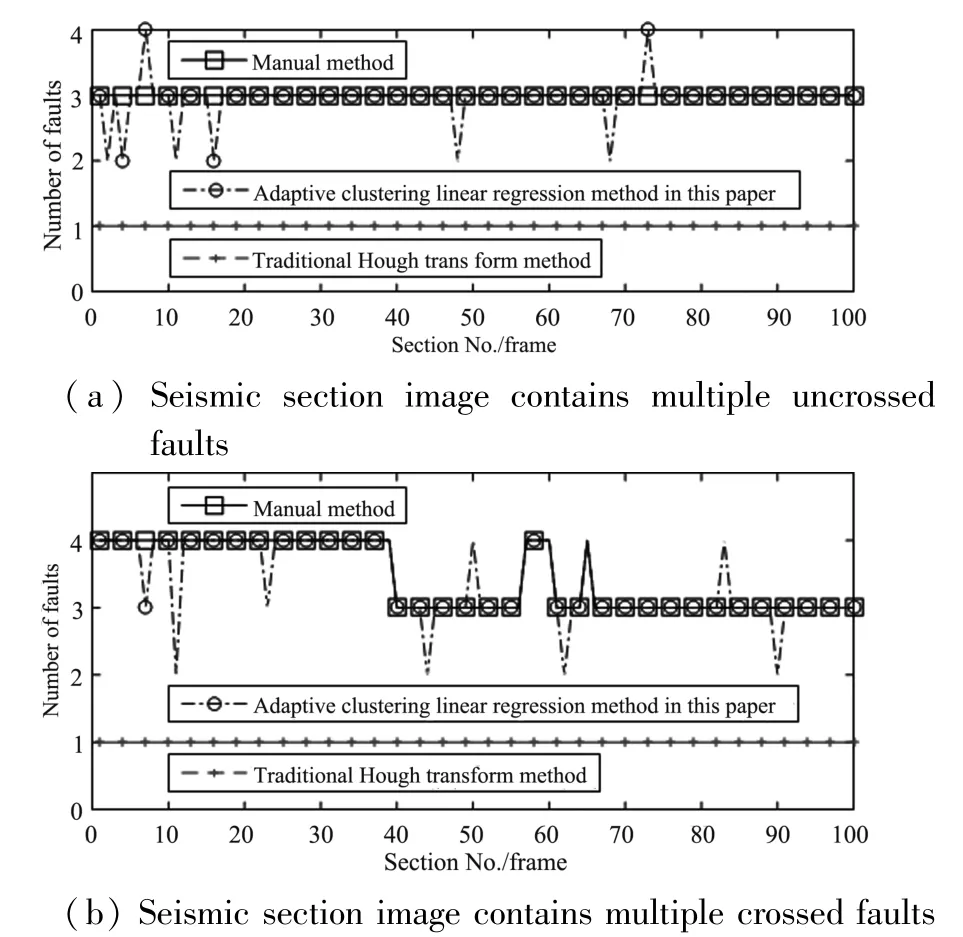
Fig.7 Comparison of the fault number recognized in each seismic section by different methods in different situations
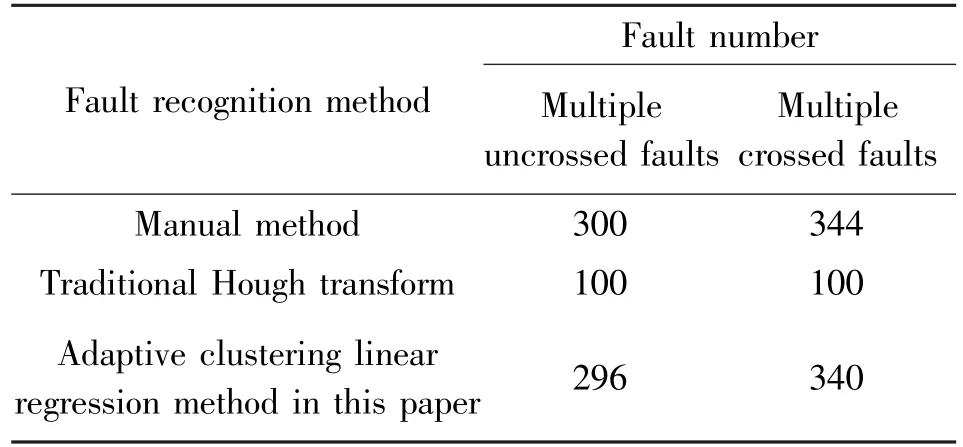
Table 2 Comparison of the total fault number obtained by different methods in different situations
It can be seen from Fig.7 and the data in Table 2 that when there are multiple uncrossed and multiple crossed faults, the method in Refs [8,9] can not obtain the correct number of faults, while the fault identification method based on adaptive clustering linear regression proposed in this paper can obtain the number of faults consistent with the manual method, with the accuracy of about 92% and 90% respectively.
To verify the effectiveness of the fault recognition method based on adaptive clustering linear regression proposed in this paper from the aspect of objective evaluation indicators further, the peak signal-to-noise ratio (PSNR) of the fault results obtained by the manual method is taken as the reference standard, and the PSNR of the fault results obtained by each method in the experiment is separately calculated.The PSNR of fault results obtained by various methods under different conditions is shown in Fig.8, and the average PSNR is given in Table 3.
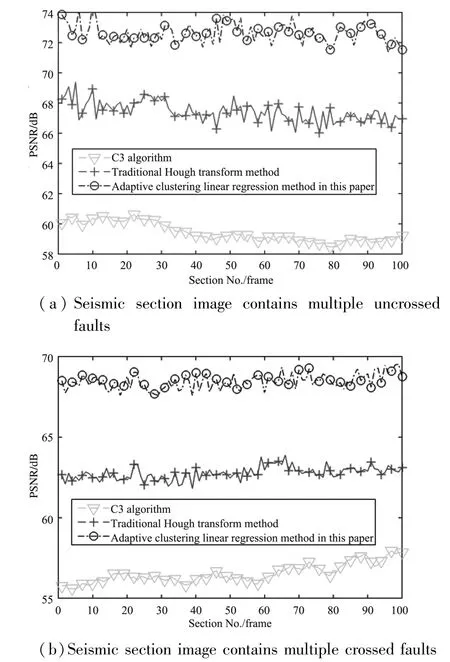
Fig.8 Comparison of the PSNR of the fault result by different methods in different situations
It can be seen from Fig.8 and Table 3 that the result of C3 algorithm has the lowest PSNR.When the seismic section contains multiple uncrossed and crossed faults, the PSNR of the method in Refs [8,9] is improved compared with the C3 algorithm, but it is still low.The PSNR and average PSNR of fault results obtained by the method based on adaptive clustering linear regression proposed in this paper are higher than those of the previous two methods, and the average PSNR is about 11% higher.Thus, the effectiveness of the proposed fault recognition method based on adaptive clustering linear regression is verified.
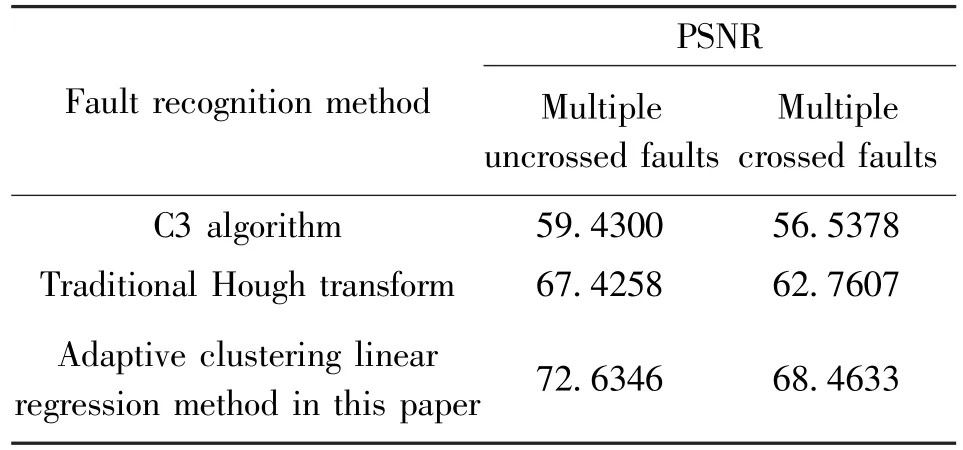
Table 3 Comparison of the average PSNR of the fault result by different methods
4 Conclusion
Aiming at the problems of low accuracy and large time consumption of existing fault identification methods, a fault recognition method based on clustering linear regression is proposed.Fault identification plays a key role in seismic interpretation.However, due to the lack of stable characteristics of faults, there is no recognized theoretical framework or model.This paper effectively combines the enhancement ability of the coherence cube algorithm to the fault,the detection ability of Hough transform to the point with linear distribution,and the classification ability of the clustering linear regression algorithm to the point with linear distribution, and identifies the fault in the seismic section on the premise of ensuring the best effect of each step,hoping to provide a meaningful model reference for the intelligent fault identification research.
 High Technology Letters2023年4期
- High Technology Letters的其它文章
- Design and implementation of control system for superconducting RSFQ circuit①
- A novel adaptive temporal-spatial information fusion model based on Dempster-Shafer evidence theory①
- A dynamic fusion path planning algorithm for mobile robots incorporating improved IB-RRT?and deep reinforcement learning①
- Deep learning-based automated grading of visual impairment in cataract patients using fundus images①
- Research on dual-command operation path optimization based on Flying-V warehouse layout①
- Two stream skeleton behavior recognition algorithm based on Motif-GCN①