
Impact of the Urban Heat Island Effect on Ozone Pollution in Chengdu City,China
2023-12-16 13:20SHIHaoyuanSONGXingtaoZENGShenglan
Chinese Geographical Science 2023年6期
SHI Haoyuan,SONG Xingtao,ZENG Shenglan
(Plateau Atmosphere and Environment Key Laboratory of Sichuan Province,Chengdu Plain Urban Meteorology and Environment Observation and Research Station of Sichuan Province,School of Atmospheric Sciences,Chengdu University of Information Technology,Chengdu 610225,China)
Abstract: With the advancement of urbanization,the urban heat island effect and ozone pollution have become hot issues in urban research.The urban heat island effect can impact ozone conversion,but its mechanism of action is unclear.In this study,the effects of the urban heat island effect on ozone concentration in Chengdu City,China,were investigated by comparing the ozone concentration under different heat island levels with ozone data from March 2020 to February 2021 and the temperature and wind field data of ERA5-Land during the same period.The results showed that: 1) regarding the distribution characteristics,the ozone concentration in Chengdu presented a ‘high in summer and low in winter’ distribution.The ozone concentration in summer (189.54 μg/m3) was nearly twice that in winter (91.99 μg/m3),and the ozone diurnal variation presented a ‘single peak and single valley’ distribution,with a peak at 16:00.2) For the characteristics of the heat island effect,the heat island intensity in Chengdu was obviously higher in spring than in other seasons,and the diurnal variation showed a ‘single peak and single valley’ distribution,with the peak and trough values appearing at 9:00 and 17:00,respectively.Spatially,the eastern part of Chengdu was a heat island,while the western and northwestern parts were mostly cold island.3) The correlation analysis between heat island intensity and ozone concentration showed a significant positive correlation but with a 7-8 h time lag.Ambient air temperature was not the main factor affecting ozone concentration.The heat island effect impacts the ozone concentration in two ways: changing the local heat budget to promote ozone generation and forming local urban wind,which promotes ozone diffusion or accumulation and forms different areas of low and high ozone values.
Keywords: ozone pollution;urban heat island effect;heat island intensity;lag correlation;Chengdu,China
1 Introduction
In recent years,with the continuous development of economy and the acceleration of urbanization,the study of urban thermal environment and ozone pollution has gradually become a hot issue in urban meteorological research.Based on vertical distribution,ozone can be divided into stratospheric ozone,tropospheric ozone,and near-surface ozone.Stratospheric ozone can absorb the sun’s ultraviolet radiation to protect life on Earth;however,tropospheric ozone is a greenhouse gas.If the tropospheric ozone concentration is too high,it can not only cause damage to the human respiratory system and plant death but also lead to aggravation of the greenhouse gas effect (Hallquist et al.,2009;Xu et al.,2018).Since the 1950s,photochemical smog has frequently occurred worldwide (Wakamatsu et al.,1999).Additionally,the scope of ozone pollution in China has continued to expand,and even the proportion of ozone as the primary pollutant in some areas has increased and replaced PM2.5(particulate matter) as the primary pollutant trend (Ma et al.,2019a).The urban heat island effect is a phenomenon in which heat accumulates in urban space due to urban buildings and human activities.The urban heat island phenomenon has been studied as one of the most prevalent effects of increased urbanization (Voelkel and Shandas,2017),with negative consequences such as air pollution (Li H D et al.,2018) and mortality (Lowe,2016).
Because of the ozone pollution and heat island effect harm to the human,more methods have been used in research in order to better understand the obstacles of ozone pollution and urban heat island effect on the urbanization process and harm to the human body.Wolf et al.(2017) developed land use regression models to predict the spatial variability of ozone in Augsburg region,Southern Germany.The analysis of Chakraborty et al.(2021) provided a global perspective on the importance of better constraining the urban prescription of surface emissivity for comparing satellite-derived and modelsimulated surface urban heat island intensities.Moreover,many other methods,including spatial autocorrelation (Li Xiaoyang et al.,2018),neighborhood normalized current model (Xie et al.,2022),and numerical simulation tests (Zhang et al.,2011),have been used in research.
During the process of previous research,scientists gradually understood the characteristics of ozone and the heat island effect.Both Li Bolan et al.(2018) and Yang et al.(2019) found the highest ozone concentration in summer.Jiang and Huang (2017) found differences in the spatial distribution of ozone concentration in China.Zhu et al.(2018) found that the heat island intensity was the strongest in winter and the weakest in summer in the Pearl River Delta,China.According to characteristics of heat island effect and ozone,researchers continued to find a variety of factors that affect ozone and urban heat islands,such as natural factors,including temperature (Hu et al.,2019;Lu et al.,2020),precipitation (Yu et al.,2009;Jia et al.,2021),wind(Wu et al.,2017;Zheng et al.,2019),relative humidity(Ma et al.,2019b),and sunshine (Hong et al.,2009;Cheng et al.,2017),and unnatural factors,such as urban and rural scales (Xu and Chen,2004;Zhao et al.,2021),impervious surfaces (Liang et al.,2020),etc.After identifying these characteristics and influencing factors,various methods have been proposed to mitigate ozone pollution and the heat island effect.By using the National Oceanic and Atmospheric Administration Meteorological Satellite,Earth Observation Satellite,Moderate-resolution Imaging Spectroradiometer data,and station data covering Chengdu City,Zhou et al.(2008) concluded that the heat island effect could be alleviated and the scope of the heat island reduced by focusing on green construction.Han et al.(2020) found that mid-rise buildings were significantly related to the cold island effect of parks in summer and winter.
However,most of the factors affecting ozone were meteorological.There have been few studies on the urban heat island effect and ozone concentration,although many have examined their interaction.Through numerical simulation results,Khiem et al.(2010) showed that the urban heat island phenomenon played an important role in the formation of high ozone concentrations in this region.Wang (2018) found that the heat island index in the Yangtze River Delta,China,was positively correlated with ozone,and the related factors affecting the urban heat island index and ozone were complex,but surface temperature and Normalized Difference Vegetation Index (NDVI) were the most important factors.In contrast,Wang (2020) found that the correlation between heat island intensity and ozone concentration in different seasons at each site in Beijing,China was generally poor,and many sites showed a negative correlation.The study by Gray and Finster (2000) of the Chicago area found that the increase in summer temperature was not the main cause of the increase in the summer ozone concentration in the region because the ozone concentration distribution was not completely consistent with the urban heat island intensity distribution.Although the results of these studies are inconsistent,it should be noted that they were performed in diverse regions that are quite different.Moreover,these previous studies rarely introduced the mechanism by which the heat island effect specifically impacted the spatiotemporal variation of ozone concentration in each city.In order to better determine the influence of the heat island effect on the characteristics of near-surface ozone pollution,relevant research in large cities in China is necessary.Chengdu is a prominent developmental city in the western part of China;the city’s rapid development in the past decades has highlighted environmental problems and its thermal environment.
The main purpose of this work was to determine the relationship between ozone concentration and the heat island effect in Chengdu City,China,and elucidate how the heat island effect impacts ozone concentration.The results could provide some theoretical support for the management of the heat island effect and ozone pollution in Chengdu City and guide the future development of urban planning.We analyzed the spatial and temporal distribution characteristics of ozone concentration and the urban heat island effect.Furthermore,we correlated the heat island intensity with ozone concentration using the ozone and meteorological monitoring data during the same period to reveal a general pattern of the urban heat island effect on ozone concentration in Chengdu,China.
2 Materials and Methods
2.1 Study area
Chengdu (102°54′E-104°53′E,30°05′N-31°26′N),the capital of Sichuan Province,is located in Southwest China,the western Sichuan Basin,the hinterland of the Chengdu Plain,and the eastern edge of the Qinghai-Tibet Plateau.Chengdu has an average elevation of 500 m and the highest point is 5364 m.The terrain inclines from northwest to southeast.The western part of Chengdu belongs to the edge of the Sichuan Basin,mainly steep hills and mountains.The eastern part belongs to the basin-bottom plain of the Sichuan Basin,which is formed by alluvial rivers such as the Minjiang and Jianjiang rivers.Chengdu is the heartland of the Chengdu Plain and is mainly composed of plains,terraces,and some low mountains and hills.Longquan Mountain,mainly located in Qingbaijiang and Longquanyi districts,is the natural boundary between the Chengdu Plain and Chuanzhong Hills.Due to the large vertical height difference,Chengdu has formed a unique landform comprising one-third of plains,hills,and mountains.It has a subtropical monsoon climate characterized by early spring,hot summer,cool autumn,and warm winter.The annual average temperature is 16°C,and the annual precipitation is approximately 1000 mm.A notable feature of Chengdu’s climate is the cloudiness and fog,and the daytime is short.Another notable feature is the humid air,presenting hot summers and cold winters.The precipitation is concentrated in July and August.The winter is dry and the spring is rainy,respectively,with very little ice and snow.The wind is mostly calm and the wind direction is mostly east and north wind during the year;secondary wind directions are north in June,July,and August and north-northeast in the rest of the months.
Currently,Chengdu has 12 municipal districts,five county-level cities,and three counties.According to the urban development plan,this study selected Jinjiang District,Qingyang District,Jinniu District,Chenghua District,and Wuhou District as urban areas (Fig.1),and the suburbs were counties and cities other than urban areas.Chengdu has a permanent population of 2.12 × 10⁷and an urbanization rate of 79.48% (Statistical Bulletin of Chengdu National Economic and Social Development,2022,https://www.xindu.gov.cn/gkml/cdsxdqtjj/gmjjhshfztjxx/1661967952352882689.shtml).
2.2 Data and methods
Ozone hourly data of six monitoring stations in Chengdu from March 2020 to February 2021 (https://quotsoft.net/air/#archive,cited in March 22,2022) were used in this paper;the data were strictly screened with reference to the Ambient Air Quality Standards of China,and missing data were excluded.
The temperature and wind field data were derived from the ERA5-Land hourly data from March 2020 to February 2021,and the 10 m wind speedu(wind in the direction of longitude) andv(wind in the direction of latitude) components from the ERA5 single level data.The temperature is the air temperature 2 m above the surface of land,sea,or inland water,calculated by interpolating between the lowest model level and the Earth’s surface,taking into account atmospheric conditions.The wind data are the eastward and northward components of the 10 m wind,referring to the horizontal speed of air moving eastward and northward at a height of 10 m above the Earth’s surface.The speed and direction of the horizontal 10 m wind can be obtained by combining with theuandvcomponents of the 10 m wind.
This paper used the 8-h moving average of the hourly ozone concentration data as the standard for evaluating the ozone pollution level for a specific day and the 90th percentile of the daily maximum value of the ozone 8-h moving average as the standard for the seasonal and annual ozone values.In addition,ArcGIS v10.0 software was used to implement the inverse distance weight interpolation method for the ozone concentration data of the monitoring sites,which were concentrated in the main urban area (Fig.1).The Kriging interpolation method was used for the temperature data of the ERA5 grid points,which were evenly distributed in Chengdu,to obtain the spatial distribution of ozone concentration and heat island intensity.
Heat island intensity refers to the difference between the average temperature in the central area of the city and the average temperature in the surrounding suburbs(Li and Zeng,2015) and is used to indicate the urban heat island intensity.In this paper,Chengdu was divided into two parts,the main urban and suburban areas,using county and district boundary data of Chengdu.The difference between the average surface temperatures of the two parts was the heat island intensity in this time period.The formulas are as follows:
whereUHIis the intensity of the Chengdu heat island;Turbanis the average temperature of the Chengdu urban area andTurban1is the ambient temperature of the first station in the main urban area;Tsubis the average temperature of the suburban area;andTsub1is the ambient temperature of the first station in the suburban areas,mandnrepresent the number of grid points in suburban and urban areas,respectively.
According to previous studies (Wang,2020),the intensity of a heat island is usually divided into five levels according to its size: when the heat island intensity is below 0.5°C,the heat island level is none;when the heat island intensity is [0.5,1.5)°C,[1.5,2.5)°C and [2.5,3.5]°C,the heat island level is weak,medium,intense,respectively.The heat island level is extreme when the heat island intensity is above 3.5°C.
Although the heat island intensity reflects the overall heat island effect of a city,it cannot show the spatial distribution characteristics of the heat island effect.Therefore,this study determined the local heat island intensity quantity and reflected the characteristics of the spatial heat island effect in Chengdu by calculating the heat island intensity of each grid point.The formula is :
whereIUHILOCALis the local heat island intensity of a pixel;Tskinis the surface temperature of a grid point;Tmeanis the average surface temperature.
In this paper,the bilinear interpolation method was used to obtain the temperature data corresponding to the ozone station.Then,correlation analysis was performed with the ozone data of the station to explore the relationship between the urban heat island effect and ozone pollution.According to the meteorological division scheme for the Northern Hemisphere (Meteorological Industry Standard of China),spring is from March to May,summer is from June to August,autumn is from September to November,and winter is from December to February.We abbreviated spring,summer,autumn and winter as MAM,JJA,SON and DJF,respectively.
3 Results
3.1 Spatial and temporal distribution characteristics of ozone concentration in Chengdu
3.1.1 Overview of ozone pollution
From March 2020 to February 2021,the duration (number of days) of the ozone concentration at each station in Chengdu exceeded the first-level standard for the concentration limit of ambient air pollutants (100 μg/m3)accounted for 30% to 40% of the study period,and the duration of the ozone concentration exceeded the secondary level standard (160 μg/m3) accounted for 10% to 15% (Table 1).The duration that the ozone concentration exceeded the standard in spring and summer was more than that in autumn and winter.The highest value of ozone concentration was in June,and the lowest value mostly occurred in December (Fig.2).
3.1.2 Temporal distribution of ozone concentration
(1) Diurnal variation in ozone concentration
The diurnal variation in ozone concentration in Chengdu showed an overall ‘single peak and single valley’ pattern,reaching a low point at approximately 08:00 and a peak at approximately 16:00 (Fig.3).This result is consistent with the study of Xu et al.(2018),which might be explained by the chemical and diffusion processes of ozone generation and dissipation.From the perspective of a single site,the daily change in ozone concentration at each site in Chengdu created a‘single peak and single valley’ trend,but the change in ozone concentration at the Lingyan Temple site lagged behind the other five sites by 2 h,and the change range of ozone concentration was smaller than that at other stations.Thus,Lingyan Temple was not as good as the other five sites.In terms of distance,the Lingyan Temple is approximately 60 km from the city center,with an altitude of 668 m and mountains on both sides,indicating that long-distance ozone transport may be in-volved.
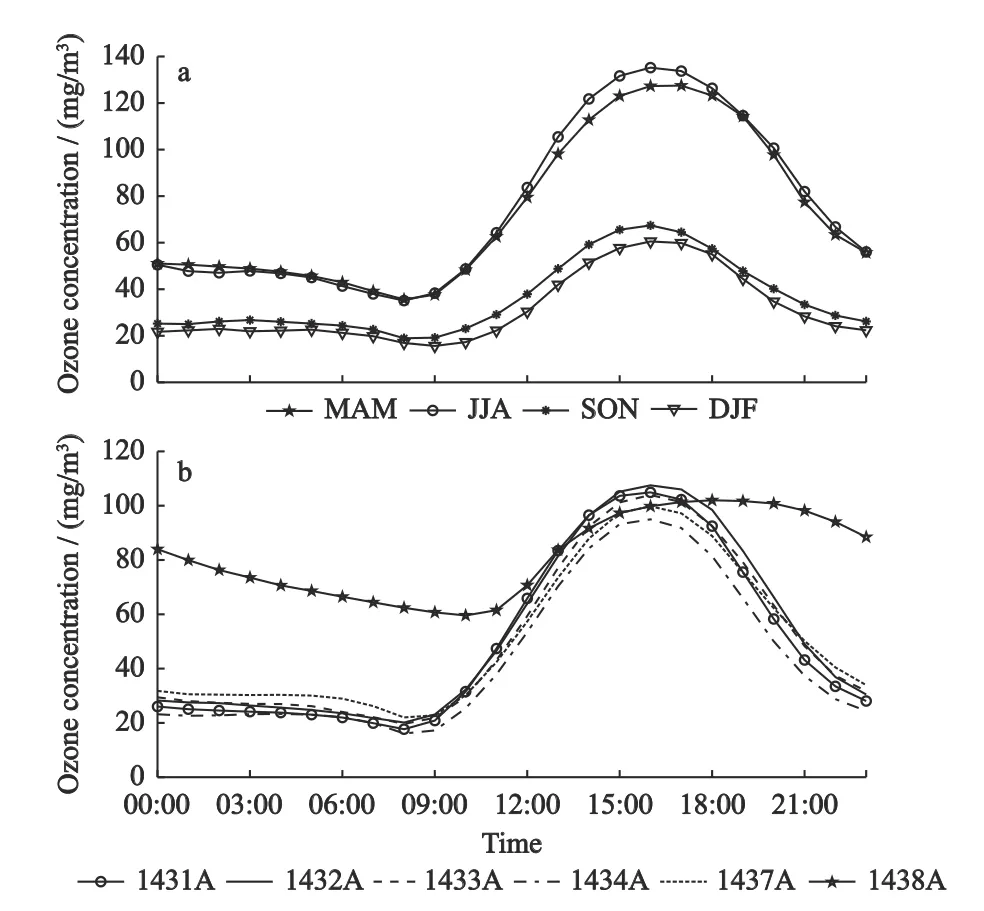
Fig.3 Diurnal variation of ozone concentration in each season(a) and each site (b) in Chengdu,China from March 2020 to February 2021.MAM,spring;JJA,summer;SON,autumn;DJF,winter.Site names are shown in Fig.1
(2) Seasonal variation in ozone concentration
The overall seasonal distribution of ozone in Chengdu was highest in summer,followed by spring and autumn,and lowest in winter (Fig.4).The ozone concentration in summer was nearly twice that in winter.In summer,the sunshine intensity and temperature were higher,and the photochemical reaction rate of ozone was fast.In addition,Chengdu has calmer winds,which are not conducive to the diffusion of pollutants,and the secondary reaction where VOCs reacts with O2led to an increase in ozone concentration.In summary,the ozone concentration was lowest in winter.
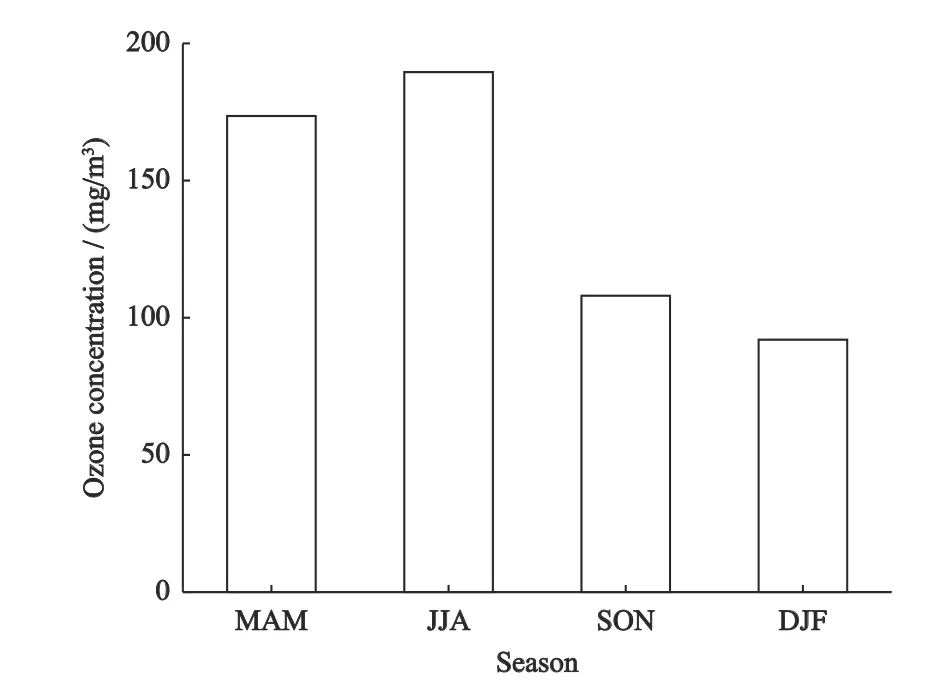
Fig.4 Seasonal ozone concentration in Chengdu,China from March 2020 to February 2021.MAM,spring;JJA,summer;SON,autumn;DJF,winter
3.1.3 Spatial distribution characteristics of ozone concentration
In spring,the ozone concentration was higher in the middle of the city and lower in the west and east,and higher in the western than in the eastern region (Fig.5).In summer and winter,the ozone concentration in the western region was lower than in the main urban area and the central region.The reason for these results might be explained by high traffic flow of the main urban area,the high population density,and strong anthropogenic emissions.The main urban area has many highrise buildings,which are not conducive to airflow and preventing the diffusion of pollutants.The four-season wind field distribution in Chengdu showed that the wind speed in the west is much lower than in the east.The western area is dominated by steep hills and mountains.Due to terrain blocking,the wind speed decreases,and ozone settles here,while the eastern area is affected by the northwest wind,and ozone is absorbed.Pollution is transported to other places on the south side of Chengdu.In addition,our results may be related to the urban layout.The west side of Chengdu is a large-scale commercial and trade gathering location,and the north side of the city is a hub connected with the northern cities;thus,mobile and fixed sources are relatively abundant.On the east side,industrial pollution has decreased with the relocation of large polluting enterprises.Overall,the ozone concentration in the west was higher than in the east.
3.2 Spatial and temporal distribution characteristics of the heat island effect in Chengdu
3.2.1 Characteristics of temperature change
The overall ambient temperature in Chengdu had a similar daily variation trend as the temperature in the main urban areas and suburban area (Fig.6).The ambient temperature fluctuated greatly in spring,with a relatively strong decrease in the ambient temperature in mid and late April.The ambient temperature in summer fluctuated little and reached a maximum at the end of July and the beginning of August.The ambient temperature in autumn continued to decrease,with a sharp decline in mid-to-late November.The ambient temperature in winter began to warm up after dropping to the lowest temperature in early January,but there was another temperature declining process at the end of February.

Fig.6 Annual variation of average daily ambient temperature in different regions in Chengdu,China from March 2020 to February 2021
Although the average temperature of each region showed good consistency in the changing trend of ambient temperature,there were also some differences in characteristics.The ambient air temperature in the main urban area was usually higher than in the suburban area.The urbanization process in Chengdu has accelerated in recent years,the population density has increased,and the nature of the underlying surface has changed,significantly increasing the ambient temperature (Zhang et al.,2020).Conversely,the northwestern part of Chengdu has a higher altitude,and the green coverage area is larger than that of the main urban area;these characteristics may play an important role in reducing the ambient temperature (Nie et al.,2021).
3.2.2 Variation characteristics of the heat island intensity
(1) Temporal distribution characteristics of heat island intensity
The average heat island intensity in Chengdu was highest in spring (2.55°C),followed by winter and summer (1.90°C and 1.88°C,respectively),and lowest in autumn (1.85°C).The daily average heat island intensity varied less in summer and autumn but was relatively large in winter and spring (Fig.7).

Fig.7 Annual variation of heat island intensity for each season in Chengdu,China from March 2020 to February 2021.MAM,spring;JJA,summer;SON,autumn;DJF,winter
Chengdu experienced 39 d of extreme heat island,52 d of intense heat island,21 d of weak heat island,62 d of medium heat island,and 9 d of intense heat islands in summer and spring.Chengdu had 84 d and 72 d of medium heat islands in autumn and winter,respectively,and intense heat island occurred for 5 d in winter(Table 2).Chengdu experienced intense heat islands mostly in spring and medium heat island in autumn.Chengdu experienced a weak heat island mainly in summer,during which the heat island intensity was also the weakest.Urban areas with high heat island intensity experienced only 1-2 d of extreme heat island and no heat island but 67 d,38 d,and 257 d of intense heat island,weak heat island,and medium heat island,respectively(accounting for 70.41%).The heat island level was mainly dominated by medium heat island,followed by intense and weak heat island;extreme and no heat island were rare.
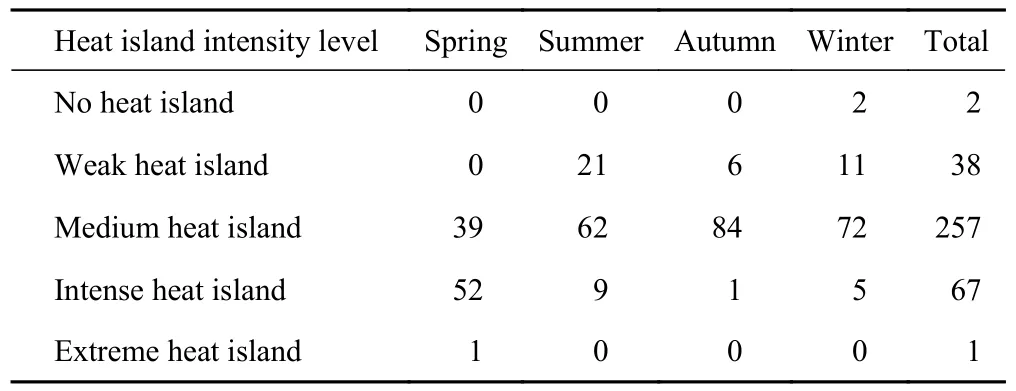
Table 2 The duration of different heat island levels for each season in Chengdu,China from March 2020 to February 2021/ d
The overall diurnal variation trend of the heat island intensity in each season in Chengdu was relatively similar;they all showed characteristics of first increasing and then decreasing (Fig.8).The summer heat island intensity began to decline after reaching a peak at 08:00,whereas the other three seasonal peaks were delayed by 1 h.The heat island intensity in winter decreased slightly in the early morning and began to increase after 02:00.
The previous studies on heat island intensity in Beijing and the Yangtze River Delta indicated that the diurnal variation of these two regions was also ‘single peak and single valley’ trend,which is similar to that in Chengdu.The difference was that the peak of the heat island intensity in Beijing was 1-2 h earlier than that in Chengdu (Li and Zeng,2015).Regarding the Yangtze River Delta region,the heat island intensity peaked between 12:00 and 14:00,gradually decreased overnight and only increased again at sunrise the next day,and did not increase at night (Fang et al.,2017).This pattern reflects significant differences in the intensity of heat islands in northern and southern China (Wang et al.,2015b).Wang (2015a) also found that changes in electricity consumption and the number of buses were the main factors causing changes in heat island intensity in southern China.A large population density and high electricity consumption in Chengdu contributed to the daily heat island intensity peak,approximately 2 h after the morning peak.
(2) Spatial variation characteristics of heat island intensity
The intense heat island was widely distributed in winter,and the highest heat island level was mainly in the southeast of Chengdu and the main urban area.On the contrary,intense heat islands only appeared in a small area southeast of Chengdu and were the smallest in summer.(Fig.9).This may be related to the precipitation in Chengdu,which is mainly concentrated in summer and autumn,where the accumulated precipitation exceeds 80% of the annual precipitation (Xie and Xie,2019).Since precipitation has an obvious negative effect on the heat island effect (Yu et al.,2009),this led to a small spatial distribution range of strong heat islands in summer and autumn.In addition,regardless of the season,cold islands appeared in the western and northwestern areas of Chengdu.This is closely related to the geographic location and development of the city (Ji et al.,2006).The west of Chengdu is connected to the Qinghai-Tibet Plateau,and the mountainous terrain is complex and not conducive to urban construction.The Longquan Mountain in the east separates the plain area.This kind of terrain has created the development of Chengdu in the northeast-southwest direction,which also makes Chengdu appear as a cold island in the western mountainous area,while the east is mostly a moderate or a strong heat island area.The tall buildings in the urban area reduce the wind speed and prevent the diffusion of heat and pollutants (Huang et al.,2015),exacerbating the heat island effect.

Fig.9 Spatial distribution of local heat island intensity for each season in Chengdu from March 2020 to February 2021.MAM,spring;JJA,summer;SON,autumn;DJF,winter
3.3 Influence of the heat island effect on the characteristics of ozone pollution
3.3.1 Correlation analysis between air temperature and ozone concentration
No strong correlation existed between temperature and ozone concentration in spring,autumn,and winter(Table 3).Ambient temperature and ozone concentration showed a weak negative correlation in summer.The correlation coefficients between ambient air temperature and ozone concentration at each site were all less than 0 (-0.263 to -0.155),indicating weak correlations.The change in ambient air temperature was not the most important factor affecting the change in ozone concentration.

Table 3 The correlation between temperature and ozone concentration in Chengdu,China from March 2020 to February 2021
The correlation between ambient temperature and ozone concentration differed slightly from those byKelly and Gunst (1990) and Kahle et al.(2015).Ooka et al.(2011) found that in the Kanto region of Japan,the ozone peak was as high as 84% in summer.Long-term changes in concentrations might be explained by changes in seasonal mean wind speeds.This paper analyzed the wind field of the four seasons in Chengdu (Fig.10).Overall,the results showed that the wind speed in the west was much lower than in the east,affecting the ozone concentration in the east more than in the west.The ozone in the central part of Chengdu will be transported to the west by an easterly wind.The western region is dominated by steep hills and mountains.Due to terrain obstructions,the wind speed will decrease,ozone will settle here,and the ozone concentration in the environment will increase.Affected by the northwest wind in the eastern region,ozone can be transported to other places on the south side of Chengdu;thus,the ozone concentration in the environment decreases.The overall temperature in the western region was lower than in the eastern region;thus,there was a low or even negative correlation between ozone concentration and ambient temperature.

Fig.10 Spatial distribution of seasonal wind fields for each season in Chengdu,China from March 2020 to February 2021.a.MAM,spring;b.JJA,summer;c.SON,autumn;d.DJF,winter
3.3.2 Hysteresis correlation analysis between heat island intensity and ozone concentration
The diurnal variation trends of ozone concentration and heat island intensity in different season were generally consistent,showing a ‘single peak and single valley’trend but with a certain hysteresis (Fig.11).The time lag was related to the seasonal correlation.The ozone concentration peak lagged behind the heat island intensity peak by 8 h in spring and summer and by 7 h in autumn and winter.There were also seasonal differences in the lag of low-point-values.This may have a strong relationship with the strengthening and weakening of the heat island intensity due to changes in solar radiation during the day and the generation and consumption of ozone (Huang et al.,2022).As for the hysteresis,ozone concentration and heat island intensity in the four seasons were significantly positively correlated,which is similar to the conclusion of previous studies (Yan,2013).The urban heat island effect changed the heat budget of the region,accelerated the local temperature change rate,increased the photochemical reactivity of the urban atmosphere,and increased the ozone concentration.The temperature could still be maintained at a higher value,generating hysteresis in the ozone concentration peak.

Fig.11 Diurnal variation of ozone concentration and heat island intensity (UHI) for each season in Chengdu,China from March 2020 to February 2021.MAM,spring;JJA,summer;SON,autumn;DJF,winter
3.3.3 The influence of the urban heat island effect on the spatial distribution characteristics of ozone pollution
With the strengthening of the heat island level,the overall ambient ozone concentration in Chengdu also increased,confirming the previous conclusion that the two are positively correlated (Table 4).

Table 4 The lag correlation coefficient between heat island intensity and ozone concentration in Chengdu,China from March 2020 to February 2021
However,there were certain differences in the spatial distribution characteristics of the ozone concentration under different heat island intensity levels (Fig.12).Under the influence of the extreme heat island effect,the ozone concentration was higher in central urban areas such as Qingyang District and Jinniu District,as well as the Xincheng District and the north of Qingbaijiang District.The highest value reached 226 μg/m3.In contrast,the western side of Dujiangyan City and Chongzhou City,Wuhou District,the south side of Jinjiang District,and the north of Shuangliu District and other regions had lower concentrations,with the lowest value of 205 μg/m3.Comparing the heat island intensity distribution map,we found that,except for the Shuangliu area and the southern part of Wuhou District and Jinjiang District,the area with a low ozone concentration corresponded to the area with a low heat island intensity,and the area with a high ozone concentration corresponded to the area with a high heat island intensity.Under other heat island intensity levels,the high ozone concentration area dominated by Dujiangyan City had a lowvalue area for heat island intensity,and the ozone concentration dominated by southern and southeastern Chengdu,Shuangliu District,Longquanyi District,Jinjiang District,and Jianyang City had a high-value area for heat island intensity.
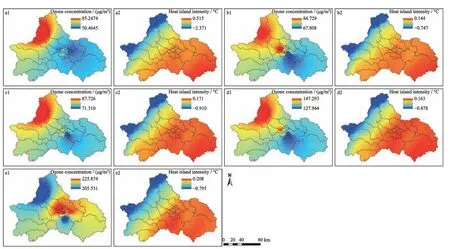
Fig.12 Spatial distribution of ozone concentration and local heat island intensity in Chengdu,China under different heat island levels.a-e represent no heat island,weak heat island,medium heat island,intense heat island,and extreme heat island,respectively.1,ozone concentration;2,local heat island intensity
As the intensity level of the heat island continued to decrease,the low-value area of ozone concentration gradually moved from the southeast to the northwest of Chengdu,which was most evident without the heat island level.The five districts in the main urban areas were all low-value areas of ozone concentration,and the lowest value reached 50 μg/m3.However,the location of the high-value areas of ozone concentration did not change significantly,and they were mainly located on the northwest of Chengdu,with Dujiangyan City as the main area.In addition,with the decline in the heat island level,the heat island intensity in the central and eastern parts of Chengdu decreased,the area with high heat island intensity continued to move eastward,and the area with low heat island intensity did not change significantly.
The analysis of the wind field data might partially explain the spatial variation of ozone concentration.As shown in Fig.13,the wind field distribution in Chengdu under different heat island levels was characterized by low values in the West and high values in the East.Under the influence of extremely strong heat island intensity,the east wind was in a southeasterly direction,and the west wind was westerly.The wind speed increased with the decrease in the heat island intensity level from the strong heat island to the no heat island areas.The phenomenon of high wind speed improved the convection in the area and created favorable conditions for the diffusion of ambient ozone,which caused the low-value area of ozone concentration in Chengdu to move westward.In addition,the wind direction did not change significantly under the three heat island intensity levels of strong,medium,and weak.The eastern region was affected by the northwesterly wind,and ozone was transported to areas on the south side of Chengdu under the action of the wind field.Due to the migration of ozone,the ozone concentration in the regional environment decreased.

Fig.13 Wind field distribution under different heat island levels in Chengdu,China.a-e represent no heat island,weak heat island,medium heat island,intense heat island,and extreme heat island,respectively
In summary,the urban heat island effect can affect the diffusion of ozone through the local wind field and indirectly affect the distribution characteristics of ozone pollution.For Chengdu,when the heat island intensity was high,the confluence of winds on both sides of the city caused the accumulation of ozone in the new urban and Qingbaijiang areas,resulting in a high ozone concentration.Diffusion resulted in a region of low ozone concentration.
4 Discussion
Chengdu has the second largest traffic congestion in China.During rush hour,a large amount of pollutants,such as nitric oxide (NO) and volatile organic compounds(VOCs),are emitted.The NO concentration rises rapidly and reacts with ozone,which suppresses ozone to a minimum value.At night,the height of the atmospheric boundary layer is low,and the stability of the atmosphere is not conducive to the dilution and diffusion of pollutant concentrations.Therefore,local emissions will cause the accumulation of ozone precursor concentrations at night (Ling et al.,2009).At sunrise,the nitrogen dioxide (NO2) accumulated at night begins to photolyze,and hydroxide radicals are generated to oxidize VOCs.The generated peroxy radicals react with NO,causing ozone to accumulate.In this process,with the gradual strengthening of solar radiation,the turbulent flow in the afternoon is strong,which transports the ozone downward (Li et al.,2003) and increases the ozone concentration,reaching a peak at approximately 16:00.After 16:00,the NO concentration increases again due to the appearance of the evening peak,depleting ozone and causing the ozone concentration to decrease.At night,ozone is depleted by atmospheric photochemical reactions and deposited near the ground (He et al.,2018).Additionally,there may be a large amount of exhaust gas from diesel vehicles at night,which keeps the NO concentration high and the ozone concentration low.In addition,stationary sources such as transportation,petrochemicals,coal-fired plumes,and biomass burning emit ozone precursors,and long-distance transportation may increase the ozone concentration.
The reason for the high ozone concentration in spring may be ‘tropospheric folding’,and the high ozone concentration in the upper part of troposphere was transported down to the Earth’s surface through deposition and advection,thus increasing the surface ozone concentration (Li et al.,2020).In winter,the temperature inversion layer is thick,the atmospheric structure is stable,and the convection is inactive,which is not conducive to the diffusion of pollutants,resulting in the accumulation of ozone precursors such as nitrogen oxides (NOx)and VOCs in the bottom of the troposphere (Yi et al.,2015).In addition,the solar radiation and temperature in winter are relatively weak.Therefore,the photochemical reaction rate is relatively low,and the primary pollutants (NOx,non-methane hydrocarbons,carbon monoxide,etc.) undergo photochemical reactions to promote the formation of a secondary pollutant ozone at the bottom of the troposphere.In addition,the PM2.5concentration in winter is relatively high,according to Zhang et al.(2021).Previous research (Cai et al.,2013) found that high concentrations of particulate matter can cause an increase in aerosol optical thickness,reduce solar radiation to a certain extent,weaken the activity of photochemical reactions,and reduce the generation of ozone.As particle number concentration increases rapidly,the surface area concentration of particulate matter increases accordingly.Heterogeneous chemical processes that occur on the surface of particulate matter may also have some effect on ozone concentrations.In addition,He et al.(2018) found that the generation and consumption of ozone mainly depended on the control of local photochemical reactions.In addition to being affected by meteorological conditions such as light radiation,it is affected by its precursors (NO,NO2,NOx,etc.) concentration changes closely,which also showed a weak direct relationship between the temperature and the ozone concentration.
This study found that the heat island intensity and the ozone concentration were significantly positively correlated,but there was a time lag.Our results are in contrast with those by Wang (2020),who did not show a lag and obtained a weak correlation between ozone concentration and heat island in Beijing.The research of Yan (2013) noted that the heat island circulation in Chengdu in summer was conducive to the accumulation of pollutants in the urban area to form a dust cover,which increased the ozone concentration in the near-surface troposphere,but did not consider the local wind field generated by the heat island effect.Liu et al.(2019) studied the influence of circulation on the interannual variation in ozone concentration in North China and noted that the contribution rate of the local circulation to the interannual variation in ozone concentration in four cities in the North China urban agglomeration was higher than 60%.However,they discussed only the influence of local meteorological elements on the daily variation in ozone and did not explore the influence of different heat island levels on the distribution of ozone concentration.In addition,previous studies on the heat island effect paid more attention to larger time scales(Cao et al.,2017,Yang et al.,2018,Li et al.,2020),whereas the current study investigated the heat island effect in Chengdu at different seasons and also calculated the heat island intensity every hour and day,which can better reflect the variation in heat island intensity at different times in the city.Moreover,the hourly data for heat island intensity and the corresponding ozone data were used to correlate the results for better accuracy.
This study found that the heat island effect had a certain impact on the pollution characteristics of near-surface air pollutants,and this impact was related to factors such as the city and its surrounding environment.However,the conclusions obtained from studies on different cities in China are inconsistent.Studying the impact of the heat island effect on near-surface air pollutants has positive significance for deepening the understanding of the urban atmospheric environment,alleviating urban air pollution,and improving urban atmospheric models.
5 Conclusions
Taking Chengdu,China as a case,this paper analyzed the spatial distribution of ozone concentration under the influence of various levels of the heat island effect from March 2020 to February 2021 and explored the impact of different regional heat budgets on the generation of ozone concentration.We also determined the effect on ozone diffusion.The following conclusions can be made from the study results.
(1) From a temporal perspective,the ozone concentration in Chengdu was highest in summer,followed by spring and autumn,and was lowest in winter,and the diurnal variation created a ‘single peak and single valley’trend.From a spatial perspective,the ozone concentration in the main urban and central areas was high in summer and low in the west.In addition,the ozone concentration was higher in the middle of the city and lower in the west and east in spring and relatively higher in the southern region in winter.
(2) The daily change trend of ambient temperature in Chengdu was unimodal and first increased and then decreased,and the temperature in the main urban area was usually higher than that in the suburbs.However,the diurnal variation trends of the heat island intensity in the different seasons were similar and showed a characteristic pattern of first increasing and then decreasing.From a spatial distribution perspective,winter had the widest distribution of strong heat island in Chengdu,and summer had the smallest distribution of extremely strong heat island.Regardless of the season,the cold islands appeared in the west and northwest of Chengdu,and the heat islands appeared in the east.Furthermore,the strong heat island range at the summer and autumn peak time was significantly larger than that of the lowpoint-time.
(3) There was a significant positive correlation between the heat island intensity and ozone concentration but with a time lag.Ambient air temperature was not the main factor affecting ozone concentration.The heat island effect impacts the ozone concentration in two ways.The first is by changing the local heat budget to promote ozone generation,and the second is by forming local urban winds,which promote the diffusion or accumulation of ozone and form different areas of low and high ozone values.
Conflict of Interest
The authors have no competing interests to declare that are relevant to the content of this article.
Author Contributions
All authors contributed to the study conception and design.Material preparation,data collection and analysis were performed by SHI Haoyuan,SONG Xingtao and ZENG Shenglan.The first draft of the manuscript was written by SHI Haoyuan and all authors commented on previous versions of the manuscript.All authors read and approved the final manuscript.
 Chinese Geographical Science2023年6期
- Chinese Geographical Science的其它文章
- Variations in Surface Urban Heat Island and Urban Cool Island Intensity: A Review Across Major Climate Zones
- Spatiotemporal Evolution Characteristics of Urban Land Surface Temperature Based on Local Climate Zones in Xi’an Metropolitan,China
- Cross-border Urban Networks Based on Manufacturing Global Value Chain: A Study of Listed Companies in Western China
- Spatiotemporal Differences and Classification Regulation of Urbanization Impact on Agricultural Development in Shrinking Areas: A Case Study of 15 Shrinking Cities in Three Provinces of Northeast China
- Leave or Stay? Antecedents of High-level Talent Migration in the Pearl River Delta Megalopolis of China: From a Perspective of Regional Differentials in Housing Prices
- Spatial Distribution Pattern and Influencing Factors of Physical Bookstores of Large Cities: A Case Study of Three National Central Cities in Western China