
Spatiotemporal Evolution Characteristics of Urban Land Surface Temperature Based on Local Climate Zones in Xi’an Metropolitan,China
2023-12-16 13:20ZHANGLipingZHOULiangYUANBoHUFengningZHANGQianWEIWeiSUNDongqi
Chinese Geographical Science 2023年6期
ZHANG Liping ,ZHOU Liang, ,YUAN Bo ,HU Fengning ,ZHANG Qian, ,WEI Wei,SUN Dongqi
(1.Faculty of Geomatics,Lanzhou Jiaotong University,Lanzhou 730070,China;2.Institute of Geographic Sciences and Natural Resources Research,Chinese Academy of Sciences,Beijing 100101,China;3.Department of Geography and Environment,University of Hawaii at Manoa,Honolulu,Hawaii 96822,United States;4.College of Geography and Environmental Science,Northwest Normal University,Lanzhou 730070,China)
Abstract: Local climate zones (LCZs) are an effective nexus linking internal urban structures to the local climate and have been widely used to study urban thermal environment.However,few studies considered how much the temperature changed due to LCZs transformation and their synergy.This paper quantified the change of urban land surface temperature (LST) in LCZs transformation process by combining the land use transfer matrix with zonal statistics method during 2000-2019 in the Xi’an metropolitan.The results show that,firstly,both LCZs and LST had significant spatiotemporal variations and synchrony.The period when the most LCZs were converted was also the LST rose the fastest,and the spatial growth of the LST coincided with the spatial expansion of the built type LCZs.Secondly,the LST difference between land cover type LCZs and built type LCZs gradually widened.And LST rose more in both built type LCZs transferred in and out.Finally,the Xi’an-Xianyang profile showed that the maximum temperature difference between the peaks and valleys of the LST increased by 4.39°C,indicating that localized high temperature phenomena and fluctuations in the urban thermal environment became more pronounced from 2000 to 2019.
Keywords: urban land surface temperature (LST);local climate zones (LCZs);thermal environment;time series;urban sustainable development;Xi’an metropolitan,China
1 Introduction
The renewal and extensive expansion of built-up areas is one of the most representative symbols of urbanization (Hu et al.,2022).From 1980 to 2020,the built-up areas have expanded by more than 150% around the world,which leads to significant changes in global climate and seriously threatens the livability and sustainability of cities (Shaw et al.,2020;Hsu et al.,2021).Currently,56% of the world’s population lives in cities,and this proportion is expected to exceed 60% in the next decade (Zhang and Pan,2021).In China,where the urban population is expected to increase by 300-400 million by 2050 (Fang and Wang,2021).Human activities in the process of urbanization have greatly altered land cover and land surface characteristics,affecting the surface energy balance and resulting in higher temperatures in urban areas compared to rural areas,forming the urban heat island (UHI) phenomenon (Chao,2009;Ghosh et al.,2021;Liu et al.,2021;Wijeratne and Li,2022).This poses a serious threat to the human living environment and public health (Kondo et al.,2021;Wang et al.,2021).Therefore,understanding the urban heat generation process caused by the evolution of urban spatial form is of great significance for improving the urban thermal environment,enhancing quality of life,and achieving sustainable development and planning of cities.
Exploring the drivers of increasing land surface temperature (LST) is a prerequisite for effectively mitigating the surface urban heat island (SUHI) (Jia and Zhao,2020).Previous studies have focused on urban-rural LST differences based on land use/land cover,ignoring the spatial heterogeneity within cities (Zhou and Wang,2011;Tran et al.,2017).Thus Stewart and Oke (2012)proposed local climate zones (LCZs) classification scheme for UHI studies,which links urban morphology to thermal properties.LCZs effectively combine surface features with three-dimensional space by considering geometric,surface cover,thermal,radiative,and metabolic properties,making each LCZ type distinct from other types of LCZ (Wang et al.,2018).There are three classification methods currently used for mapping LCZs: 1) manual sampling,because of the time and effort involved,this method is mainly used to classify LCZ types with little distribution when the analysis cells are grids or blocks of a specific size (Jin et al.,2020).2) GIS-based classification (Zheng et al.,2018;Unal Cilek and Cilek,2021;Aslam and Rana,2022),which requires input of a large number of urban morphological parameters,such as building height and sky view factor,and the operation is relatively complicated with a large amount of data.3) RS-based classification (Yoo et al.,2019),which applies machine learning algorithms to RS images in terms of basic pixels or objects,and this method is widely accepted due to easier selection of training samples and acquisition of models.There have been many studies using deep learning approaches to classify LCZs,which have better classification accuracy and spatial portability than machine learning (Rosentreter et al.,2020;Kim et al.,2021),but they are not widely used due to the relative complexity of the model.
Currently,due to the time-consuming collection of LCZs training samples,most current LCZs mapping is limited to one period to compare the day-night (Cao et al.,2022;Yuan et al.,2022) and seasonal variations (Li et al.,2022;Zhou et al.,2022).These studies found that there is a significant difference in the thermal environment condition of the city day/night/season influenced by the density of LCZs,surface material,etc.(Du et al.,2020;Chen et al.,2022).However,the above studies ignore the impact of changes in LCZs on LST during rapid urbanization.Urbanization has caused dramatical changes in local urban morphology,it is of great significance to explore the spatiotemporal changes of urban morphology using multi-temporal LCZ maps.Therefore,long-term studies with LCZs scheme are gradually emerging,including studies of regions such as the Guangdong-Hong Kong-Macao Great Bay Area (Xie et al.,2022)and the Changsha-Zhuzhou-Xiangtan (Chang-Zhu-Tan)urban agglomeration (Zheng et al.,2022) in China.However,the current exploration of long-term changes in LCZs and the relationship between LCZs and LST is still limited.
To explore the changing characteristics of urban morphology during urbanization via LCZs,scholars have discussed the spatial location,type composition,and density changes of LCZs (Yuan et al.,2021;Wang et al.,2022).Studies have shown a significant decrease in the proportion of low-rise buildings and the development of cities towards higher and denser (Han et al.,2022),which leads to an enhanced SUHI,while enhancing the probability of thermal risk to residents (Zhou et al.,2021).In contrast,blue-green spaces consisting of water bodies and vegetation can mitigate SUHI to some extent (Kotharkar et al.,2020;Zhou et al.,2022a).The ventilation corridors formed by open/sparse buildings can also mitigate the thermal environment to some extent,but when the building height and density increase at the same time,a ventilation barrier is formed (Yang et al.,2019).However,most of these studies focus on the characteristics of the spatial distribution of LCZs and LST and their temporal changes at the urban scale,and there are deficiencies in the quantitative calculation of the changes in the area of LCZs during the urbanization process (especially the interconversion of different LCZ types) and the analysis of their impacts on LST.
In view of the abovementioned research deficiencies,this study takes the Xi’an metropolitan area in China to explore its long-term temporal and spatial pattern changes,and the impact of LCZs change caused by urbanization on LST.The research objectives of the paper are: 1) to explore the urban expansion trend and the law of LST changes by obtaining the temporal and spatial characteristics of LCZs and LST in the long time series of 2000-2019;2) quantitative analysis of LCZs conversion through land use transfer matrix to obtain specific processes and patterns of urban development;3) to analyze the intensification of LST by identifying the changes in LST caused by the spatial conversion of LCZs.This research aims to provide insights based on LCZs to improve urban thermal environments and contribute to urban planning and sustainable urban development.
2 Data and Methods
2.1 Study area
Xi’an is located in the middle of China between 107.40°E-109.49°E and 33.42°N-34.45°N,adjacent to the Weihe River in the north and the Qinling Mountains in the south (Fig.1).It has a temperate monsoon climate with moderate precipitation and four distinct seasons with the annual precipitation ranges from 522.4 to 719.5 mm.The average temperature in January,the coldest month,is -0.5°C to 1.3°C.In July,the hottest month,the average temperature is 26.3°C to 27.0°C.As the largest city in Northwest China and the capital of Shaanxi Province,Xi’an has experienced rapid economic development and population agglomeration in recent years,accompanied by remarkable urban expansion and changes in urban morphology.According to the Xi’an Statistical Yearbook (http://tjj.shaanxi.gov.cn/tjsj/ndsj/tjnj/),the urban population of Xi’an grew from 4.5036 million in 2000 to 10.2643 million in 2020.The built-up area grew from 186.97 km2 in 2000 to 920.18 km2 in 2020.Rapid urbanization has exacerbated the occurrence of extreme heat events and worsened the heat island effect in Xi’an.For example,17 d with high temperatures close to or greater than 40°C in 2017,and the longest duration could be as long as 10 d.Therefore,it is urgent to investigate the relationship between changes in internal structure and dramatic changes in LST in Xi’an,which is important for improving the urban thermal environment.In this paper,we study the Xi’an metropolitan area,which includes the main urban area of Xi’an and most of the urban area of Xianyang,and the surface morphology within this research area is complex and diverse,including urban,suburban,mountainous,farmland,and water,etc.,totaling 1967.46 km2.
2.2 Data
The data mainly used in this study include Landsat series satellite images (https://earthexplorer.usgs.gov/)and historical satellite images with ultra-high resolution in Google Earth Pro.Because ultra-high resolution Google images before 2000 are not available and the uncertainty caused by lockdown during COVID-19 epidemics needs to be avoided,this study analyzed the urban structure of Xi’an metropolitan and the changes in LST in 2000-2019.Landsat series images (Landsat5,Landsat7,and Landsat8) from 1st June to 1st September in 2000-2019 were selected to retrieve LST.However,due to cloud contamination,no available images or less than three images in the year of 2005 and 2015.Therefore,we use the LST data of the same period in the adjacent year to make up (Liu et al.,2020).The average surface temperature is calculated to reduce uncertainty caused by images obtained from different periods (e.g.,solar elevation angle and meteorological conditions).See Appendix Table S1 for Landsat series images information used in this study.
2.3 Methods
The methodology in this paper includes the following steps (Fig.2).Firstly,by classification and calculation the LCZs and LST are obtained,respectively.Secondly,the amount of transformation of LCZs in time series was obtained using the land use transfer matrix.Thirdly,the LCZs were resampled using the nearest neighbor interpolation of layer stacking in software ENVI 5.3,unifying the resolution of LCZs and LST to 100 m,and band combinations of LCZs and LST for two years before and after.Then we obtained the LCZ types of each raster point before and after two years and calculate the LST difference in Python,to analyze the amount of change of LST during the transformation of LCZs.Finally,the profile data of LCZs and LST are obtained to analyze the integration process of the twin cities of Xi’an-Xianyang.
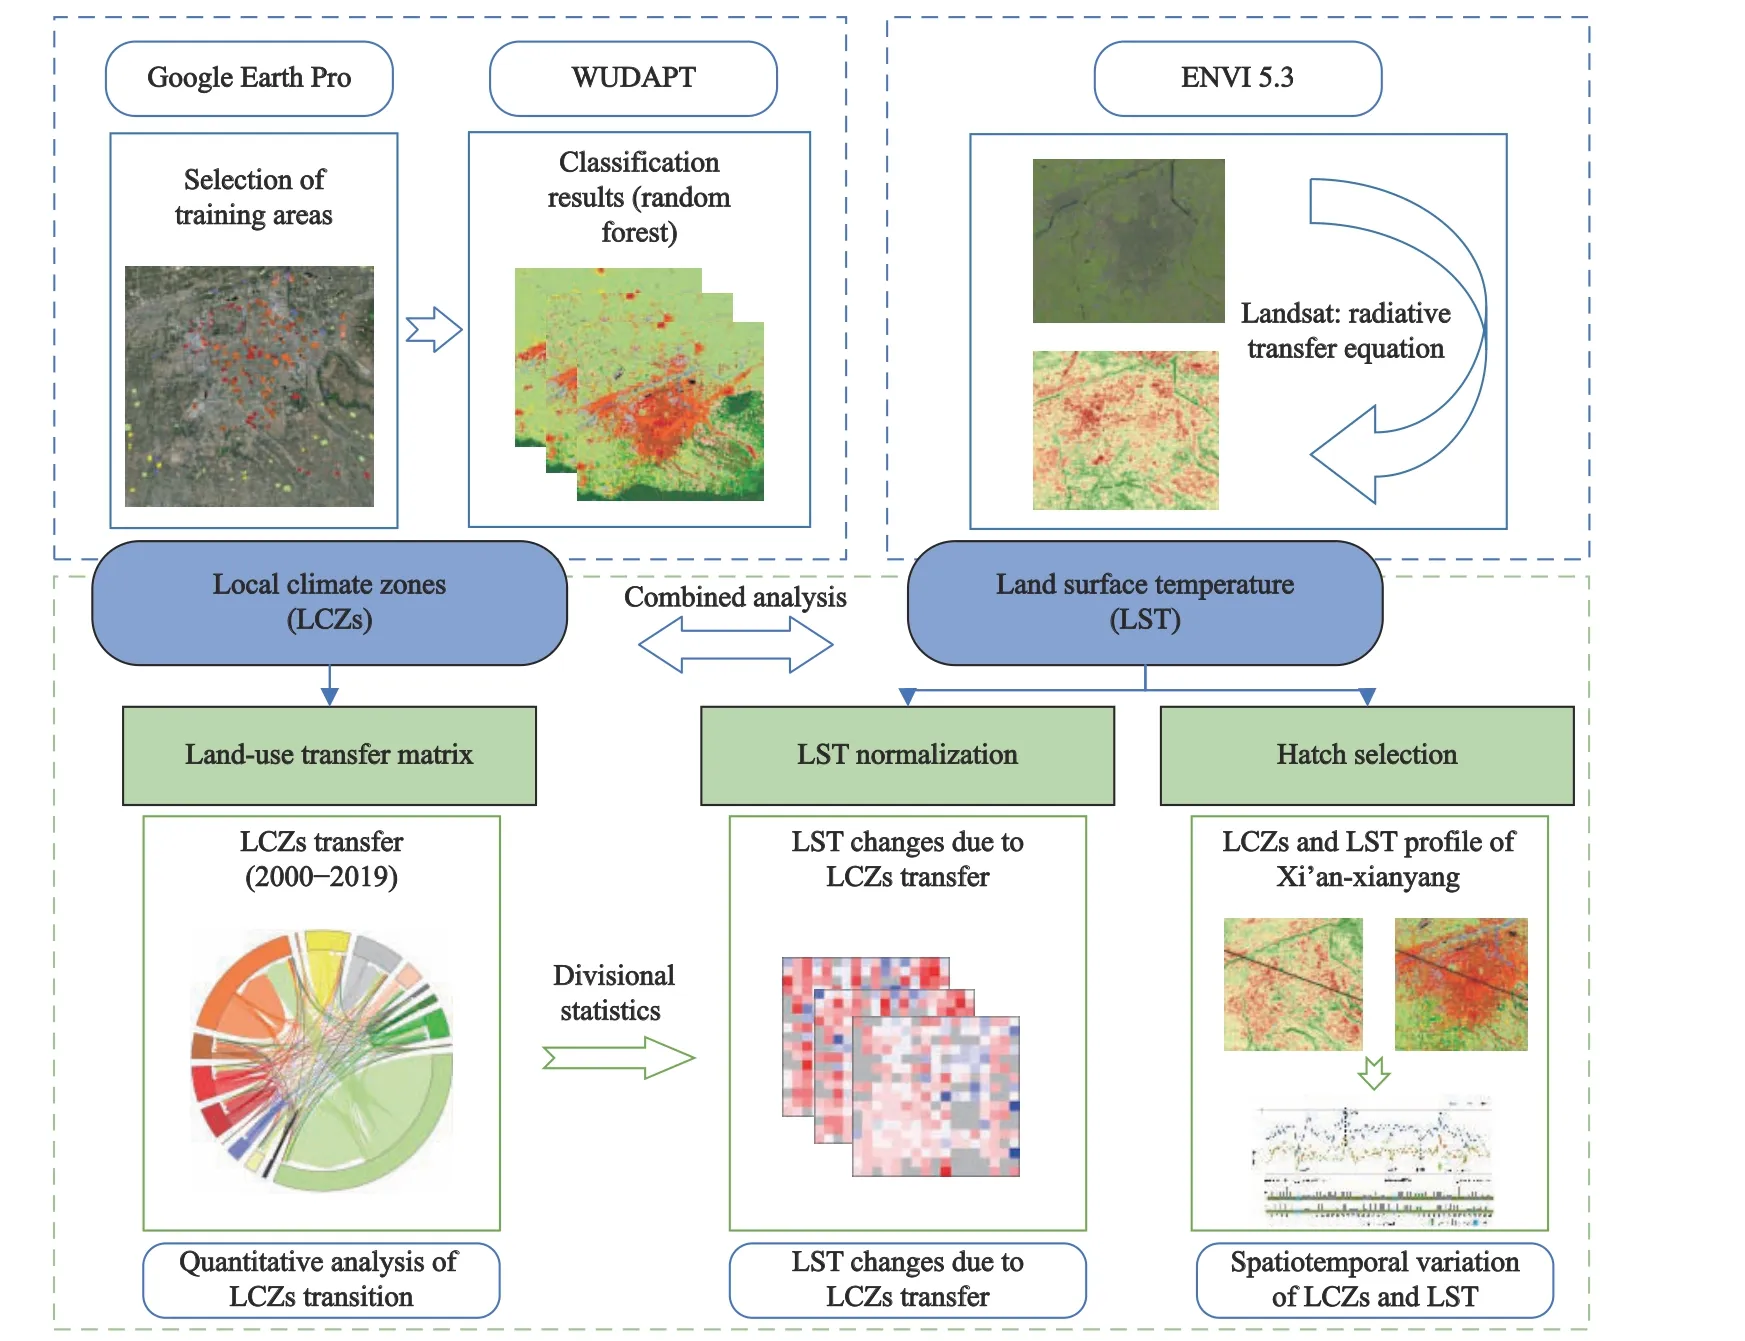
Fig.2 Framework of this study (WUDAPT: World Urban Database and Access Portal Tools;LCZs: local climate zones;LST: land surface temperature)
2.3.1 LST retrieval
We used the software ENVI 5.3 for Landsat image processing,and the LST for each period was retrieved using the atmospheric correction method (Weng and Schubring,2004).The expression for the thermal infrared radiance valueLλ(W/(m2·sr·μm)) obtained by the satellite sensor can be written as:
whereTs(K) is the true LST,B(Ts) (W/(m2·sr·μm)) is the blackbody thermal radiance,Lu(W/(m2·sr·μm)) is the atmospheric upward radiance,Ld(W/(m2·sr·μm)) is the atmospheric downward radiance,andτ(W/(m2·sr·μm))is the atmospheric transmittance in the thermal infrared band obtained from http://atmcorr.gsfc.nasa.gov/.εis the surface specific emissivity calculated as follows:
wherePvis the vegetation cover and is calculated as follows:
NDVIis the normalized vegetation index,NDVIsoilis theNDVIvalue of the area completely covered by bare soil or no vegetation,andNDVIvegrepresents theNDVIvalue of the image element completely covered by vegetation,i.e.,theNDVIvalue of the pure vegetation image element.The empirical values ofNDVIveg=0.70 andNDVIsoil=0.05 are taken,that is,when theNDVIof an image element is greater than 0.70,Pvtakes the value of 1;whenNDVIis less than 0.05,Pvtakes the value of 0 (Qin et al.,2004).
Besides,B(Ts) of a blackbody at temperatureTsin the thermal infrared band is:
The final calculation gives the LST:
whereK1,K2are the band-specific thermal conversion constants from the metadata.For TM,K1=607.76 W/(m2·sr·μm),K2=1260.56 K;for ETM +,K1=666.09 W/(m2·sr·μm),K2=1282.71 K;for TIRS Band10,K1=774.89 W/(m2·sr·μm),K2=1321.08 K (Weng and Schubring,2004).
2.3.2 LCZs classification
The LCZs mapping is classified into 10 built type areas and 7 land cover type areas (Fig.3).Secondary sources of site metadata including aerial photographs and satellite images,such as Google Earth Pro,were used to digitize the training area for LCZs supervised classification,the number of LCZ training samples is shown in Table S2.We refer to the method of Demuzere et al.(2021) and Han et al.(2022) for the classification and accuracy check of LCZs.The final classification results are shown in Fig.4.The overall accuracy (OA) of 2000,2005,2010,2015,2019 were 0.67,0.77,0.74,0.81,0.79 respectively.LCZ 1 and LCZ 4 were not categorized due to the lack of high-rise buildings in 2000.

Fig.3 LCZs (local climate zones) training samples (Redrawn according to Stewart and Oke (2012))
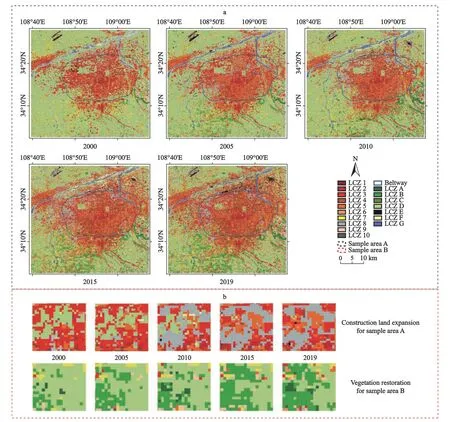
Fig.4 Spatiotemporal distribution characteristics of LCZs (local climate zones) in Xi’an metropolitan area,China in 2000-2019.(a) represents the LCZs spatiotemporal transition of the entire study area;(b) is partial enlargement for two regions,i.e.,construction land expansion and vegetation restoration,respectively.Meanings of LCZ 1-10 and A-G see Fig.3
3 Results
3.1 Spatiotemporal evolution characteristics of LCZs and LST
3.1.1 Spatiotemporal characteristics changes of LCZs
The LCZs mapping results show a gradual transition from dispersion to aggregation in the distribution of building type LCZs (Fig.4a).Before 2010,compact buildings (LCZ 2 and LCZ 3) were scattered in large numbers and near the beltway.After 2010,this area was gradually replaced by LCZ 5 (open mid-rise) and LCZ 4(open high-rise),forming a clear open building cluster.LCZ 7 (lightweight low-rise) was more evenly scattered outside the beltway,and its number and scale had been gradually decreasing over time.LCZ 8 (large low-rise)was mainly located in the western and northeastern parts of the beltway,LCZ 8 (Fig.4a) in the above two areas was mostly warehouses and logistics sites,located near the highway to facilitate the transportation of goods,and both areas had shown significant expansion around the beltway since 2010.Since 2015,the central city of Xi’an gradually showed a near-ring-like distribution pattern of‘compact mid-rise,open mid-rise,open high-rise’ from the inside to the outside.Meanwhile,the LCZ of build types within the beltway increased from 67.50% in 2000 to 92.95% in 2019.The expansion of construction land was mainly ‘east-west’ direction,crossing the Bahe River to the east and extending toward the Lintong District.To the west,it connects to the city of Xianyang,showing a clear phenomenon of twin-city integration.
The land cover type LCZs in the study area are concentrated in the area outside the beltway.Affected by the policy of returning farmland to forest,most of LCZ D (low plants) was gradually replaced by LCZ B(scattered trees) in the south resulting in a significant increase in the LCZ B area (Fig.4b).LCZ D,on the other hand,is also encroached by construction land,resulting in a drastic decrease in its spatial land area.A more pronounced spatial growth in LCZ E (bare rock or paved)in the north of the study area,which was mainly a large area of paved road in the main railroad line concentrated near the railroad station and the entrance/exit area of the highway.The changes in the spatial distribution of remaining land cover type LCZs were not prominent.
The LCZs types changed significantly in 2000-2019(Fig.5),958.35 km2 of urban space in the study area were transformed (Table S3-S7),with a total conversion rate of 48.71% in 2000-2019.Besides,the LCZs conversion rates of 2000-2005,2005-2010,2010-2015,and 2015-2019 were 26.92%,32.08%,36.63%,and 27.73%,respectively.The trend of LCZs evolution is manifested in the continuous expansion of built types and the sustained reduction of land cover types.The percentage of built type LCZs increases year by year,from 38.19% in 2000 to 60.02% in 2019,and the spatial morphology of the city develops toward higher construction intensity.In 2000-2019,open buildings (LCZ 4,LCZ 5) and large low-rise (LCZ 8) show a significant growth trend,reaching 438.33 km2 and 108.97 km2,respectively.At the same time,the proportion of some old building sites gradually decreased,and both compact buildings (LCZ 2,LCZ 3) and light low-rise buildings (LCZ 7) showed an overall decreasing trend,decreasing by 97.55 km2 and 72.55 km2,respectively.The continuous expansion of urbanization has also greatly changed the structure and quantity of land cover types,the decrease of LCZ D (low plants) was particularly prominent,transferring out 505.92 km2 in 2000-2019,which accounts for 1/4 of the study area.Xi’an City undertook the national reforestation project since 1998,so the area of artificially planted sparse vegetation (LCZ B) showed a significant growth pattern,increasing from 23.71 to 111.86 km2 in 2000-2019,with a growth rate of 9% (Economou et al.,2021).

Fig.5 Conversion characteristics of LCZs (local climate zones) types in Xi’an metropolitan area,China in 2000-2019.Specific meanings of LCZ could be found in Fig.3
3.1.2 Spatiotemporal characteristics changes in LST
The spatial distribution showed that the LST presented a characteristic change of overall increase and then local prominence (Fig.6).Referring to Fig.4,the LST of the built type LCZs exhibit generally high temperature,while the obvious low-temperature zones were mainly composed of LCZ A (dense trees),LCZ B (scattered trees),and LCZ G (water).The high-temperature zones in the study area gradually extended outward from the two urban centers of Xi’an and Xianyang during 2000-2010,and the whole study area showed a generalized high-temperature phenomenon.During 2010-2019,the local high temperature phenomenon was significant,mainly in the north and west,and these zones were mainly LCZ 8 (open low-rise),whose building materials had strong reflectivity and fast heat absorption,resulting in particularly high LST (Zhang et al.,2022).The southeastern part of the study area throughout the study period as well as the eastern part of the study area in 2000 and the southern part of the study area in 2010 showed a local high temperature phenomenon,mainly influenced by the lower specific heat capacity and higher albedo of fallow farmland and bare ground.Under the fallow farming policy,the high-temperature regions in the east and south of the study area showed a trend of decreasing after 2010.In 2000,the population and buildings were concentrated in the city center,leading to prominent LST in the main urban area.The influx of more people into the city and the outward expansion of the city in 2005 was accompanied by an increasing density of built-up land in the central area,the built type LCZs area has increased by 114.29 km2compared to 2000,leading to a general increase in LST in the central city.In 2013,Xi’an started the work of creating a national forest city,so that the high temperature in the strand of the city center has been relieved to some extent.
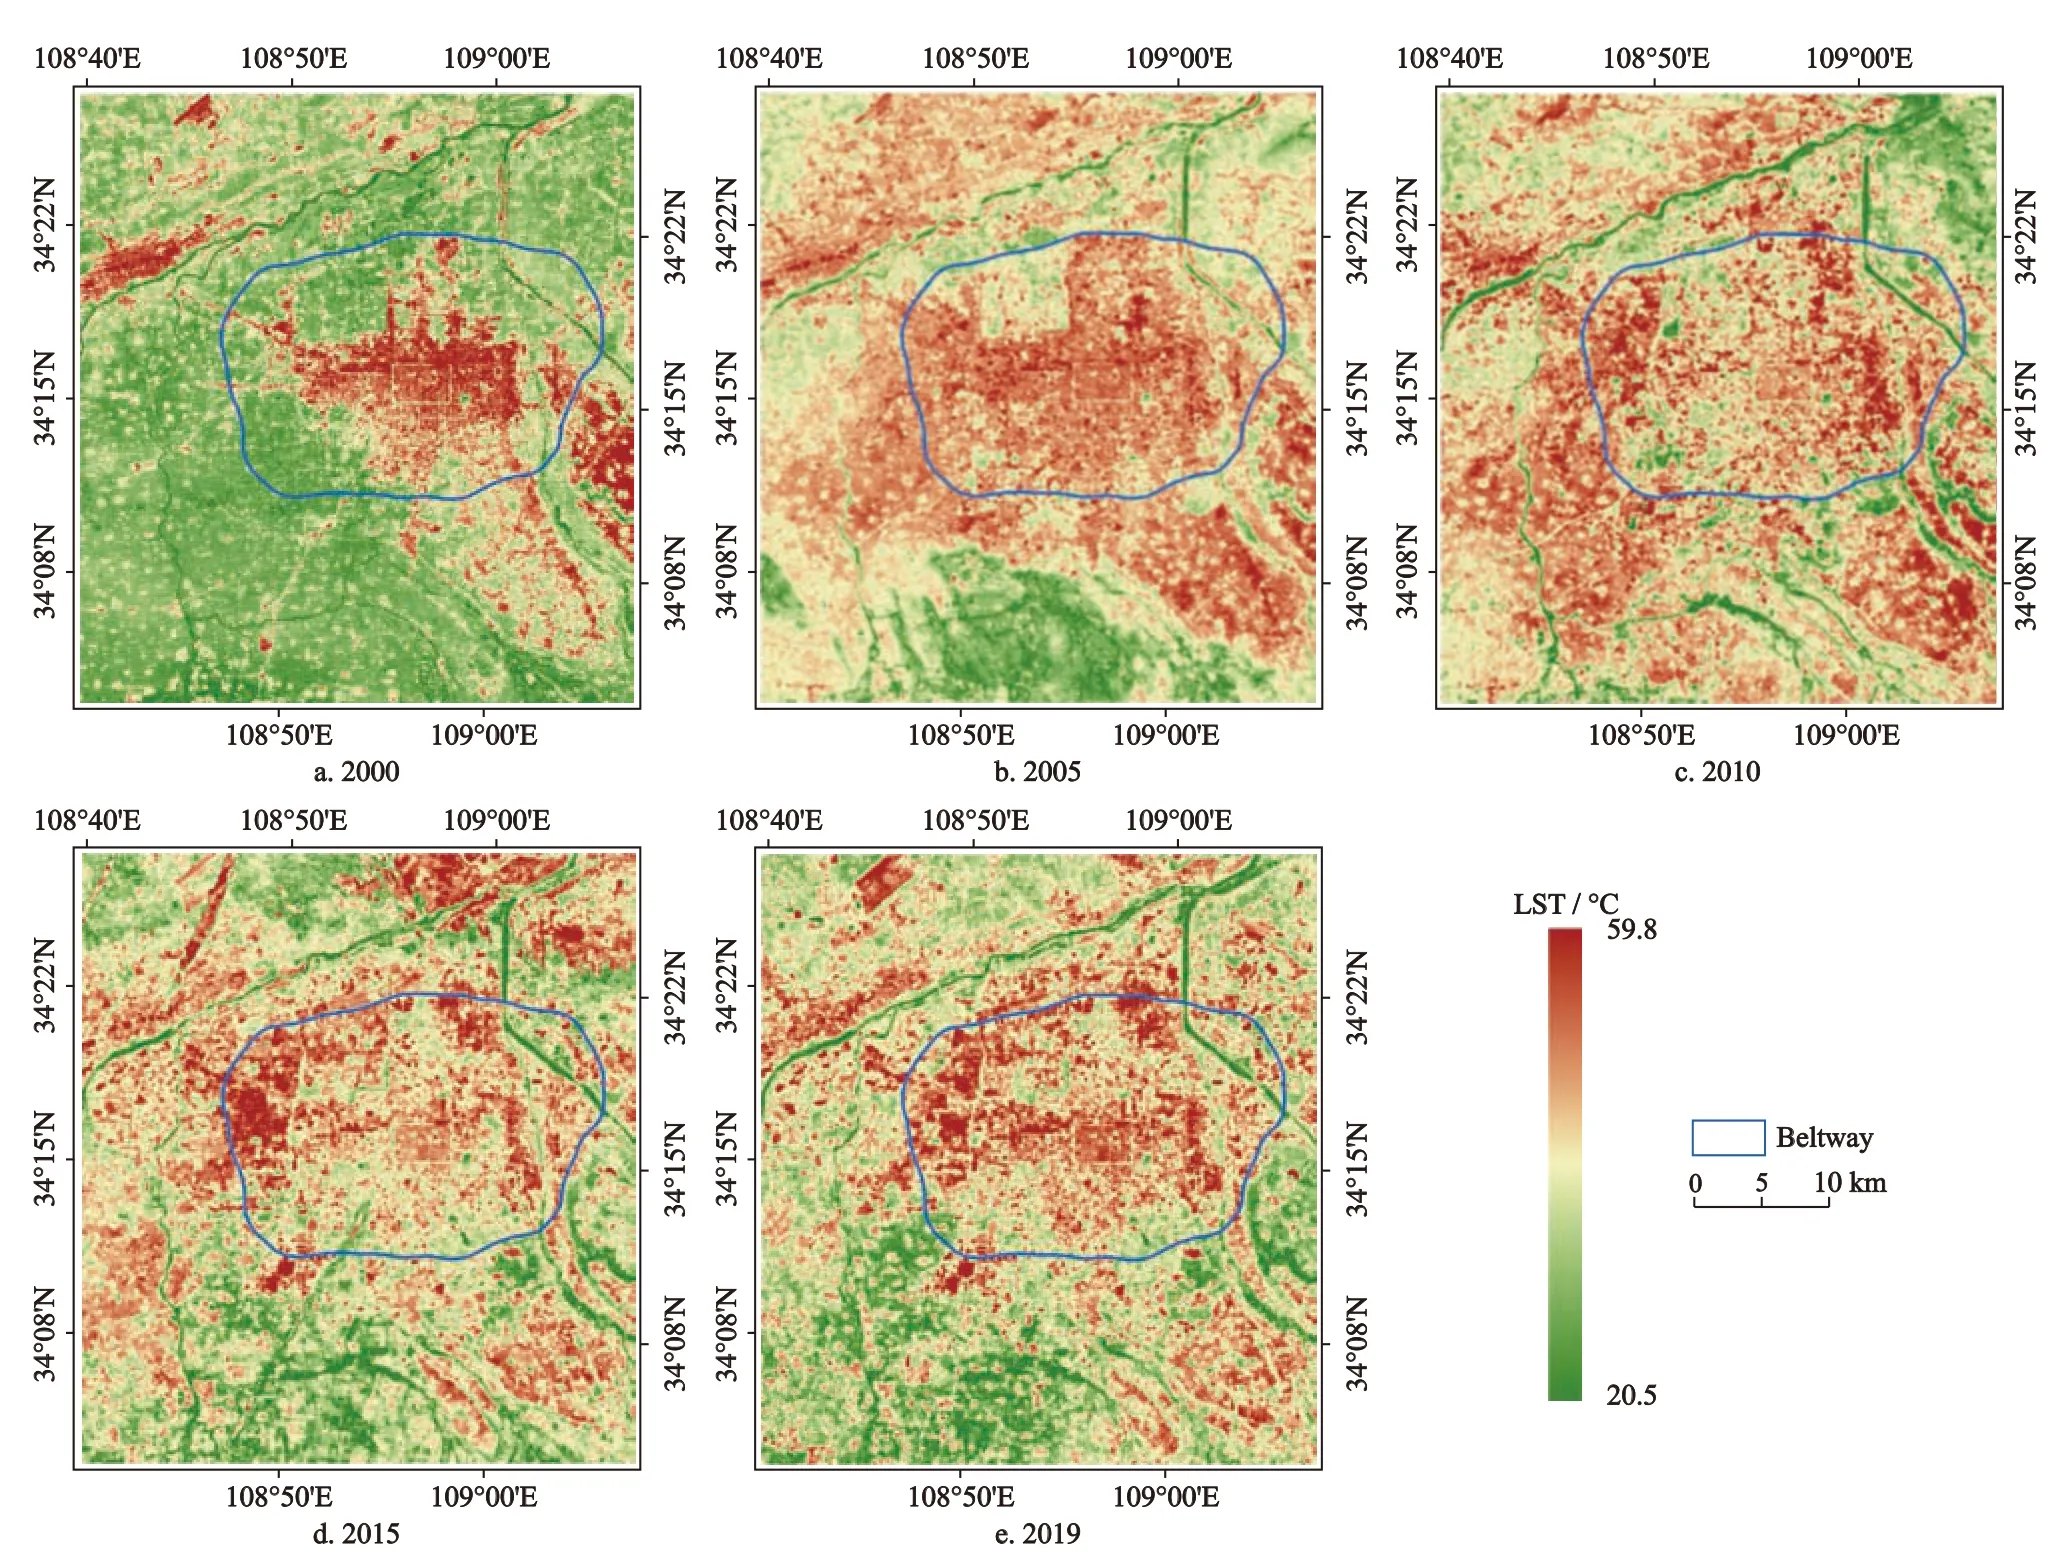
Fig.6 Spatial distribution characteristics of LST (land surface temperature) in Xi’an metropolitan area,China in 2000-2019
3.2 LST characteristics between LCZs
3.2.1 LST characteristics of LCZs
The box plot statistics show that the LST of built type LCZs were generally higher than that of land cover type LCZs in 2000-2019 (Fig.7).And the LST of each LCZ showed an increasing trend,with the fastest average LST growth in LCZ 8 (large low-rise),LCZ 3 (compact low-rise),and LCZ E (bare rock or paved),with increases of 10.69°C,10.57°C and 9.82°C,respectively.While LCZ A (dense trees),LCZ G (water) and LCZ B(scattered trees) show relatively slow LST growth of 4.92°C,4.38°C and 4.20°C,respectively,the relatively more prominent and rapid increase in the built type LCZs.The LCZ types with the highest mean LST in 2000,2005,2010 and 2019 were LCZ 2 (32.83°C),LCZ 2 (33.79°C),LCZ 8 (33.97°C),LCZ 8 (40.36°C),LCZ 8(42.83°C),and the LCZ types with the lowest mean LST were LCZ G (30.12°C),LCZ A (29.61°C),LCZ G(29.58°C),LCZ A (32.71°C),and LCZ A (34.50°C).The compact mid-rise and large low-rise show a more pronounced high temperature phenomenon,while the blue-green space becomes the low temperature center of the city.The LST of LCZs increased the fastest during the period 2010-2015,with the mean LST of LCZ E(bare rock or paved) increasing the most significantly to 7.03°C,while LCZ A (dense trees),which warmed the least,also increased by 2°C.This coincides with the period of the fastest transition of LCZs mentioned in Section 3.1.1,indicating a temporal consistency between the significant changes in LCZs during urbanization and the rapid rise in LST.
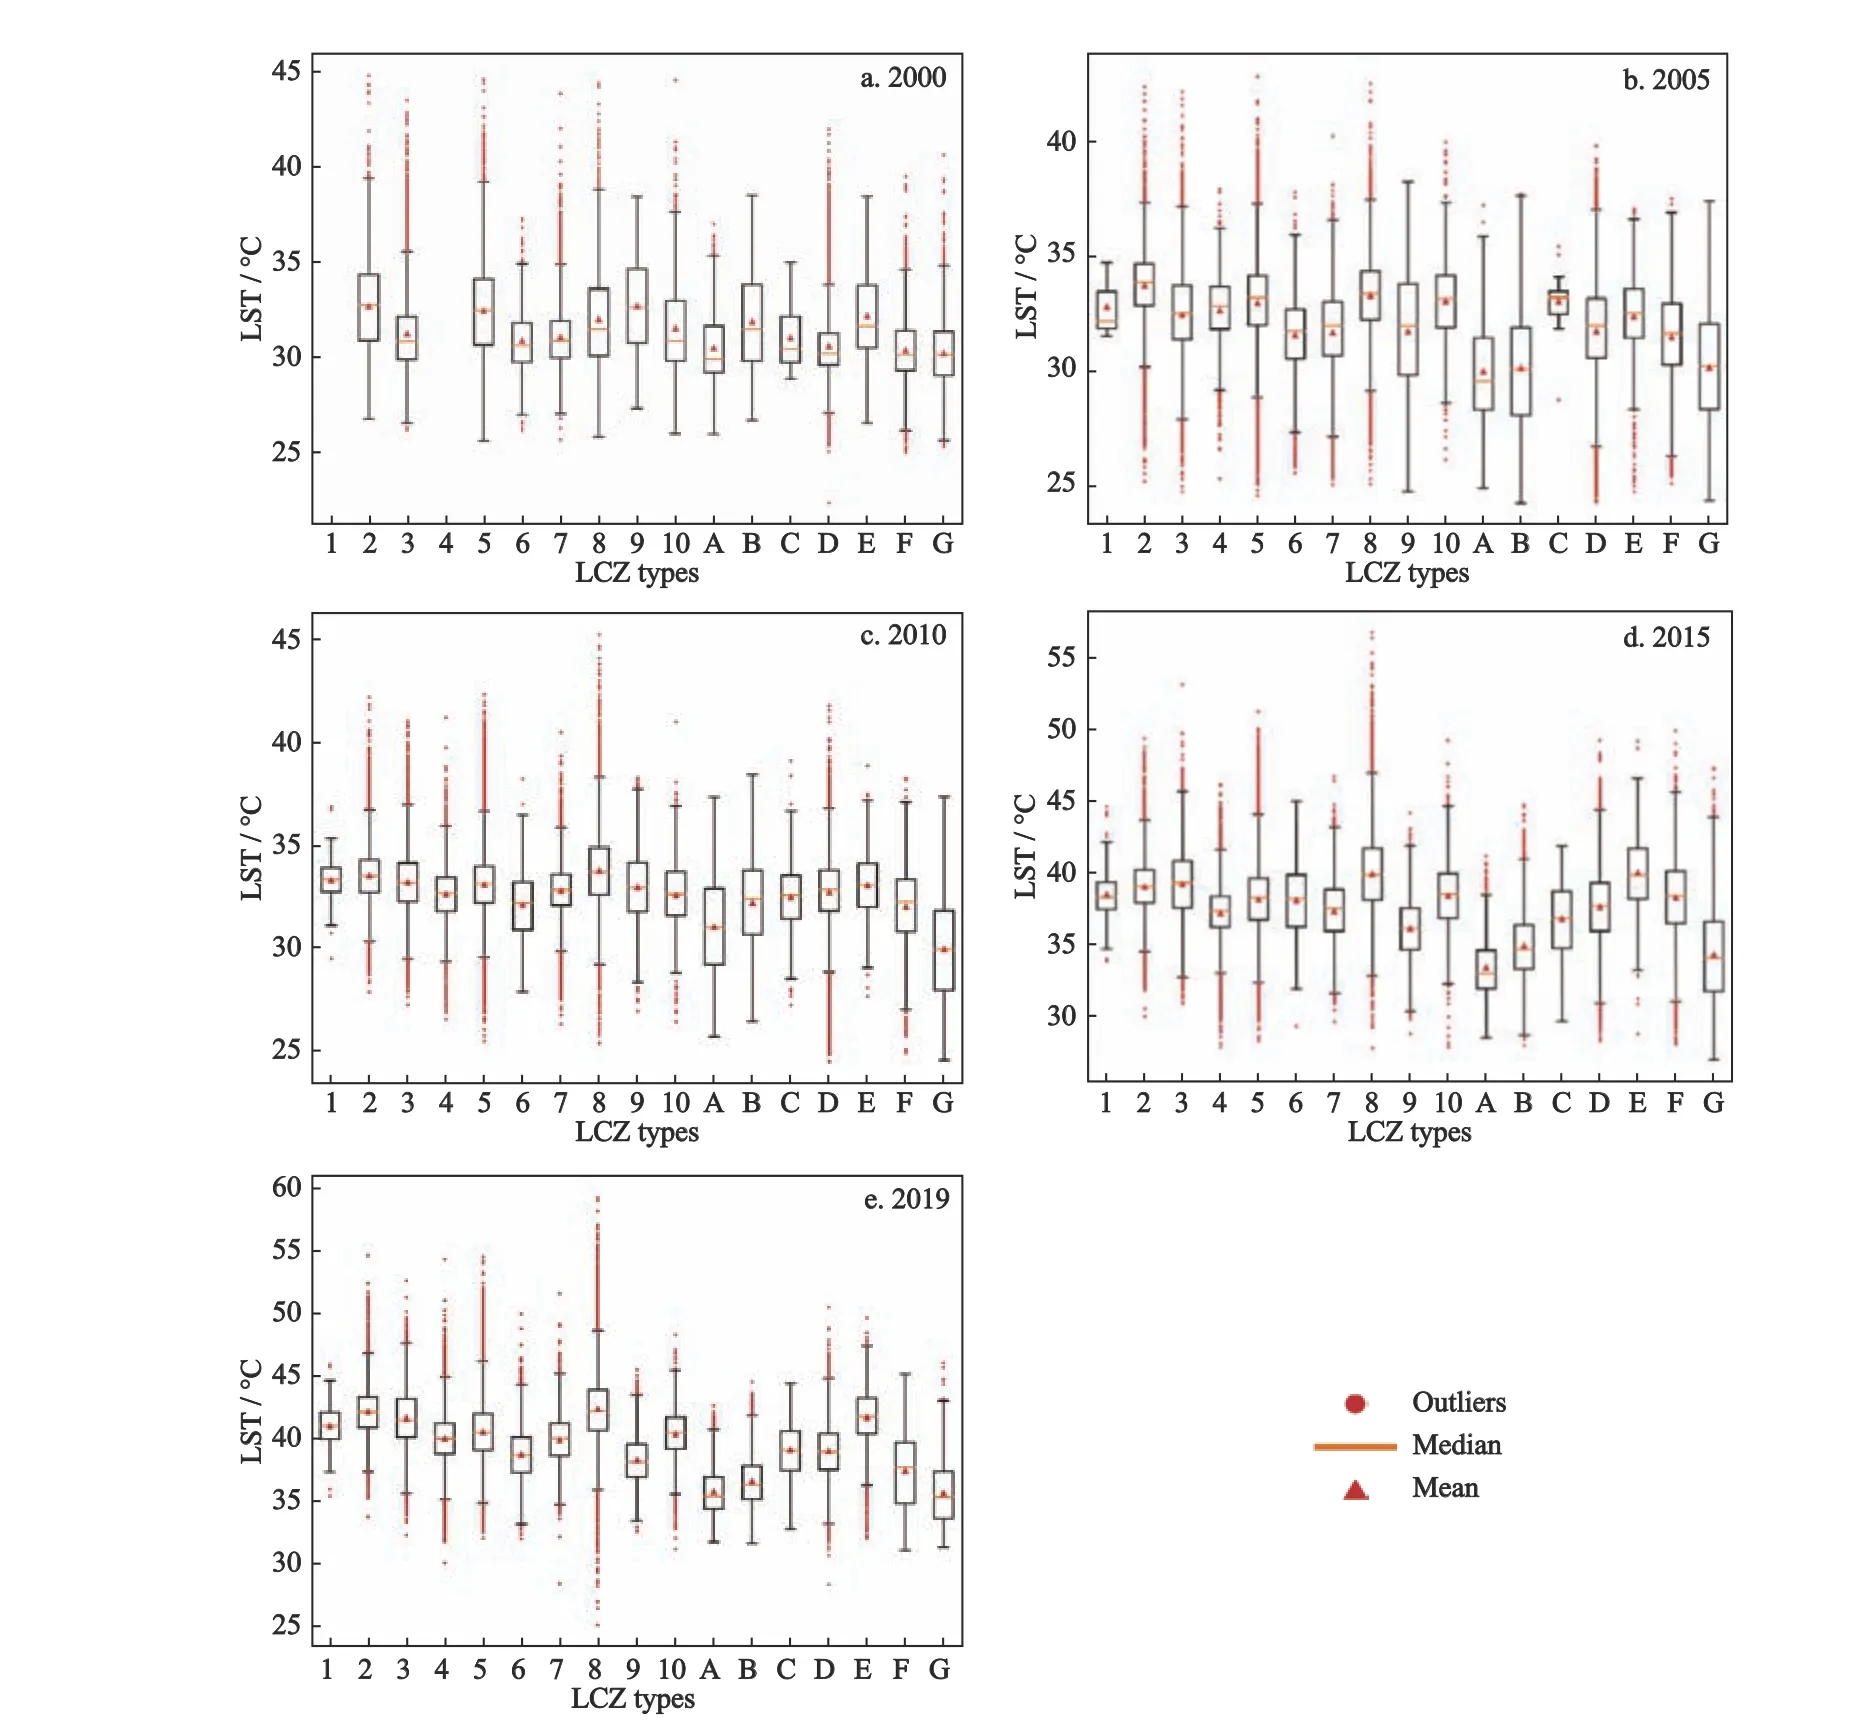
Fig.7 Characteristics of LST (land surface temperature) in different LCZs (local climate zones) types in Xi’an metropolitan area,China in 2000,2005,2010,2015,2019.Specific meanings of LCZ could be found in Fig.3
Fig.8 calculated the average LST of each LCZ for 19 yr,and the results showed that the average temperature of the built type LCZs is generally higher than that of the land cover type LCZs.The average temperatures of them were 35.41°C and 33.59°C,respectively,and the built type LCZs were the main contributors to LST.Among the built type LCZs,compact building zones(LCZ 1,LCZ 2,LCZ 3) had higher values of LST than open building zones (LCZ 4,LCZ 5,LCZ 6),and the average values of LST of them were 36.07°C and 35.04°C,respectively.The compact building zones had tighter spatial structures,which lead to heat accumulation and high-temperature aggregation.The LST of both LCZ 7 (lightweight low-rise) and LCZ 9 (sparsely built)were relatively low,34.71°C and 34.25°C,respectively,which were low and scattered with sparse vegetation.LCZ 8 (open low-rise) with good reflective properties metal roof (Zhang et al.,2022),so it had the highest LST of 36.53°C,which was 1.12°C above the average LST of the built category.LCZ 10 (heavy industry) had a high energy consumption and was usually also an area of urban heat build-up with a high LST (35.25°C).
The differences of LST among land cover type LCZs were relatively greater,with the average LST for LCZ A(dense woods),LCZ B (scattered woods),and LCZ G(water) were 31.70°C,32.92°C,and 31.44°C,respectively,which usually made green areas and water bodies‘cold islands’ in cities due to the low absorption of solar radiation by these surfaces.LCZ E (bare rock or paved),which was made of concrete with a low heat capacity,had the highest average LST of 36.04°C.LCZ C(bush,shrub),LCZ D (low vegetation/farmland),and LCZ F (bare soil or sand) had LSTs of 34.55°C,34.36°C,and 34.15°C,respectively.Because LCZ C and LCZ D had less vegetation cover,the LST of both were close to bare ground.In contrast,the bare land in this study was mainly river floodplains near rivers,resulting in relatively low LST of LCZ F.In general,the LST of various types of LCZs was influenced by anthropogenic activities,cover type,and energy consumption.
3.2.2 LST changes caused by LCZs conversion
To enhance the comparability of LST changes in different periods and reduce the uncertainty caused by objective factors such as sensed time of images,the study normalized the LST data (Fig.9).The results showed that the transitions of LCZ types generally caused in an increase in LST.In 2000-2019,the LST increase caused by LCZs conversion from built and land cover types to other types are 0.21 and 0.19,respectively.Besides,we found that the LCZs conversion from land cover types to built types does not necessarily cause an increase in LST,for example,a cooling was observed during the conversion from LCZ B (scattered trees) to LCZ 4 (open high-rise) in 2000-2005.In contrast,an increase in surface temperature also occurred during the LCZs conversion from built type LCZs to the land cover types,for example,a temperature increased by 0.02 after the conversion from LCZ 6 (pen low-rise) to LCZ D (low plants) in 2005-2010.Therefore,the temperature change does not only depend on the LCZ types but also the temperature difference between the transferred out LCZs and the transferred in LCZs.Totally,the incremental LST transferred to built type LCZs and land cover type LCZs reached 0.22 and 0.18 in 2000-2019,respectively.In particular,there was a significant cooling effect during the early conversion to LCZ 1.Overall,LST warming was more pronounced in the built type LCZs during the transferred in process,while the LST increased relatively slowly in the land cover type LCZs.

Fig.9 LST (land surface temperature) changes caused by LCZs (local climate zone) shifts in Xi’an metropolitan area,China in 2000-2019.Nodata denotes LCZ pairs where no transformation occurred.The vertical axes of (a) and (e) are missing high-rise building types LCZ 1 and LCZ 4 due to their absence in 2000.Specific meanings of LCZ could be found in Fig.3
4 Discussion
4.1 Profile analysis of two adjacent cities
It is great spatial heterogeneity in LST from rural to urban (Cao et al.,2021),but this difference has changed significantly with urban expansion.To investigate the changes in LST caused by the transformation of urbanrural spatial morphology brought about by urban development,this paper selects the profile line through the urban centers of Xianyang and Xi’an and ending in the eastern mountains of Xi’an (Fig.1b),and plots the changing characteristics of LCZs and LST along the line(Fig.10).The profile LST exhibits a yearly increase,with roughly similar trends and a temperature difference of about 5°C between 2010 and 2019,but a significantly different trend in 2000.Moreover,the low temperature troughs appeared more frequently in 2000,but the high temperature peaks were more prominent in 2019,indicating that the local high temperature phenomenon became more significant,the finding is consistent with existing studies (Han et al.,2022).Also,the temperature difference between the peaks and troughs in the profile is greater over time,with the maximum temperature difference rising from 13.65°C in 2000 to 18.04°C in 2019,indicating more dramatic fluctuations in LST.The city continues to expand and the distance between urban centers and suburbs is shrinking,showing a trend of urban-rural integration,which is an important reflection of the integration of urban expansion in Xi’an and Xianyang (Xu et al.,2018).

Fig.10 LST (land surface temperature) profile of Xi’an-Xianyang in China in 2000,2010 and 2019.Specific meanings of LCZ could be found in Fig.3
There exists coupling relation between urban horizontal expansion and urban vertical profile,i.e.,the increase in building height,the decrease in the proximity of urban centers,and the increase in urbanization intensity show some synchronization (Yang and Zhao,2022).In parallel with the outward expansion of Xi’an,the construction within the city has led to vertical intensification,resulting in an increasing number of compact and high-rise urban living spaces,the same phenomenon has been seen in Guangzhou City in Guangdong Province(Chen et al.,2023),Wuhan City in Hubei Province (Cao et al.,2022) and other cities (Wang et al.,2022) in China.Research shows that the rapidly growing,highdensity,government-led polycentric urban morphology is a characteristic of Chinese cities (Engelfriet and Koomen,2018).The LST of the built type LCZs are usually higher,with LCZ 2 and LCZ 8 being particularly prominent,while the land cover type LCZs exhibit a cooling effect and present a more pronounced cooling effect the further away from the urban center (Yang and Zhang,2020).In Fig.10,the eastern mountainous cultivated land (LCZ D) shows a better cooling effect than the scattered trees in the urban center (LCZ B),and the periurban cooling effect of the Weihe River (LCZ G) is also significantly stronger than that of the moat in the urban center (LCZ G),although the size of the river may also affect this.The transfer from LCZ D to LCZ 2 is the process of LST trough to wave peak,the construction land occupying the natural surface shows a significant warming phenomenon.The LST of LCZ 2 (left) is lower in 2010 and higher more than 3°C in 2019 compare with LCZ 2 (right),which may be caused by the rapid increase of building density around LCZ 2 (left).
4.2 Thermal environment optimization strategy from LCZs perspective
Differences in the internal structure of LCZs contribute to the spatial heterogeneity of LST (Yang et al.,2019),with compact LCZs having significantly higher LSTs than open ones due to high density and weak circulation (Ren et al.,2022).While the proportion of compact buildings (LCZs 1-3) in the study area decreased from 13.97% in 2000 to 9.12% in 2019,the proportion of open buildings (LCZs 4-6) increased from 10.23% to 34.23%.Although the reduction in compact buildings and a significant increase in open buildings,more unused land in the city is being utilized and converted into building land,which leads to an increasing density of impervious surfaces and a rising LST in the inner city.Although both LCZ A and LCZ B in the study area showed an increase of 0.39% and 4.48%,respectively,the vegetation was not good enough to mitigate the high temperature in the inner city,as it was mainly distributed in the suburbs (Gao et al.,2022).However,a decrease in LST occurred after the conversion of LCZ B(scattered trees) to LCZ 4 (open high-rise) in 2000-2005,Ren et al.(2022) suggested that it may be that LCZ 4 provides a larger area of shade,reducing the exposed area.There is also a phenomenon of LST increase when the built type LCZs are converted to land cover type LCZs,and the phenomenon is more obvious in the conversion to LCZ E (bare rock or paved) and LCZ F (bare soil or sand),when the partially open middle/high-rise are converted to natural LCZs the LST also increase,which is also greatly affected by shadows and ventilation.Wang et al.(Wang et al.,2022) studied SUHI for several major cities in China and found that Xi’an has the most significant SUHI in summer.In summary,Xi’an metropolitan has a severe form of thermal environment,and LST mitigation needs to be planned and regulated from several aspects.
Firstly,since the LST of compact low and middle-rise buildings is significantly higher than that of open buildings,Wu et al.(2022) found that most of these compact low and middle-rise are urban villages,which are densely populated areas with compact buildings and very uninhabitable.Therefore,compact LCZs can be converted into open LCZs to avoid the successive emergence of high-density class LCZs (Hecht et al.,2020).For a reasonable spatial layout,the phenomenon of satisfying the number of housing and alleviating the urban heat effect can be achieved by strengthening the vertical height and increasing the shaded surface while reducing the spatial density (Ren et al.,2022).However,since the current compact buildings covering 179.20 km2 are not likely to be demolished in a large area within a short time,local spatial morphology optimization can be carried out for some compact areas where spatial morphology transformation is not possible,and street trees,green roofs and green walls can improve the evapotranspiration and shading effects of compact LCZs(Kotharkar et al.,2020).Secondly,vegetation (LCZ A,LCZ B) and water (LCZ E) show obvious cooling effects,but because their spatial layout is mostly at the periphery of the city does not well mitigate the heat effect inside the city,so the local cooling effect can be achieved by optimizing the spatial layout of the city and building blue-green spaces inside the city (Li et al.,2022).And the construction of ventilation corridors can be strengthened to connect various blue-green spaces through ventilation corridors to enhance spatial connectivity and increase the cooling effect while mitigating atmospheric pollution (Chen et al.,2022;Fang and Zhao,2022).Finally,especially heavy industries with high surface thermal intensity of heat consumption and heat production (LCZ 10) and contiguous large low-rise buildings (LCZ 8) greatly enhance the urban thermal effect,so they can be considered to relocate away from the built-up areas and reduce the aggregation to mitigate the local high temperature phenomenon,and they can be placed downwind of the city to reduce the impact on the urban thermal environment (Newman et al.,2018).In addition,some studies have found that by increasing the albedo of urban surfaces is a more effective way to mitigate the urban thermal environment,due to the negative impact of higher vegetation cover on urban ventilation (Zheng et al.,2022).
4.3 Limitations and future research
The paper still has some limitations in the current study of this paper.Firstly,the classification accuracy of LCZs 2000 in this paper is limited by the coverage of high-resolution Google images,which causes low classification precision.And the RS-based LCZs classification uses the thermal infrared band of the satellite may have an uncertain effect on the relationship between LCZs and LST.The subsequent combination of GISbased classification methods can be considered to improve the accuracy.Secondly,this paper only considers the effect of LCZs shift on LST,while ignoring factors such as population,traffic,climate,and energy consumption,which makes the research results have some limitations.We can consider building an integrated model with various types of data to reflect the effect of LST change.Thirdly,there is a temporal inconsistency between Google images and Landsat images,but the existence of this inconsistency is unavoidable at this time.To solve this problem in the future,high-precision satellites with higher temporal resolution need to be developed.Finally,only summer LSTs were explored in this paper.In the future,both seasonal LCZ plots and seasonal LSTs should be considered to explore seasonal variations in LST for different LCZ types.
5 Conclusions
This paper mainly explores the characteristics of spatial and temporal dynamics of LCZs and LST in the Xi’an metropolitan area,the heterogeneity of spatial distribution,the change of LST caused by LCZs shift,and the integration process of Xi’an-Xianyang LST.The results show that:
(1) A spatiotemporal consistency between the transformation of LCZs and the increase of LST,the period of the largest LCZs conversion reached 36% also the fastest rise in LST to 4.87°C in 2010-2015.The spatial expansion of LCZs is mainly along the east-west direction,and the spreading of LSTs is similar.Specifically,the land cover type LCZs are mainly distributed outside the beltway,and the built type LCZs gradually expand outward from the beltway from 38.19% in 2000 to 60.02% in 2019,leading to the continuous shrinkage of the land cover type LCZs and the spatial morphological turnover of the city toward higher construction intensity.The LST also rises with the continuous in-filling and outward expansion of the LCZs,showing the spatiotemporal evolutionary characteristics of first overall warming(2000-2010) and then local prominence (2015-2019).
(2) The LST difference between the built type LCZs and the land cover type LCZs gradually expanded in 2000-2019.The built type LCZs such as compact buildings and colorful steel houses warm up rapidly as urban heat centers (LCZs 1-2,LCZ 8),while vegetation and water bodies in the land cover type LCZs warm up slowly (LCZs A-B,LCZ G) become urban cool centers.Compared to the change of LST during the conversion of land cover type LCZs,LST rise was more pronounced in built type LCZs transferred in and out process.
(3) The Xi’an-Xianyang profile reveals a more frequent occurrence of high-temperature waves in 2000-2019,indicating more significant localized high temperatures in the city.At the same time,the temperature difference between high-temperature peaks and low-temperature troughs is also increasing,showing the spatial heterogeneity of the urban thermal environment more pronounced.The rise of LST in the intercity suburban areas and the increase of built type LCZs during the continuous outward expansion of the two cities indicate the occurrence of twin-city integration.For the future development of the metropolitan area,we should closely rely on the cities of Xi’an and Xianyang,coordinate urban and rural resources to strengthen interaction and cooperation with the surrounding areas,and promote the harmonious development of the Xi’an metropolitan area.
Supplementary
Table S1-S7 could be found at http://egeoscien.neigae.ac.cn/cn/article/2023/5.
Conflict of Interest
The authors declare that they have no known financial interests or personal relationships that may affect this paper report.
Author Contributions
ZHANG Liping: conceptualization,methodology,writing-original draft preparation,visualization;ZHOU Liang: conceptualization,writing-review and editing;YUAN Bo: conceptualization,writing-review and editing;HU Fengning: writing-review and editing;ZHANG Qian: review and editing;WEI Wei: writing-review and editing.
 Chinese Geographical Science2023年6期
- Chinese Geographical Science的其它文章
- Variations in Surface Urban Heat Island and Urban Cool Island Intensity: A Review Across Major Climate Zones
- Impact of the Urban Heat Island Effect on Ozone Pollution in Chengdu City,China
- Cross-border Urban Networks Based on Manufacturing Global Value Chain: A Study of Listed Companies in Western China
- Spatiotemporal Differences and Classification Regulation of Urbanization Impact on Agricultural Development in Shrinking Areas: A Case Study of 15 Shrinking Cities in Three Provinces of Northeast China
- Leave or Stay? Antecedents of High-level Talent Migration in the Pearl River Delta Megalopolis of China: From a Perspective of Regional Differentials in Housing Prices
- Spatial Distribution Pattern and Influencing Factors of Physical Bookstores of Large Cities: A Case Study of Three National Central Cities in Western China