
Extracting water body data based on SDWI and threshold segmentation: A case study in permafrost area surrounding Salt Lake in Hoh Xil,Qinghai-Tibet Plateau,China
2024-01-02 14:41QingSongDuGuoYuLiDunChnShunShunQiYuZhouFiWangYaPngCao
QingSong Du ,GuoYu Li,* ,Dun Chn ,ShunShun Qi ,Yu Zhou ,Fi Wang ,YaPng Cao
a State Key Laboratory of Frozen Soil Engineering, Northwest Institute of Eco-Environment and Resources, Chinese Academy of Sciences, Lanzhou, Gansu 730000, China
b Da Xing'anling Observation and Research Station of Frozen-Ground Engineering and Environment, Northwest Institute of Eco-Environment and Resources, Chinese Academy of Sciences, Jagdaqi, Heilongjiang 165000, China
c University of Chinese Academy of Sciences, Beijing 100049, China
d School of Civil Engineering, Fujian University of Technology, Fuzhou, Fujian 350118, China
e Faculty of Civil Engineering and Mechanics, Jiangsu University, Zhenjiang, Jiangsu 212013, China
Keywords:Permafrost region Water body extraction Salt Lake in Hoh Xil Qinghai-Tibet Plateau Sentinel-1 Ecological environment impact Disaster prevention and mitigation
ABSTRACT There are a large number of lakes,rivers,and other natural water bodies distributed in the permafrost area of the Qinghai-Tibet Plateau (QTP).The changes in water bodies will affect the distribution of water resources in surrounding areas and downstream areas,resulting in environmental impact and bringing potential flood disasters,which will induce more serious issues and problems in alpine and high-altitude areas with a fragile habitat(such as the QTP in China).Generally,effective,reasonable,and scientific monitoring of large-scale water bodies can not only document the changes in water bodies intuitively,but also provide important theoretical reference for subsequent environmental impact prediction,and disaster prevention and mitigation in due course of time.The large-scale water extraction technology derived from the optical remote sensing (RS) image is seriously affected by clouds,bringing about large differences among the extracted water result products.Synthetic aperture radar(SAR)RS technology has the unique advantage characteristics of all-weather,all-day,strong penetration,and not being affected by clouds,which is hopeful in extracting water body data,especially for days with cloudy weather.The data extraction of large-scale water bodies based on SAR images can effectively avoid the errors caused by clouds that become prevalent at present.In this paper,the Hoh Xil Salt Lake on the QTP and its surrounding five lakes are taken as the research objects.The 2-scene Sentinel-1 SAR image data covering the whole area on 22 August 2022 was used to verify the feasibility of extracting water body data in permafrost zones.Furthermore,on 22 August 2022,the wealth here was cloudy,which made the optical RS images, e.g.,Sentinel-2 images full of clouds.The results show that: using the Sentinel-1 image and threshold segmentation method to extract water body data is efficient and effective with excellent results in permafrost areas.Concretely,the Sentinel-1 dualpolarized water index (SDWI),calculated by combining dual vertical-vertical (VV) polarized and vertical-horizontal (VH) polarized data is a useful index for water extraction and the result is better than each of the VV or VH polarized images.
1.Introduction
Due to extreme cold and high-altitude characteristics,the Qinghai-Tibet Plateau (QTP) has developed a wide range of typical periglacial geomorphologies such as permafrost,ground ice,rock glaciers,snow cover and glaciers (Qinet al.,2016;Chenget al.,2019;Duet al.,2020;Chenet al.,2021).At the same time,a large number of lakes and rivers are distributed on the ground surface.The QTP is known as the "Third Pole" on the earth (except the South Pole and the North Pole) and the"Asia's Water Tower",namely it is the birthplace of a large number of major rivers in Asia(Wanget al.,2019;Chenet al.,2021;Anet al.,2022),e.g.,Yangtze,Yellow,Indus,Ganges,Irrawaddy,Brahmaputra,Salween and Mekong rivers(in China also called the Lancang River)(Dinget al.,2022).In recent years,with the effect of global climate warming,a large number of glaciers and permafrost have shown degeneration (Duet al.,2020),which promotes the transformation from solid water into liquid water.The subsequent continuous changes in surface runoff,lakes,and other water bodies will not only bring about a series of subsequent environmental impacts and damage the local ecology,but will also alter the redistribution of water resources.In addition,the sudden volume increase of lake water bodies will lead to the risk of lake breakwater or breakout and bring potential flood disasters to downstream areas (Huet al.,2021b;Zhanget al.,2021;Dinget al.,2022).Therefore,reasonable,effective,and scientific large-area water monitoring is of great significance for understanding water body changes and disaster prevention and mitigation.
At present,the most common and widely used monitoring technology for large-area lake changes is remote sensing based on visible spectrums.Spatial medium high-resolution remote sensing data,such as Moderate Resolution Imaging Spectroradiometer(MODIS),Landsat and Sentinel-2 have more spectral information containing the information of ground objects.By building spectral indices,e.g.,the normalized difference water index,NDWI (McFEETERS,1996),water body information can be quickly extracted.These are widely used in large-area lake monitoring,such as Qinghai Lake (Niuet al.,2003),Dongting Lake (Liet al.,2009),and Erhai Lake(Biet al.,2018).In addition,NDWI data can be processed by threshold segmentation method,target recognition approach,or other technologies (Liet al.,2018;Jiaet al.,2019;Guoet al.,2021),and the results of water extraction data can be further modified and optimized to ensure the accuracy of the products.However,owing to the vulnerability attributes influence of the optical RS,which generates images based on reflected light,called passive RS,it is greatly affected by clouds and can only work effectively in the daytime (Zhao,2013),which brings some uncertainty and error to the results of extracting water body data.To understand the change in lakes,time-intensive monitoring based on optical RS images is common.If the weather is cloudy,the results are missing.Although current cloud removal technology has advanced and is excellent,it has been the pursuit of scientific researchers to extract water directly from RS images that are not affected by clouds.In addition,with the limitation of the revisit period,fewer images can be effectively used to extract water body data for unique areas.
Thanks to the development of synthetic aperture radar technology(SAR),numerous SAR satellites have been launched,with data mining from SAR image data becoming increasingly important in the RS research field.In particular,Interferometric Synthetic Aperture Radar (InSAR)technology is widely used in various research communities,e.g.,surface deformation monitoring,seismic deformation field reconstruction,volcano monitoring,and landslide monitoring.SAR is an active microwave remote sensing technology,with a microwave wavelength range from 1 mm to 1 m,with certain penetration(Miao and Liu,2013).Therefore,SAR remote sensing technology has characteristics of all-weather,all--day,and not affected by clouds(or minimal interference compared with optical RS) (Huet al.,2021a),which makes it possible to extract water information through RS without being influenced by clouds.SAR images contains not only intensity information closely related to ground objects but also phase information closely related to the distance of the ground objects,which is unique and different from optical RS products.At present,the popular InSAR technology is based on phase information for data mining.Although some scholars have analyzed and utilized SAR intensity information through the polarimetric SAR(PolSAR)technology(Zhanget al.,2015),there are relatively few studies on mining intensity information and promoting its application compared with the development of InSAR.
Based on the above description,this paper takes the Sentinel-1 SAR image as the data source and considers Salt Lake in Hoh Xil and its surrounding areas,including another five lakes on the QTP as the study area.We combine the Sentinel-1 dual-polarized water index (SDWI) and threshold segmentation approach to extract water body data and test the practicability in permafrost regions.This case study can resolve the issue of special days with cloudy weather or unavailable for the optical image,while SAR images are available for water extraction data.Furthermore,it can promote the application scope and research area of SAR,provide scientific,reliable,and accurate basic references for follow-up work including ecological environment change and disaster prevention and mitigation,and enlarge the sources of water body information.
2.Overview of the study area
Salt Lake is located in the west of Zhiduo County,Qinghai Province,China,and on the south side of Kunlun Mountains.The geographical location is 35°02'06.50''N-35°58'19.50''N,91°36'06.50''E-93°42'58.50''E(Fig.1).It is within the scope of the Hoh Xil National Nature Reserve and 11 km away from the Qinghai-Tibet Railway and Highway in the east region.The basin drainage area is 8,661 km2.The overall terrain is high in the west and low in the east,with an altitude of 4,117-5,931 m,with an average of 4,744 m.It mainly includes Zonag,Kusai,Haidingnor and Salt lakes,which are distributed from west to east.In addition to the two lakes,Cuodarima Lake and Cuorendejia Lake are located in the south in an additional basin.Among them,Zonag Lake and Kusai Lake are saltwater lakes,with alpine ice and snow melt water as the supply source;Haidingnor Lake and Salt Lake were highly mineralized saltwater lakes in the early stage,and locally developed sodium sulfate subtype and carbonate brine,mainly supplied by the lake water overflowing from the upstream Haidingnor Lake and the surrounding surface runoff(Dinget al.,2022).
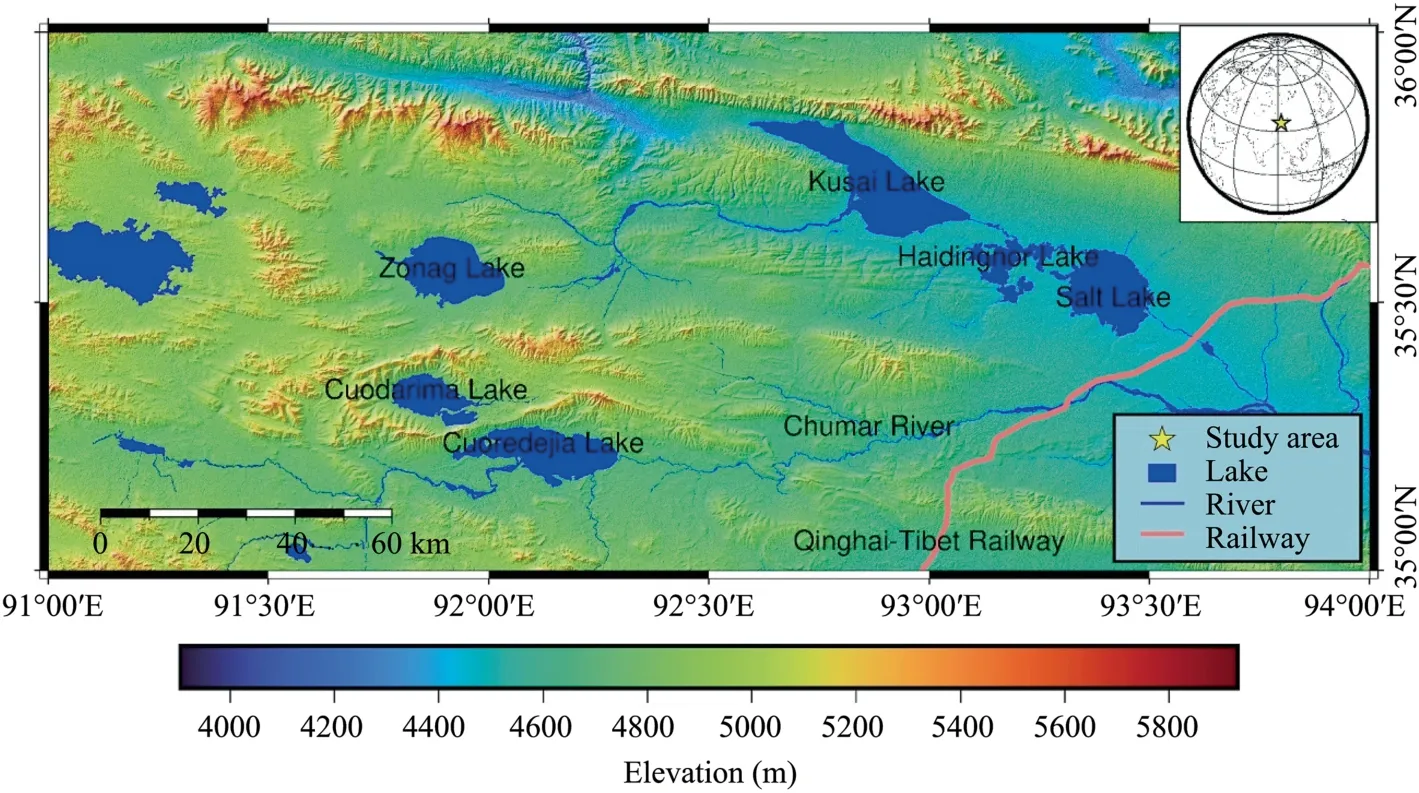
Fig.1.Geographic location and landform map of the study area.(The topography is based upon ASTER GDEMV3 data,downloaded from the web http://www.g scloud.cn,with a spatial resolution of 30 m.The water body dataset (Li et al.,2022) is downloaded from the web https://data.tpdc.ac.cn).
Abundant snow cover and modern glaciers are distributed on the top of the Kunlun Mountains in the north of the basin,with a glacier area of 66.79 km2.Lake water is mainly supplied by atmospheric precipitation and glacier melt water,and evaporation is the main discharge mode.The study area is situated in a semi-arid climate of the alpine grassland zone,which is mainly characterized by low temperature and dryness,long freezing periods,and simultaneous rain and heat.According to meteorological monitoring data from 1960 to 2020 for the nearest meteorological monitoring station (Wudaoliang meteorological station,originating from the China Meteorological Science Data Sharing Service Network),the average annual temperature is-5.11°C,and the freezing period is from current October to the next April (Yaoet al.,2016).The average annual precipitation is 299.3 mm and the rainy season is concentrated from May to September,which accounts for 90%of annual precipitation.
In September 2011,Zonag Lake broke its embankment,seriously endangering the ecological environment of the Hoh Xil region(Yaoet al.,2016;Huet al.,2021b;Zhanget al.,2021;Dinget al.,2022).After the breakout,the lake water overflowed and flowed through Kusai Lake and Haidingnor Lake,and then merged into Salt Lake,leading to the four previously isolated lakes establishing a hydraulic connection and forming a pattern of four lakes connected.As a result of the overflowing lake water being injected into Salt Lake,the water level of Salt Lake rose and salt concentration of the lake water dropped significantly.Under the current situation,Zonag,Kusai and Haidingnor lakes have lost their regulation and storage functions of water resources,and Salt Lake has become a tail lake in the basin(Dinget al.,2022).The increment of water from the three upstream lakes is all borne by Salt Lake,resulting in the continuous rise of the water level and volume,the continuous expansion of the area,and the risk of overflow and collapse.If water of Salt Lake overflows,it will not only endanger infrastructure such as Qinghai-Tibet Railway,Qinghai-Tibet Highway,Qinghai-Tibet direct current interconnection project,Gela finished oil pipeline and multiple communication optical cables (Yaoet al.,2016),but also affect the regional ecological environment.Therefore,timely and accurate acquisition of water body information in this area can provide scientific decision-making and a basis for relevant departments to carry out flood prevention and control.In other words,a reasonable,scientific and accurate water extraction method is the basic guarantee for making a correct scientific decision.
In order to cope with the risk of Salt Lake overflow and collapse,the relevant departments of the Qinghai Province Government completed an implementation plan for the drainage and dredging project for Salt Lake in April 2019(Langet al.,2021).The drainage project uses natural lake banks to orderly and controllably drain Salt Lake water to the Qingshui River(in the southeast of the study area near the Qinghai-Tibet Railway)through the artificial drainage control measures,and finally flows into the Chumar River (in the south in the area,see Fig.1) and enters the Yangtze River system.Long-term dynamic monitoring can control the water level of Salt Lake effectively,and it greatly reduces the safety operation risk of major linear projects downstream.Hence,using different monitoring methods,it is particularly important to expand the monitoring methods and data sources,especially for results with small influence factors and high accuracy,such as water body extraction derived from SAR images.
3.Datasets and methodologies
3.1.Datasets
The Sentinel-1 single look complex(SLC)products covering the entire study area,with an acquisition date of 22 August 2022 are selected as the SAR source images.The reason for this decision is on this date,the weather was seriously cloudy,and the obtainable optical is full of clouds.In addition,the coverage of the optical images did not completely cover the whole study area.We show the situation of the Sentinel-2 image in Fig.2.
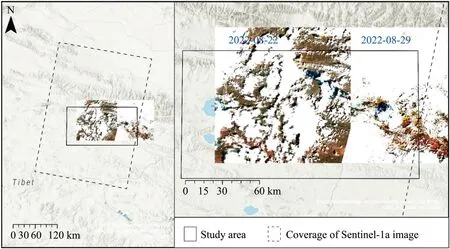
Fig.2.The coverage of merged Sentinel-1 image and situation of Sentinel-2 image (Sentinel-2 is showing the true color at the spatial of 10 m).
As shown in Fig.2,Sentinel-1 has wide coverage and spital resolution at 250 km and 5m×20m(range×azimuth),respectively.The study area only covers part of the whole image coverage,while for Sentinel-2,there are some issues as follows.(1)only one scene image covering the study area is available on 22 August 2022;(2) the coverage of the available Sentinel-2 images did not cover the entire study area;(3)the Sentinel-2 images obtained on different dates have obvious chromatism and difference during image fusion processing;(4) clouds frequently appear in high-cold and high-altitude regions,especially for regional small areas.Hence,to resolve cloud impact,we selected the Sentinel-1 image on 22 August 2022,covering the whole study area as the data source for water body data extraction.
The two scenes of Sentinel-1 images covering the study area,with the C-band(wavelength ranges from 3.75 cm to 7.5 cm)and dual-polarized VV and VH,were downloaded from the ESA website (https://scih ub.copernicus.eu/dhus/#/home).For more information see Table 1.The process as presented in Fig.3 is based on the SARscape platform(version 5.6,depending on ENVI)and ENVI software(version 5.6).SDWI processing mainly includes image import,multi-looking,filtering,geocoding and radiometric calibration.All extra auxiliary data,e.g.,accurate orbit datasets and digital elevation model (DEM,in this paper,we selected SRTM 30 m data)was automatically download when processed.

Table 1 Detail information on Sentinel-1 images and JRC GSW products (Pekel et al.,2016).
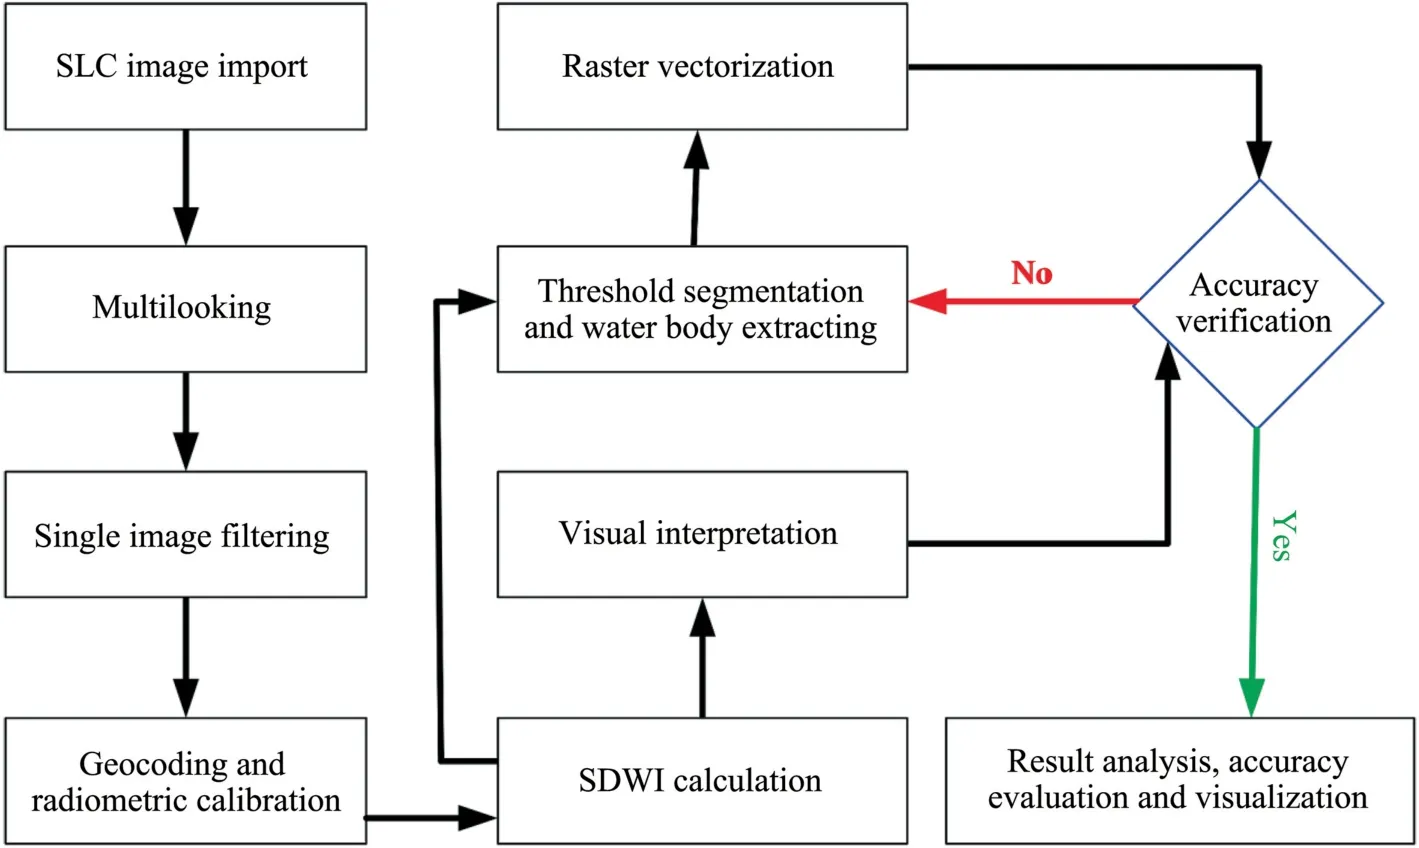
Fig.3.Core steps of water extraction processing according to SDWI.
It is hard to quantitatively analyze errors with the threshold segmentation approach.Furthermore,as cloudy weather is common in highcold and high-altitude regions,clear and high-resolution optical images are rare.In this paper,we compare our results with related water bodies,e.g.,the JRC GSW (https://global-surface-water.appspot.com/) (Pekelet al.,2016),which maps the location and temporal distribution of water surfaces globally over the past 38 years and provides statistical data on their extent and variability,and is used for qualitative analysis of accuracy.
We set the azimuth looks and range looks as one and four,respectively,and then the multi-looked and resampled results at a spatial resolution of 20 m were obtained.The Lee filter method (Lee,1986) was selected for the single image filtering process with a window size 5×5 to filter some noises for better results.Geocoding(based on the extra SRTM DEM we selected) and radiometric calibration of the filtered intensity data,the backscattering coefficient diagram of VV and VH polarization with the World Geodetic System 1984 were gained.The backscattering coefficient is calculated as Equation (1) (Jiaet al.,2019;Duanet al.,2022),shown as follows:
where σ0is the backscattering coefficient of each pixel;Ais the DN value on the original image;Kis the absolute calibration factor of the product;θ is the angle of incidence.
3.2.Methodologies
After the radiometric calibration and geocoding process,the backscattering coefficient maps with the World Geodetic System 1984 was obtained,and processed with the threshold segmentation approach.It is usually difficult to find the threshold value based only on single dualpolarized VV or VH products.Because the single VV or VH statistical curve does not show unimodal or bimodal characteristics,namely,it is easy to gain optimal threshold if the statistical curve of the backscattering coefficient data has a unimodal or bimodal peak.Owing to complexities of the various surface objects,the unimodal or bimodal features of statistical curves are usually inconspicuous.
Inspiration from normalized difference vegetation index(NDVI) and NDWI and according to water body characteristics from the microwave image,Jiaet al.(2019) proposed an index method for water body information extraction based on Sentinel-1 dual polarized data and Sentinel-1 dual-polarized water index(SDWI),which is as follows:whereKSDWIis the water extraction index;VV and VH are values of the dual-polarized VV and VH,respectively.
The core idea of Equation (2) is to expand the difference between water bodies and other surface features (background) by amplifying 10 times the product VV and VH polarized images and then using natural logarithm as the functional formula.This processing can be easy realized based upon theBandmath toolof ENVI software.The expression of the bandmath formula is: alog (10×b1×b2),b1 and b2 are VV and VH backscattering coefficients,respectively.Then the segmentation threshold can be easily obtained from the statistical curve of SDWI.The segmentation threshold is not invariable,and the optimal threshold can be obtained by adjusting the threshold size and observing the extracted results.Generally,the extracted results can be compared with existing relevant results to determine the quality of extracted results.
After determining the optimal threshold,information on the water distribution range can be obtained quickly and accurately by the threshold segmentation approach.Furthermore,water body information can be effectively distinguished from other background information by the binarization method.The extracted water body results processed with vectorization can quickly count the parameters such as area and geographical location,and draw the thematic distribution maps of water bodies.This process can be simply implemented with geographic processing software such as ArcGIS,ArcGIS Pro,GDAL,ENVI and QGIS.
4.Results
4.1.Backscatter coefficient characteristics of different data
After calculation of the backscattering coefficient with Equation(1),and SDWI in Equation(2),water body extraction input data are obtained as presented in Fig.4,and the statistical curve of each is presented in Fig.5.

Fig.4.The backscattering coefficient maps.(a),(b) and (c) are the dualpolarized VV,VH,and SDWI (combined with VV and VH) images,respectively.
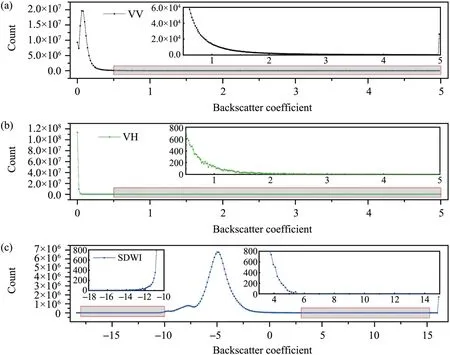
Fig.5.The statistical curve of the backscattering coefficient.(a),(b) and (c) represent the dual-polarized VV,VH,and SDWI (combined with VV and VH) images,respectively.Detailed information is presented in the partial enlargement.
From Fig.4,we find that the single dual-polarized VV or VH can distinguish the water body and non-water body to a certain extent.Specifically,because the black sections in maps of Figs.4a and 4b is because the backscattering of water bodies are low.However,in some areas,the performance of VV and VH is slightly different.For example,for the Qinghai-Tibet Railway in the southeast corner,VH is more obvious,and for the mountainous area(in the north),it is darker on the VV map.The reason is penetrability to ground surface objects create slight differences with the different dual-polarized VV or VH.
Compared with results of the single dual-polarized VV,VH,and SDWI(Fig.4),SDWI is superior to any single dual-polarized product.The distinction between water bodies and non-water bodies is more obvious.Specifically,on the SDWI map(Fig.4c),water bodies are blacker,while non-water bodies are brighter and almost pure white,and the transition value (gray or dark gray) between them decreases.It can be seen that based upon SDWI,it can quickly and effectively extract water body information,which is superior to single dual-polarized products (VV or VH).
Furthermore,from statistical charts of various results to quantitatively analyze their differences(Fig.5),we can find that the distribution of VV and VH is very similar (Figs.5a and 5b),showing obvious asymmetric distribution,with unimodal characteristics,and VV is superior to VH.VV ranges from 1.00 to 5.00,with the mean and standard deviation(Std.Dev.) at 0.11 and 0.15,respectively.VH ranges from 0.00 to 5.00,with the mean and standard Std.Dev.at 0.01 and 0.01,respectively.
The SDWI map(Fig.5c)obtained by integrating VV and VH presented in Equation (2),is better than VV or VH,and the distribution curve is more reasonable,which is more conducive to the determination of the segmentation threshold.Specifically,the distribution is symmetrical,with a distinctive single peak,in addition to the presence of a minor peak at a subordinate level.SDWI ranges from-18.37 to 16.12,with the mean and Std.Dev.at -4.64 and 2.84,respectively.In addition,there is a secondary small peak near-7.95.The approximate distribution range of the segmentation threshold can be quickly determined by the SDWI distribution curve near the peak.
4.2.Segmentation threshold and extracted water body
Based on histogram distribution range values of SDWI and trial-anderror method,after multiple times adjusting,the optimal segmentation threshold can be determined,and the result is presented in Fig.6.

Fig.6.Results of water bodies extraction derived from threshold segmentation method based on SDWI.(a) Shows the extracted result based on the optimal segmentation threshold on (b).
The optimal threshold can be determined quickly and accurately by adjusting the value of the segmentation threshold in Fig.6b according to the coincidence degree between the results and the backscattering coefficient distribution map.Although this method is relatively subjective,it is still highly practical.In addition,the Google map,Bankfull geometry dataset of major exorheic rivers on the Qinghai-Tibet Plateau(1984-2022) (Liet al.,2022),and the permanent water area are useful auxiliary information to determine the segmentation threshold,as well as accuracy verification.The optimal threshold is determined as below-6.49 by dividing SDWI repeatedly,as presented in Fig.6a.The extracted water body results completely cover the water body within the study area.After the process of vectorizing the extracted raster,the obtained results can be overlayed and compared with the JRC GSW products of 2021(Pekelet al.,2016),as presented in Fig.7.

Fig.7.Comparison between vectorized water extraction results and the JRC GSW dataset in 2021(Pekel et al.,2016).(a)Shows the overall situation of the study area;(b),(c),and (d) present the partial enlargement of Haidingnor,Salt,Cuodarima and Cuorendejia lakes.
It can be seen from Fig.7 that water body results extracted from SAR images are highly consistent with the existing water area product in 2021,and there are certain differences only because they are not completely consistent in terms of acquisition dates.Differences in the selection of the segmentation threshold will directly affect the results of water extraction,the two are not the same.The result of a threshold at-6.49 extraction in this paper is significantly larger than that of the permanent water area in 2021,while it is consistent with all the types of water bodies,not only the main six lakes(Fig.7a)but also some frequently seasonal changing regions(Figs.7b,7c,and 7d).In addition,there are some small patches,e.g.,Cuorendejia Lake areas (Fig.7d),which may be affected by atmospheric residual noise and mountain shadow.
Unfortunately,with the absence of field observation data,the composite image of Sentinel-2 data(Fig.2)of the same period is covered with clouds,and it is difficult to intuitively determine the accuracy of the results by comparing the extracted water body with the optical image.The method of extracting water bodies via calculating SDWI from SAR data is effective and fast.Some differences in the results can be adjusted and optimized benefiting from parameter optimization,such as filtering window size adjustment,clustering and manual post-editing.
5.Discussions
Large-area water extraction of water data derived from RS has been widely used.Compared with optical RS images,information mining for SAR data needs to be improved,which is mainly limited by the datasets source of SAR images.Water body data extraction just based upon single dual-polarized data (VV or VH) does not perform well.An effective method is to construct SDWI by combining data of different polarization SAR data,which is similar to NDVI and NDWI for water bodies extracting.Based on SDWI,it can quickly and accurately extract data from large areas of water bodies.Its optimal feature is that the SAR image is not affected by clouds,which is a very effective means in mountainous areas with all day clouds in the QTP.
After the threshold segmentation processing with trial and error,SDWI can be segmented directly to quickly extract water which has been used successfully in some related papers (Jiaet al.,2019;Duanet al.,2022),but the accuracy of the results may be different between various thresholds.This is mainly due to subjectivity of the threshold selection.To resolve this disadvantage,we can optimize the segmentation methods,such as using the Otsu algorithm to determine the threshold,applying object-oriented classification methods,and deep learning to classify SDWI results (Liet al.,2018;Jiaet al.,2019).There are various classification methods for the post-processing of SDWI,which can be used for reference to the successful algorithms and cases in the optical RS products classification research field(Baiet al.,2021;Zhanget al.,2021).The accuracy of SDWI results from itself needs to be focused on,especially the impact of noise,and how to set reasonable filtering parameters for many processing steps.
This paper only discusses the use of SDWI based on dual-polarized VV and VH images.The results obtained are highly consistent with the GSW product,but compared with the complex algorithm of the GSW product,the method adopted in this paper appears to be simpler and faster and has great advantages in extracting and updating information about regional water bodies.Especially for regions with strong positive changes,the high temporal resolution product is more feasible for the recognition of trends and patterns.For example,Dinget al.(2022) discusses the redistribution of water resources in this region,which is important for both engineering and environmental purposes,and these are carried out on top of reliable basic data.
Furthermore,information mining for other polarization data HH and HV or combining these four full polarization products and single polarization products(V,H)is the focus of future research,with the increasing availability of SAR data.In addition,combining optics,SAR data,and DEM datasets can conquer the limitation of time resolution,a single type of product cannot completely cover the study area,and the impact of mountain shadows(Denget al.,2016;Panget al.,2016).
6.Conclusions
In this paper,SDWI based on Sentinel-1 SAR image is used to extract the water body data of Salt Lake in Hoh Xil and its surrounding areas derived from the threshold segmentation method.The results show that.
(1) SDWI data based on VV and VH dual polarization data is superior to any result obtained from a single dual-polarized VV or VH when extracting water body data.The water body segmentation threshold can be determined quickly and accurately from the statistical curve of SDWI.
(2) Compared with existing water body data,the extracted water products gained from the threshold segmentation method with the threshold at-6.49 are significantly larger.However,this method is more sensitive to small areas or potential water bodies.
(3) For regions with long-term cloud coverage on the QTP,the results and efficiency of water extraction using SAR data will be significantly higher than those based on optical RS images or other datasets.
(4) In the future,with the availability of more and more SAR data,water extraction index for water body information extracting based on the full polarization SAR data image is an important research direction.
Acknowledgments
This research was funded by the Second Tibetan Plateau Scientific Expedition and Research (STEP) program,grant number 2019QZKK0905;the National Natural Science Foundation of China,grant number 42272339,42201162,42 101121;the Research Project of the State Key Laboratory of Frozen Soils Engineering,grant number SKLFSE-ZQ-58,SKLFSE-ZT-202203,SKLFSE-ZY-20.
 Sciences in Cold and Arid Regions2023年4期
- Sciences in Cold and Arid Regions的其它文章
- Influence of relative compaction and degree of saturation on thedeformation characteristics of bentonite under freeze-thaw cycles
- Dissolved organic carbon fractionation in wet deposition and its potential impact on radiative forcing in the central Tibetan Plateau
- Pore evolution and shear characteristics of a soil-rock mixture uponfreeze-thaw cycling
- Stability of loess high-fill slope based on monitored soil moisture changes
- 《寒旱區科學》(英文)關于數據論文關聯數據提交的倡議書