
Using geospatial technologies to delineate Ground Water Potential Zones(GWPZ) in Mberengwa and Zvishavane District, Zimbabwe
2024-01-08 09:39NyashaAshleighSizibaPepukaiChifamba
地下水科學與工程(英文版) 2023年4期
Nyasha Ashleigh Siziba, Pepukai Chifamba
1 Department of Geospatial Science and Earth Observation, Zimbabwe National Geospatial and Space Agency (ZINGSA), 630 Churchill Ave,Mount Pleasant, Harare Zimbabwe.
Abstract: The main objective of the study was to delineate Ground Water Potential Zones (GWPZ) in Mberengwa and Zvishavane districts, Zimbabwe, utilizing geospatial technologies and thematic mapping.Various factors, including geology, soil, rainfall, land use/land cover, drainage density, lineament density,slope, Terrain Ruggedness Index (TRI), and Terrain Wetness Index (TWI), were incorporated as thematic layers.The Multi Influencing Factor (MIF) and Analytical Hierarchical Process (AHP) techniques were employed to assign appropriate weights to these layers based on their relative significance, prioritizing GWPZ mapping.The integration of these weighted layers resulted in the generation of five GWPZ classes:Very high, high, moderate, low, and very low.The MIF method identified 3% of the area as having very high GWPZ, 19% as having high GWPZ, 40% as having moderate GWPZ, 24% as having low GWPZ, and 14% as having very low GWPZ.The AHP method yielded 2% for very high GWPZ, 14% for high GWPZ,37% for moderate GWPZ, 37% for low GWPZ, and 10% for very low GWPZ.A strong correlation (ρ of 0.91) was observed between the MIF results and groundwater yield.The study successfully identified regions with abundant groundwater, providing valuable target areas for groundwater exploitation and highvolume water harvesting initiatives.Accurate identification of these crucial regions is essential for effective decision-making, planning, and management of groundwater resources to alleviate water shortages.
Keywords: Groundwater resources; Analytical Hierarchical Process; Multi Influence Factor; Lineaments density; Terrain Wetness Index; Ground Water Potential Zone
Introduction
The demand for groundwater resources has been steadily increasing due to erratic rainfall patterns,leading to the depletion of major surface water sources and resulting in water scarcity for both domestic and agricultural purposes.Growing demand, reduction of water resources and increasing pollution of water, driven by an increase in population and climate change, aggravate water problems(Einlo et al.2023; Yang et al.2020).Rural and urban areas in the Mberengwa and Zvishavane districts have been significantly affected by water shortages, as silting of surface water sources, such as rivers, streams, ponds, and dams, exacerbates the situation.This water stress has adversely impacted livelihoods, especially for farmers who heavily rely on subsistence farming.To address this pressing issue, it is crucial to identify solutions for augmenting surface water supplies.In some regions, groundwater serves as a vital resource to supplement the deficits left by surface water.Groundwater is a crucial source of water supply, especially in regions with erratic rainfalls(Kazerani et al.2023).In some regions, groundwater exploitation has increased to meet the demand due to surface water quality deterioration and supply (Raju et al.2023).Accessing groundwater resources has became more important as water demand has increased, particularly in dry regions(Emami and Shahamat, 2022).Wells and boreholes have become indispensable in areas where surface water is limited.This study is vital in meeting the growing demands for groundwater resources in the Mberengwa and Zvishavane districts.
Recent research has shown that the mapping of Ground Water Potential Zones (GWPZ) is essential for identifying high probability areas for groundwater occurrence and enhancing water resource management.Geospatial technologies have emerged as crucial tools for mapping GWPZs worldwide.The use of Geographic Information System(GIS) has been widely adopted in the research methods for ground water potential zone mapping.GIS is used for spatial analysis and integration of hydrogeological variables such as rainfall, geology, soil, and terrain data to identify areas with high groundwater potential (Zhang et al.2019).Another remote sensing technique that has been utilized to map GWPZs is multispectral data analysis.This method involves the acquisition of satellite data and using it to identify land surface characteristics that indicate groundwater presence(Salimi et al.2019).
Various research methods have been employed to identify and delineate GWPZs accurately.The Analytic Hierarchy Process (AHP) is a widelyused research method that employs multiple decision-making criteria to identify GWPZs.AHP breaks down research objectives into numerous decision-making criteria and then compares their relative importance.Recent studies have shown that AHP is an effective and powerful tool to analyze and structure problem-solving and consider expert judgment on factor selection and weight assignment, leading to more accurate identification of areas with high groundwater potential(Osinowo and Arowoogun, 2020).The incorporation of advanced data processing algorithms and machine learning techniques has the potential to significantly contribute to improved predictions and help overcome uncertainties associated with geospatial analyses.In recent years, machine learning has emerged as an important tool in groundwater resource management, especially in identifying Ground Water Potential Zones.
Artificial Neural Networks (ANNs) can analyze large datasets from various sources, such as satellite imagery, and effectively predict potential groundwater zones.In a study conducted by Yadav and Salui (2021), machine learning models were used for identification of Ground Water Potential Zones in part of Hugli District, West Bengal, India.The study developed a geospatial model that integrated hydro-geological input parameters, including elevation, slope, drainage density, flow accumulation, geology, geomorphology, soil, land use,land cover.An ANN based on the relationship between groundwater potential data and the above factors was implemented to create Ground Water Potential Zone map.Another machine learning technique that has shown great potential in Ground Water Potential Zone mapping is Random Forest(RF).In a study by Prasad et al.(2020), Random Forest (RF) was used to develop a Ground Water Potential Zone map along the west coast of India.The study utilized input parameters, including elevation, slope, aspect, Slope Length (SL), profile curvature, plan curvature, Topographical Wetness Index (TWI), distance from streams, distance from lineaments, lithology, geomorphology, soil, land use, Normalized Difference Vegetation Index(NDVI), and rainfall, to create a Ground Water Potential Zone map.Similarly, in a study conducted by Hanane et al.(2023), Random Forest (RF)machine learning technique was employed to estimate groundwater potential zones in the BouSbaa area, Marrakech, Morocco.The predictive model was designed using several input variables, including geology, topography, land cover, slope, and rainfall, to generate a groundwater potential zone map.Sarkar et al.(2022) also used Random Forest(RF) and Random Sub-Space (RSS) in the Teesta River Basin of Bangladesh.
The integration of machine learning techniques such as ANN and Random Forest algorithms has the potential to enhance the accuracy of groundwater potential zone mapping and improve predictions.By incorporating machine learning techniques, experts can identify areas with a high probability of groundwater occurrence and help overcome the uncertainty and limitations that are associated with traditional geospatial analytical methods.As a result, machine learning tools can be a valuable tool in groundwater resource management, especially in areas with limited access to accurate data and geospatial technologies.
Recent research findings indicate that the inclusion of meteorological and groundwater yield data in GWPZ mapping leads to more accurate and reliable results (Das et al.2019; Doke, 2019; Gnanachandrasamy et al.2018a; Kabeto et al.2022;Kumar et al.2017; Oyedele, 2019; Adeyeye et al.2019; Senapati and Das, 2022).Notably, different researchers employ distinct sets of factors based on their local environments, which can lead to variations in the final Ground Water Potential Zones(GWPZ) results.
Overall, a recent review of the relevant research results on groundwater potential zones shows that the use of various research methods has proven to be essential in accurately delineating GWPZs, and the inclusion of meteorological and groundwater yield data has further enhanced the accuracy of these results.
The main objective of this study is to utilize geospatial technologies to delineate areas of probable groundwater potential in regions characterized by heterogeneous terrain and moderate to low annual rainfall.The geospatial-based approach enables the integration and processing of crucial factors contributing to groundwater occurrence.Each factor, in turn, exerts varying degrees of influence on groundwater availability.In this study, two techniques, namely Analytical Hierarchical Process (AHP) and Multi-Influencing Factor(MIF), were employed.The MIF method assigns weights to influence factors based on their major or minor effects on groundwater occurrence, where major effects receive a weight of 1 and minor effects receive a weight of 0.5.The determination of these weights was guided by existing research(Sohail et al.2019; Sutradhar et al.2021; Thapa et al.2017; Yeh et al.2015; Magesh et al.2012).On the other hand, AHP, an effective Multi-Criteria Decision-Making (MCDM) technique, has been extensively used by other researchers in GWPZ mapping (Adeyeye et al.2019; Das et al.2019;Hutti and Nijagunappa, 2011; Melese and Belay,2022; Muthamilselvan et al.2022; Zghibi et al.2020).The AHP model assigns normalized weights to each thematic layer of groundwater exploration, further enhancing the precision of the results.
As this research was moving forward, several aspects must be considered.Firstly, it is essential to validate the accuracy and reliability of the delineated groundwater potential zones using field data collection and hydrogeological investigations (Manap et al.2017).While geospatial technologies offer valuable insights, ground-truthing is crucial to ensuring the practical applicability of the results.Additionally, the study should explore the potential integration of other geospatial techniques such as Geographic Information Systems (GIS), Remote Sensing (RS), and Geostatistics to enhance the robustness of the Ground Water Potential Zone mapping (Mallick et al.2021).The incorporation of advanced data processing algorithms and machine learning techniques may also contribute to improved predictions and help overcome uncertainties associated with geospatial analyses (Masroor et al.2023).However, it is essential to acknowledge that despite the strengths of geospatial technologies,their effectiveness can be hindered by data limitations, including inadequate spatial datasets or input data, which may impact the accuracy of the groundwater potential zone delineation (Kumar et al.2016).Therefore, recognizing and addressing these data limitations is crucial for the successful application of geospatial technologies in groundwater resource assessment and management.
To overcome data limitations, this study utilized satellite images to extract information on key land surface features, including land cover, rainfall, and topography.By supplementing ground-based data collection with these remote sensing techniques,gaps in spatial datasets were filled and the accuracy of groundwater potential zone delineation was improved.
1 Study area
This research is dedicated to explore Agro Ecological Zones (AEZ) 4 and 5a in Zimbabwe,specifically focusing on areas characterized by an average annual rainfall of less than 650 mm.The scarcity of surface water in these regions makes them particularly suitable for conducting a comprehensive groundwater potential mapping study.The research site encompasses two districts, namely,Mberengwa and Zvishavane (Fig.1).By examining these specific areas, we aim to gain valuable insights into groundwater resources and their potential implications for sustainable agricultural practices in the region.The two districts have a total population of 353,210 (ZIMSTAT, 2022).The study site extends from 19.93°S to 21.05°S and 29.47°E to 30.53°E.It encompasses an area of 7,630.27 km2and a perimeter of 436,118 km.High elevation values of 1,547 m are found around Mberengwa Mountain in the central part of the study area, and low elevation with a minimum of 624 m is in the southeastern part of the Mberengwa district.The major activities in the study area are subsistence farming, small-scale gold mining, and platinum mining.The dominant rivers are Ngezi and Runde, which drain from the northwest towards the southeast.Drainage in the study region exhibits a dendritic drainage pattern.A conformable sequence of sedimentary, volcanic, and older granitic rocks such as gneiss and migmatites with minimum metamorphism is more common in the study region.Major faults such as the Mberengwa fault, the Mtshingwe fault, and other smaller faults contribute a lot to the hydrogeology of the Zvishavane and Mberengwa districts.
2 Methodology
2.1 Data sources and processing

Fig.1 Location of the study area
The procedure adopted for this work comprised desktop studies, and Remote Sensing (RS) was the major data source (Table 1).The workflow involved is also presented in Fig.2.Remotely sensed data such as SRTM-DEM and Landsat 8 satellite imagery were used to drive vital GWP factors.The following data were used in this study.
2.2 Methods
In identifying ground water potential zones, the following procedures were implemented.Geology and soil shapefiles were converted from vector to raster format using ILWIS software.These raster datasets were resampled to 30 m so that they have the same spatial resolution as the DEM and Landsat images.For rainfall, CHIRPS satellite data and meteorology gauging station data were used.A Bias correction on satellite rainfall data was applied using observed gauging station data.Monthly CHIRPS data was downloaded from January 1981 to December 2021.Bias correction was applied using the power transformation technique (Goshime et al.2020; Gumindoga et al.2016).
Lineaments were extracted from Landsat 8 satellite imagery.For lineament extraction, image enhancement and directional filtering were employed(Ahmadi and Pekkan, 2021; Al-Nahmi et al.2016).Principal Component Analysis (PCA) using bands 1-7 was used to enhance the satellite imagery and the resultant bands were used to extract lineaments(Al-Nahmi et al.2016; Mathew and Ariffin, 2018).In addition, manual lineament extraction was employed, and lineaments were extracted from Geomaps through digitizing techniques.The extracted lineaments were used to calculate lineament density in ArcMap.
SRTM DEM was used to extract drainage for the area.The drainage shapefile was used to train the DEM in QGIS using the r carve algorithm in QGIS.Hydro-processing tools in ILWIS were used to extract drainage from the DEM.Overlay Analysis was done for extracted drainage to assess the performance of the extraction process.A visual agreement existed between extracted drainage and existing drainage networks (Fig.3).The derived drainage was used to calculate drainage density in ArcMap.

Table 1 Data collected, source and use

Fig.2 Flowchat showing summary of methodology adapted for the research
Terrain and Topographic indices such as slope,TRI, and TWI were derived from DEM.TWI is calculated by the following formula
Where:Ais the upslope contributing area andβis the local slope (Karimi-Rizvandi et al.2021;Mukherjee et al.2013; Ró?ycka et al.2017).Slope and TWI were calculated in ILWIS.TRI is computed from elevation value of a central pixel which is subtracted from elevation values of neighbouring pixel.TRI is expressed by the equation
Where:Zcis central pixel elevation andZiis neighbouring pixel elevation (Ró?ycka et al.2017).TRI was calculated in QGIS.
Random forest (RF) was used for supervised image classification in QGIS.RF algorithm is a decision tree-based machine learning algorithms for image classification.The area was classified into eight land use/land cover classes.Random sampling was used to generate 256 points.Accessible points were visited and each point was categorised according to relative land use.A simple Kobo toolbox form was designed which captures the GPS coordinates of the points and their land use type.For navigation to each point, a handheld Garmin GPS was used.

Fig.3 Visual agreement between existing and extracted drainage

Fig.4 Multi Influencing Factor (MIF) framework
Normalised Weights for each factor and its relative classes were calculated in Excel following the AHP and MIF procedures (Fig.4).Factors were reprojected to the same coordinate system, overlaid in a GIS environment, and each factor and feature class was assigned its relative weight.Weights were assigned according to the relevance of each factor to the presence and occurrence of groundwater.All weighted maps were integrated to produce a Ground Water Potential Zone map.The following Equation was implemented in the raster calculator to produce a GWPZ map (Chaudhary and Kumar, 2018; Das et al.2019; Gnanachandrasamy et al.2018; Kumar et al.2016; Yeh et al.2016).
Where:GWPIis groundwater potential index,Gis Geology,Ris Rainfall,STis Soil Type,SLis Slope,LDis Lineament Density,DDis Drainage Density,TRIis Terrain Ruggedness Index,TWIis Terrain Wetness Index,LUis Land Use, and the subscript “w” and “wi” refer to the normalized weights of layer and the normalized weights in each thematic layer, respectively.
A normality test was conducted on groundwater yield data from boreholes and GWP results from AHP and MIF.Normality testing, followed by Pearson correlation test was conducted in SPSS.
3 Results and discussion
3.1 Thematic parameters
3.1.1 Geology
Geology with high permeability and porosity, such as sandstone and limestone, are more likely to have groundwater aquifers that can be accessed through wells and springs.It affects the characteristics of the soil.Geology is the most influential factor influencing the occurrence, availability, and distribution of groundwater (Kumar et al.2017).Groundwater occurrence, distribution, and movement vary with location mainly due to rock formation, rock fracturing and the degree of weathering(Raju et al.2023).The study area featured a diverse range of geological formations, comprising around twelve different rock types.Within this diverse range, the Older Gneiss Complex, various Gneisses, and Young Intrusive Granite emerged as the dominant rock types (Fig.5d).However, these rock types have relatively low porosity, which limits their ability to hold water.As a result, the Older Gneiss Complex, various Gneisses, and Young Intrusive Granite contribute less to groundwater occurrence, which is reflected in the analysis where they have lower weights (Table 2).This highlights the significance of geological analysis in comprehending the distribution and availability of groundwater resources.
3.1.2 Rainfall
After geology, rainfall (Fig.5a) is another crucial factor in determining GWPZ in the current study of agroecological zones 4 and 5.High rainfall areas are thought to have more potential for water,and vice versa (Das, 2017).Rainfall, a major source of groundwater recharge, was analyzed for its spatial distribution in the study area.The region generally experienced moderate to low rainfall,ranging from less than 450 mm to 750 mm per annum, indicating moderate groundwater recharge potential.
3.1.3 Lineaments
A lineament is described as a large-scale linear feature that appears in satellite images as relatively straight tonal alignments and the topography of the underlying structural elements.Landsat imagery played a significant role in visually interpreting and identifying the lineaments in the area for groundwater potential assessment.High lineament density regions (Fig.5h) were found in the southwestern and northwestern parts of the study area,indicating potential groundwater concentration and permeable zones (Gnanachandrasamy et al.2018a;Oyedele, 2019).Lineaments are known for their high permeability and porosity, thus establishing an indirect relationship between lineament density and groundwater potential zones (Magesh et al.2012).The study area consisted of major faults such as the Mberengwa fault, the Mtshingwe fault,and other smaller faults.Folding and faulting contribute a lot to the hydrogeology of the study region.An increase in fault lines signifies more lineaments, which results in more permeable zones and high groundwater potential zones.Findings by(Muthamilselvan et al.2022), states that high lineament density zones indicate areas with high groundwater occurrence zones.In this study, the central and northern parts of the study area have higher lineament density and tend to exhibit high groundwater potential.Therefore groundwater is associated with fractures, joints and fissures which exhibits secondary porosity and high groundwater movement and accumulation.
3.1.4 Drainage density

Fig.5 Conditioning factors in groundwater potential mappinga) Rainfall, b) Soil, c) Slope d) Geology, e) Terrain Ruggedness Index (TRI), f) Land use/Land cover (LULC), g)Terrain Wetness Index (TWI), h) Lineament Density, i) Drainage Density
In hard rock terrains like the study area, drainage density is recognized as one of the key indications for locating groundwater potential zones.It is also a proximate indicator of a terrain's porosity and permeability (Murugesan et al.2011).Drainage density (Fig.5i) also played a crucial role in groundwater distribution, affecting runoff and infiltration (Chaudhary and Kumar, 2018).There was a greater visual agreement between extracted drainage and existing drainage (Fig.4).The study area exhibited high drainage density, particularly with a dendritic pattern, associated with low groundwater recharge and permeability.In contrast, areas of low drainage density showed an indirect relationship with higher groundwater potential.
3.1.5 Slope
Hilly regions with a slope >33° (Fig.5c) show steeper slopes are not good for groundwater.The slope of the land greatly affects the amount of water that seeps into the ground and the amount that runs off.In this study area, slope was categorized into five classes ranging from very steep to gentle, influenced the groundwater potential through its control over runoff, infiltration, and percolation rates (Das et al.2019c; Chaudhary andKumar, 2018; Zeinolabedini and Esmaeily, 2015).Steeper slopes were associated with higher runoff and lower groundwater potential, while gentler slopes promoted higher water-holding capacity and more time for water infiltration and percolation,leading to increased groundwater recharge (Adeyeye et al.2019; Doke, 2019).
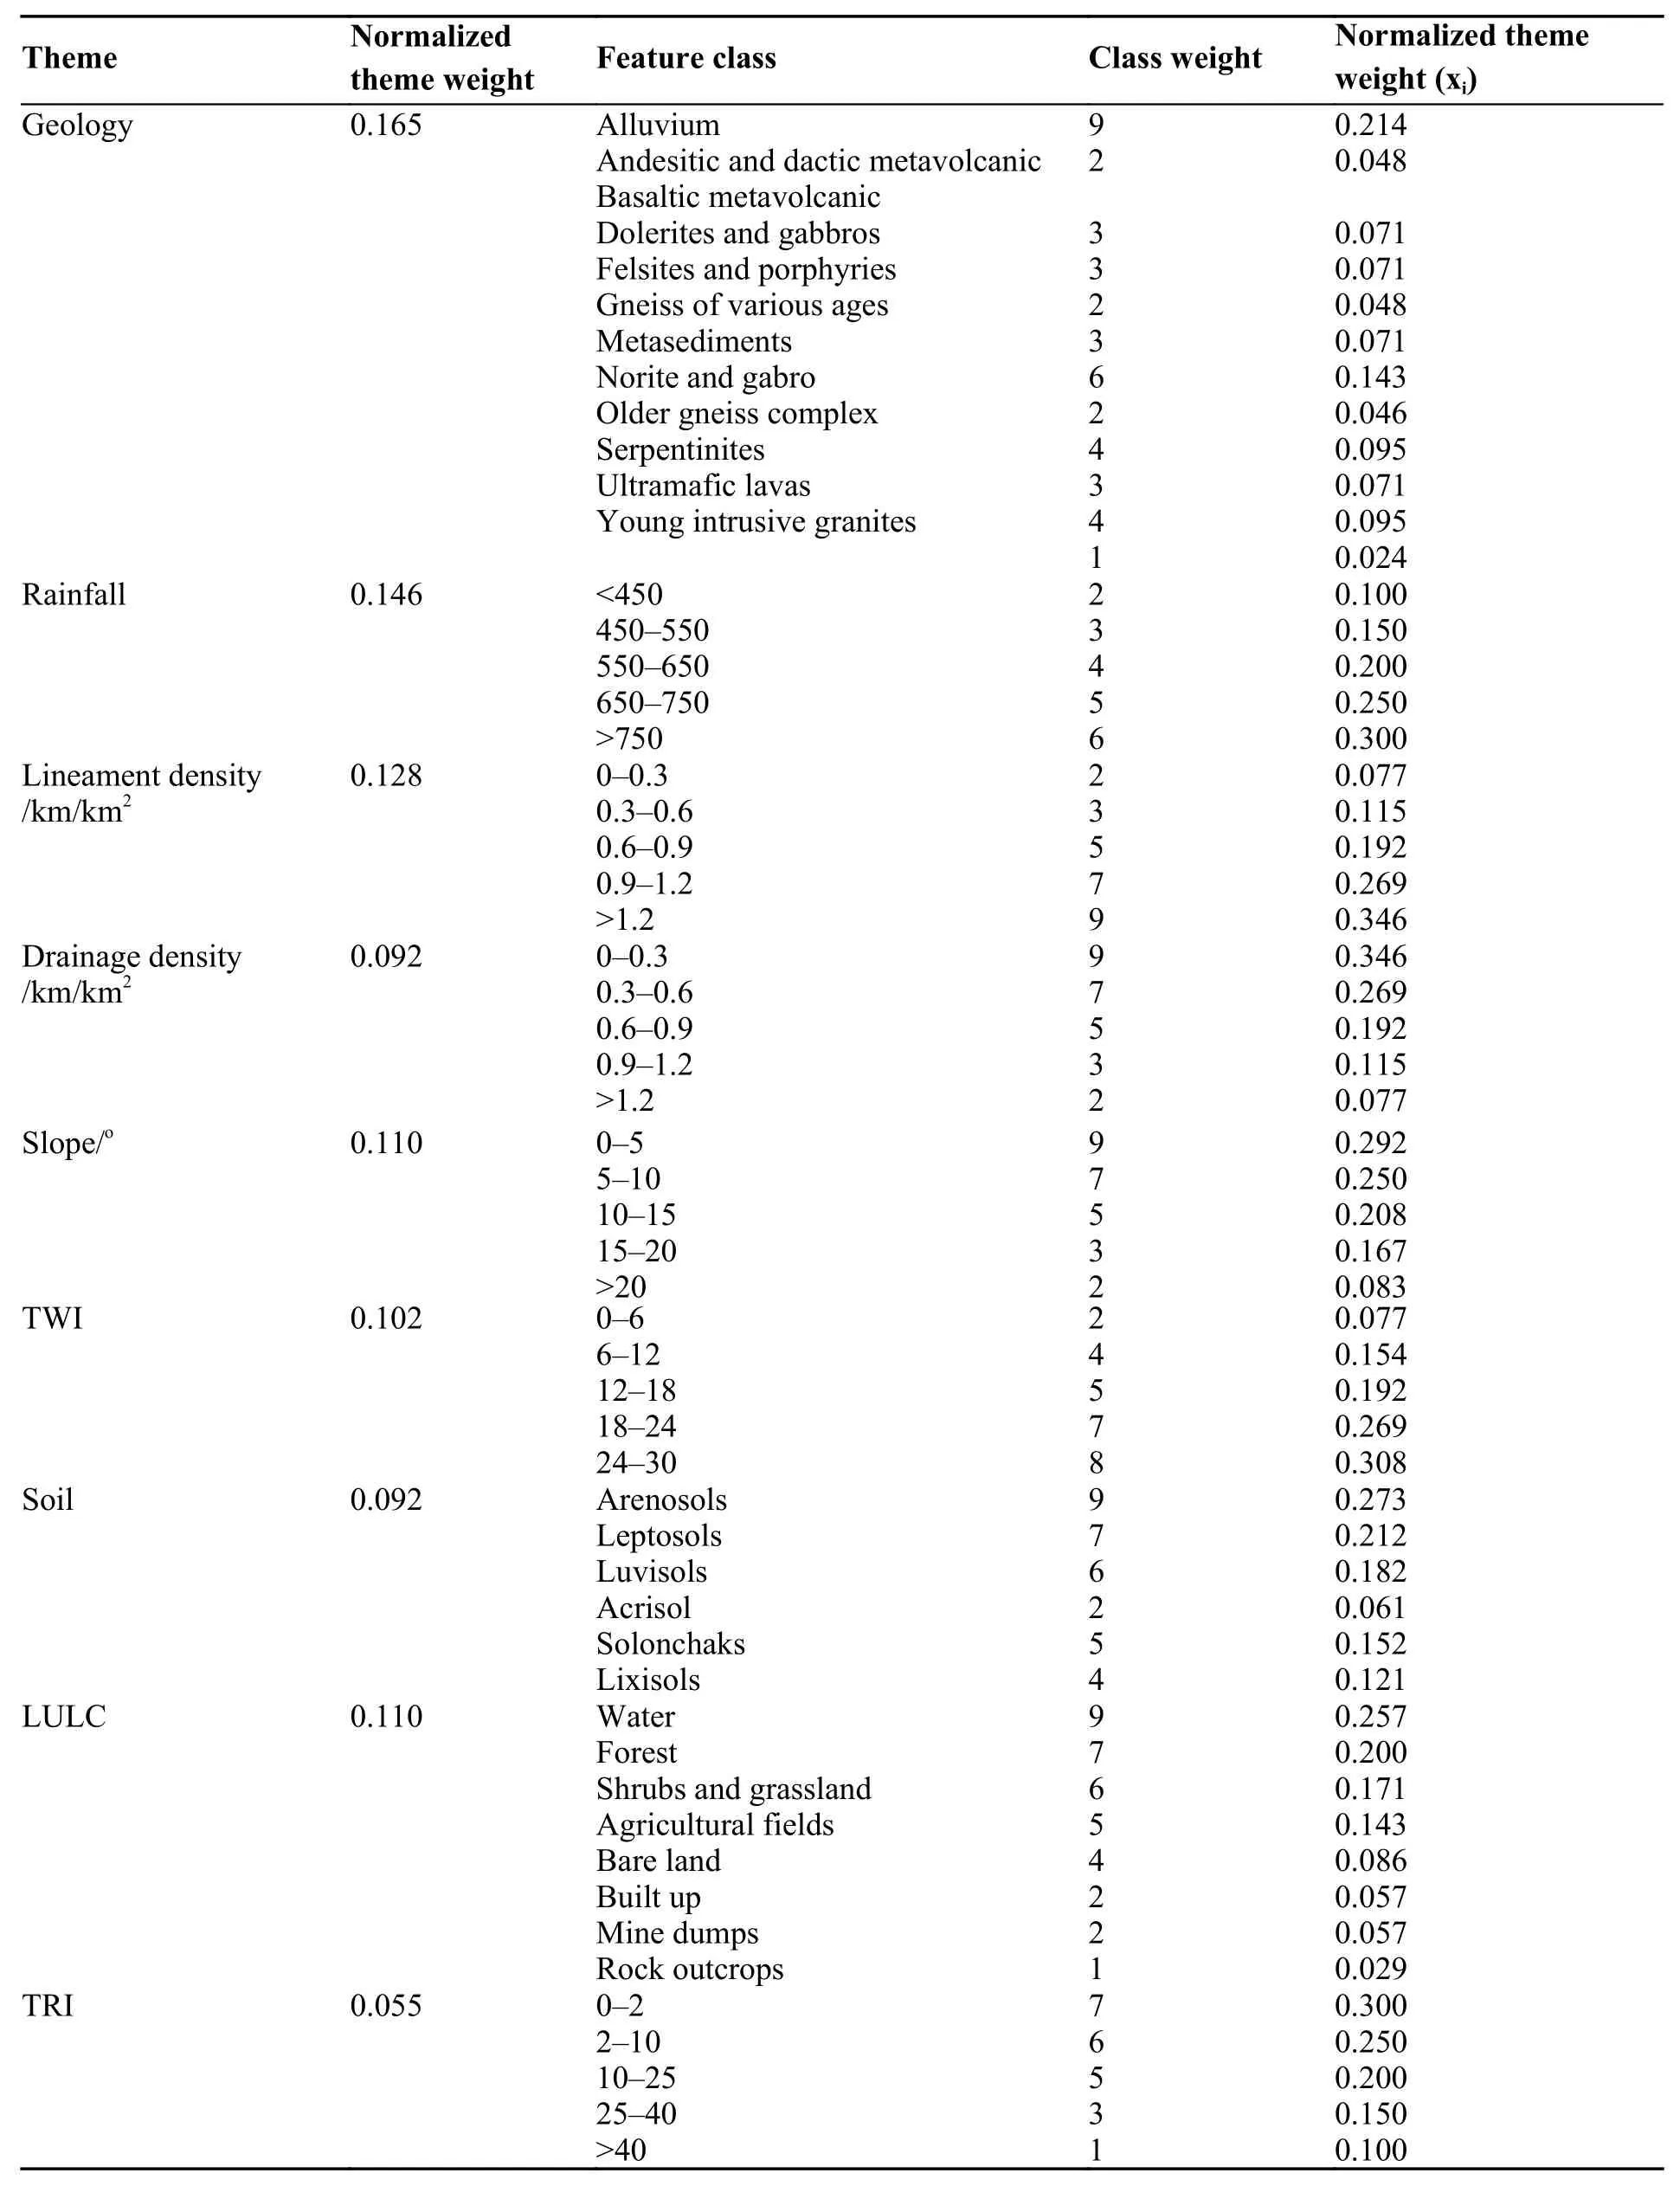
Table 2 Determine the weight of conditioning factors using AHP method
3.1.6 Topographic wetness index
By examining the topography of the land surface to find areas of high soil moisture and waterlogging, which are possible groundwater recharge zones, the Topographic Wetness Index (TWI) is a valuable tool for predicting groundwater potential in a region.Soil saturation is a characteristic of areas with a high TWI value (Fig.5g), and this is thought to be favorable for groundwater recharge and storage.Based on several factors, including topography, soil, and vegetation that affect soil moisture and waterlogging, the index is calculated(Moore et al.1993).The identification of groundwater recharge sources and efforts to improve groundwater resource management through the optimization of water use can both benefit from the estimation of groundwater potential using TWI.TWI provides critical insights into the distribution,movement, and recharge potential of groundwater,all of which facilitate the development of sustainable groundwater resource management.
3.1.7 Soil
Soil is characterized by its physiography, geology,and climate, all of which are crucial for groundwater recharge and runoff.The types of soil and their permeability affect the area's ability to hold water.Different soil types (Fig.5b) were assessed for their contribution to groundwater potential.Soils varied in permeability and porosity, with aeronosols formed from unconsolidated sands exhibiting better permeability, and vertisols formed from basalt rock showing very low permeability and low groundwater potential.
3.1.8 Land use/land cover
Land use and land cover (LULC) (Fig.5f) were analyzed to understand their impact on infiltration and groundwater recharge.The study area was classified into eight classes, and it was observed that vegetation, such as forests, shrubs, and grasslands, promoted higher infiltration and groundwater recharge compared to built-up areas, mine dumps, and rocky areas.Groundwater potentiality is minor in mine dumps, built-up and rocky areas since these regions hinder water from seeping into the ground and facilitate the production of surface water.Densely vegetated regions promote groundwater occurrence as roots promote infiltration.
3.1.9 Terrain Ruggedness Index
The Terrain Ruggedness Index (TRI) is a quantitative measure used to assess the roughness or topographic complexity of a landscape.Its influence on groundwater potential can be attributed to its role in influencing surface water runoff and infiltration rates.Studies have shown that areas with higher TRI values tend to have increased surface runoff and decreased infiltration, leading to reduced groundwater recharge (Akbari et al.2021).The terrain ruggedness index was incorporated as a factor contributing to groundwater potential.The study area was dominated by regions of low to moderate ruggedness (Fig.5e), with high ruggedness primarily observed in mountainous areas with heterogeneity in terrain.
3.2 Weight assignment and ground water potential mapping
Through remote sensing data, GIS and weighted overlay analysis, the Analytical Hierarchical Process (AHP) and Multi-Influencing Factor (MIF)techniques (Tables 2 and 3) were employed to calculate the weights of different factors contributing to groundwater potential.With the MIF technique, factors with major influence were assigned a weight of 1, while those with minor influence were assigned a weight of 0.5 (Table 3).The AHP technique further normalized the weights for each factor and its relative classes (Table 2).The combined weights of the nine thematic layers wereused to create the final groundwater potential maps.

Table 3 Determine the weight of conditioning factors using MIF method
Finally, the groundwater prospect maps (Figs.6 and 7) have been prepared by integrating information from all the thematic parameters.The results of both MIF and AHP techniques showed groundwater potential zones with varying proportions across the study area.The area coverage of each GWPZ class is shown in Table 4 and Fig.8.The MIF method indicated very poor, poor, moderate,good, and very good groundwater potential zones covering 14%, 24%, 40%, 19%, and 3% of the study area, respectively.On the other hand, the AHP method identified groundwater potential zones as very poor, poor, moderate, good, and very good, covering 10%, 37%, 37%, 14%, and 2% of the study area, respectively.Using both methods, it is clear that more than 50% of the study region has moderate to very high groundwater potential.This can be explained by high lineament density in the study area.Lineaments, such as faults and joints,play a crucial in groundwater accumulation and movement (Raju et al.2023).The AHP and MIF results indicated that the central and northern parts have well to very good GWP.These areas are dominated factors such as sedimentary rocks,higher lineaments densities, and rainfall above 650 mm per annum which promote groundwater accumulation.This research is in tandem with the findings of (Muthamilselvan et al.2022), where areas gentle slope of lower than 3°, high lineament density, low drainage density, and densely vegetated show favourable conditions for groundwater infiltration and storage.Moderate to very good potential zones exhibit characteristics favourable for groundwater infiltration and storage.These zones are influenced by factors such as gentle slope, high lineament densities, high rainfall, land surfaces with shrubs to dense vegetation, permeable soil.Dense vegetation retards surface runoff,allowing water to pervade into the soil thereby increasing the amount of ground water.Very low and low GWP is more dominant in the western,eastern and south eastern region, these are characterised by communal lands, rainfall less than 550 m, lineament density less than 0.3 km/km2, Gneisses and lixisols.These regions are dominated by factors which retards groundwater occurrence and replenishment.Areas with high TWI values are strongly related to groundwater potential (Sarkar et al.2022).In this research waterways and rivers exhibited moderate to very good groundwater potential and these regions had high TWI values.The study revealed that soil type (arenosols), geology,land use (mainly forest), and high lineament density were key factors contributing to good to very good groundwater prospects.
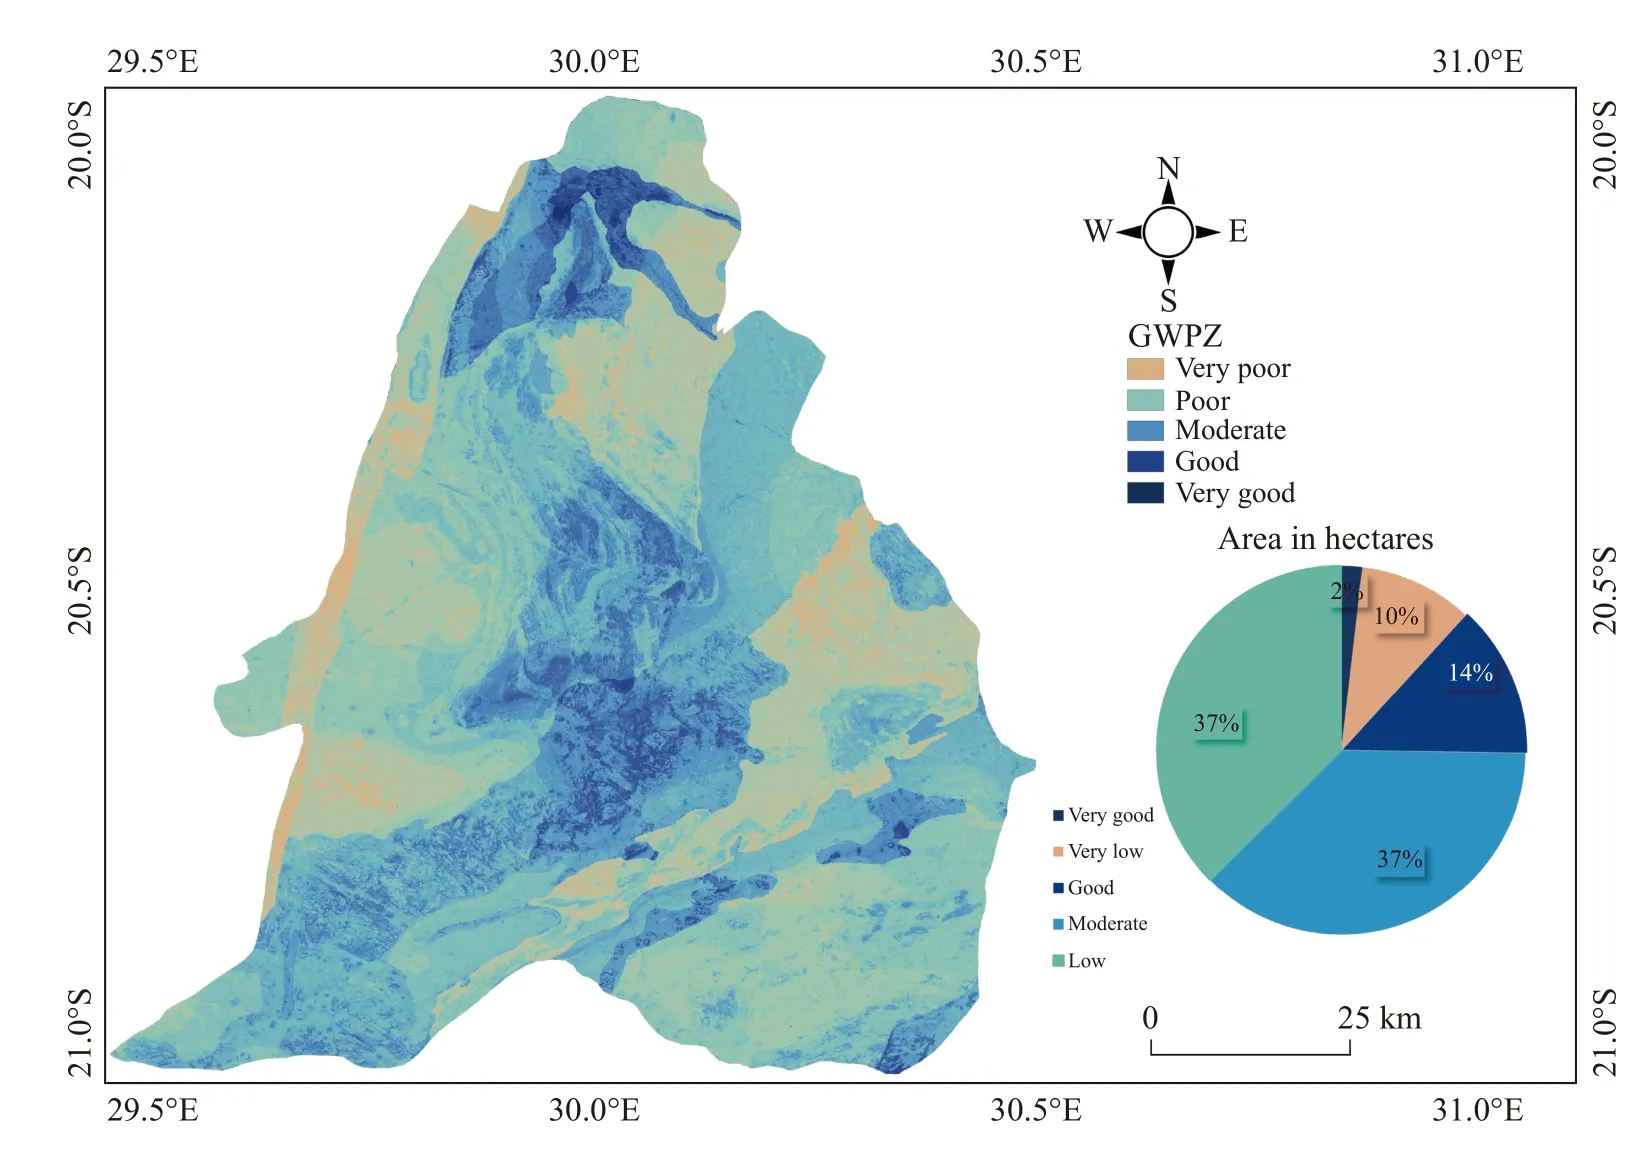
Fig.6 Ground water potential zones derived from AHP method

Fig.7 Ground water potential zones derived from MIF method
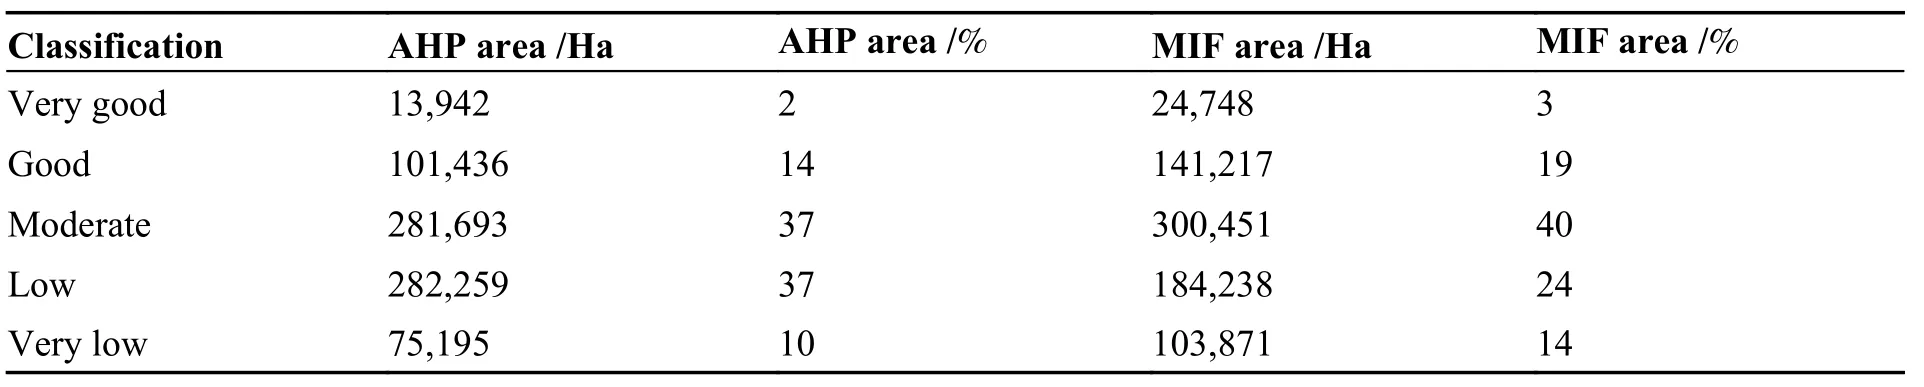
Table 4 The percentage and area covered by Ground Water Potential Zones (GWPZ)

Fig.8 Bar chart representing area covered by GWPZ
A correlation analysis was conducted (Fig.9a and 9b) to compare the groundwater potential results from MIF and AHP techniques with borehole yield data from 330 sites.The analysis showed a very strong agreement (ρ=0.911) between the MIF results and borehole yield data, indicating the reliability of the MIF method.The AHP results exhibited moderate agreement (ρ=0.696)with the borehole yield data.Fig.10a and 10b shows scatter plots for MIF and AHP with their R2of 0.83 and 0.47, respectively.Correlation between the two methods shows that the derived groundwater potential zones are reasonably in line with the actual results.The strong agreement between the MIF method and borehole yield data, as well as the moderate agreement shown by the AHP method,can be attributed to the different approaches, geology and topography data used to derive groundwater potential zones.The MIF method is a datadriven approach that considers multiple factors that influence groundwater potential, including topography, geology, land use/land cover, and rainfall.On the other hand, the AHP method is a subjective approach that requires the expert weighting of criteria based on their perceived importance.Therefore, the reliability of the MIF method in this study can be attributed to its ability to consider a wide range of factors that influence groundwater potential.The conclusions of the study can be applicable to other areas with similar hydrogeological characteristics as the study area, although the methodology may need to be tailored to the sitespecific conditions and data inputs available.

Fig.9 Correlation between MIF and Borehole yield

Fig.10 Scatter plot for MIF derived GWPZ
Groundwater resource management requires a comprehensive and integrated approach that addresses countless physical and socio-economic dimensions (Einlo et al.2023).MIF and AHP provide integrated techniques involving various thematic factors to delineate groundwater potential.Through the use of various factors different environments were classified according to their potential in groundwater exploration.Each of the two techniques applied different weights on each factor, thereby yielding different GWP and this led to variation in the correlation of each technique.In this research the two applied techniques had different weights for thematic layers and this difference in weights yielded different GWP results and different levels of agreement between GWPZ and Borehole yield data.The two implied techniques comprehensively and integrate factors to address the issue of groundwater exploration so as to curb water shortages in Mberengwa and Zvishavane.These regions are suffering from surface water is depleting due to siltation, erratic rainfall and groundwater pose a viable solution for water supply.
4 Conclusion
In conclusion, the integration of geospatial technologies and the utilization of Multi-Influencing Factor (MIF) and Analytical Hierarchical Process(AHP) techniques proved to be highly effective in conducting a comprehensive assessment of groundwater potential zones in the study area.The analysis encompassed nine crucial factors, namely geology, soil, rainfall, land use/land cover, drainage density, lineament density, terrain wetness index,terrain ruggedness index, and slope, which collectively contributed to understanding the distribution of groundwater potential.The results revealed distinct zones with varying groundwater potential,offering valuable insights for sustainable water resource management and informed decisionmaking.The study classified the study area into five categories of groundwater potential zones:Very poor, poor, moderate, good, and very good.The AHP method assigned these zones the following proportions: Very poor (10%), poor (37%),moderate (37%), good (14%), and very good (2%),while the MIF method yielded: Very poor (14%),poor (24%), moderate (40%), good (19%), and very good (3%).Notably, a strong correlation was observed between MIF-derived groundwater potential results and borehole yield data, as well as a moderate correlation between AHP-derived groundwater potential results and borehole yield data.As per the validations results AHP method (ρ=0.696)is shown more poor and moderate areas in the watershed area as compared to MIF method (ρ=0.911).The comparison analysis showed that the combined approach MIF method are performed acceptably for demarcating groundwater potential areas in the study area.The outcomes of this research underscore the significance of geospatial technologies as indispensable tools for exploring groundwater in suitable regions.Moreover, this study has demonstrated the efficacy, time efficiency, and cost-effectiveness of Geographic Information System (GIS) and Remote Sensing (RS) in groundwater potential exploration.By narrowing down the search areas for planners and decisionmakers, this research offers valuable guidance in mitigating water shortages in the study area.
- 地下水科學與工程(英文版)的其它文章
- Influence of water conservancy project on runoff in the source region of the Yellow River and wetland changes in the Lakeside Zone, China
- Factors driving surface deformations in plain area of eastern Zhengzhou City, China
- Analytical solution for Non-Darcian effect on transient confined-unconfined flow in a confined aquifer
- Electrical geophysical evaluation of susceptibility to flooding in University of Nigeria, Nsukka main campus and its environs, Southeastern Nigeria
- Simulation of thermal breakthrough factors affecting carbonate geothermalto-well systems
- Effects of coal mining and tunnel excavation on groundwater flow system in karst areas by modeling: A case study in Zhongliang Mountain,Chongqing, Southwest China