
Electrical geophysical evaluation of susceptibility to flooding in University of Nigeria, Nsukka main campus and its environs, Southeastern Nigeria
2024-01-08 09:39DanielNnaemekaObioraJohnsonCletusIbuot
地下水科學與工程(英文版) 2023年4期
Daniel Nnaemeka Obiora, Johnson Cletus Ibuot*
1 Department of Physics and Astronomy, University of Nigeria, Nsukka, Enugu State.
Abstract: Flooding occurs when rainfall exceeds the absorption capacity of soil and causes significant environmental consequences.In this study, electrical resistivity techniques were employed to assess the flood susceptibility of the study area by examining variations in electrical properties.Prior to flooding,Vertical Electrical Sounding (VES) and Electrical Resistivity Tomography (ERT) profiles were conducted to determine the variations in resistivity within subsurface lithologies exposed to the injected current.The injected current penetrated the subsurface units characterised by resistivity ranging from 190.5 Ω·m to 6,775.7 Ω·m, 42.3 Ω·m to 7,297.4 Ω·m, and 320.2 Ω·m to 24,433.3 Ω·m in the first, second and third layers, respectively.These layers were identified as lateritic topsoil, medium-coarse brownish grained sand,and coarse pebbly blackish sand, respectively.The calculated reflection coefficients between layers 1, 2,and 3 reveal alternation in layers with values ranging from -0.04 to 0.66 and 0.36 to 0.95 for k1 and k2,respectively.The transverse resistivity, longitudinal resistivity and anisotropy ranged from 243.59 Ω·m to 24,115.42 Ω·m, 199.61 Ω·m to 14,950.76 Ω·m, and 1.02 to 2.14.Models derived from the ERT profiles reveal variations in resistivity, pinpointing areas of low resistivity which correspond to waterlogged and impermeable layers.The result of this study underscores the importance of integrated resistivity techniques in the study of floods, as it provides valuable insights into flood behaviour, and subsurface dynamics.
Keywords: Anisotropy; Vertical electrical sounding; Electrical resistivity tomography; Geoelectric layer;Permeability
Introduction
Flooding is a natural disaster that occurs when an area is inundated by an excessive volume of water,often resulting from heavy rainfall, snowmelt, dam breaches, coastal storms, or other factors, particularly when natural drainage systems cannot handle the excess water (Hübner et al.2015).Flooding poses significant risks and challenges to both human communities and the environment.Its impacts include the loss of human lives and property, displacement of people, disruption of economic activities, environmental degradation, the outbreak and spread of waterborne diseases, and damage to agricultural lands etc.Effectively preventing flooding involves addressing the issues such climate change, improvement of infrastructure, land-use planning and community education about flood risks, necessitating a combination of policy, investment, education, and international cooperation.The annual flood report from the Nigeria Hydrological Services Agency (2020) identifies key causes of flooding in Nigeria, including soil moisture, extreme weather events associated with climate change, dam functionality, especially those near the country's borders, and topographical factors.In areas without seismic or earthquake activity, flooding often results from improper runoff channelization or surface geological features(Akpan et al.2009; Koestel et al.2009).During floods, the resistivity of the subsurface can change due to factors such as water infiltration, changes in soil saturation, and the presence of contaminants or sediments (Aizebeokhai et al.2010; Osei et al.2021).Investigating flood-prone areas is important for the development mitigation strategies.There are cases of flooding in some areas within the study area as shown in Fig.1 and have posed a serious challenge to the community.Notably, the flooding does not result from dam break or riverbank overflow but is primarily due to excessive precipitation, climate change and anthropogenic activities such as urbanization, deforestation, drainage modifications.These anthropogenic activities can significantly influence flooding patterns and the event severity to the area without adequate flood protection measures (Agbonkhese et al.2014; Echendu, 2021; Umar and Gray, 2023).Heavy rainfall often leads to the flooding of areas like the football fields and adjacent roads, rendering them impassable and blanketed in silt and mud.This has resulted in the cancellation or postponement of sporting events during rainy season.
Floods have been occurring throughout Earth's history, and are expected to persist so long as the water cycle and soil moisture dynamics continue.Understanding the geological characteristics of an area is crucial for assessing flood risk, developing flood management strategies, and designing infrastructure to mitigate flood impacts (Tehrany et al.2014; Kayode et al.2019; Wu, 2020; El-Zein et al.2021; Osei et al.2021, Kim and Kang, 2021).
Floods have continued to challenge geoscientists and environmental scientist in providing essential data for planners and policy makers(Adekalu et al.2007; Chikwelu and Ogbuagu,2014; Adabanija and Oladunjoye, 2014; Owusu and Agbozo, 2019; Shahabi et al.2020; Salvati et al.2023).

Fig.1 Examples of flood affected areas: (a, b and c) part of the University stadium predisposed to flooding during rainy season, (d) front of the University Secondary School during rainy season
The investigation of flooding requires a detailed understanding of the fundamental flow properties and process behaviour in the subsurface lithostratigraphic units.The physics of fluid flow in geological media is a dynamic science and researchers study the behaviour of geological materials within the subsurface (Keller and Frischnecht, 1982;Nutzman et al.2005; Kayode et al.2019; El-Zein et al.2021).Knowledge of physical properties such as reflection coefficient, anisotropy, hydraulic conductivity, and porosity is vital for characterizing subsurface layers.These properties can reveal the heterogeneity of subsurface materials and the presence of impermeable layers or geological structures that influence the movement of water.Due to unlimited resource constraints, researchers often use model equations to predict and manage subsurface water flow (George et al.2017; Ibuot et al.2019; Omeje et al.2023).
This paper contributes to the assessment of subsurface geological units in flood-prone areas.Vertical electrical sounding (VES) and electrical resistivity tomography (ERT) are used to study the overburden layers that retain the surface runoff.These methods provide information about the conductivity/resistivity of distributed geological formations vertically and horizontally (Loke, 2000;Olasehinde and Bayewu, 2011; Bala and Cichy,2015; Obiora and Ibuot, 2020; Ibuot et al.2022).In combination with geological observations, VES and ERT measurements help identify geological heterogeneities that may be saturated with water.VES offers insights into vertical subsurface resistivity variations, while ERT delivers high-resolution 2D images of the subsurface, enhancing the accuracy and efficiency of flood risk assessment.Therefore, the aim of this study is to employ electrical resistivity methods to delineate the shallow subsurface lithologic units in the study area and assess their susceptibility to flooding.The results will provide valuable insights into how subsurface dynamics influence flood susceptibility and groundwater interactions.The integrated approach(VES and ERT) will enhance the accuracy, efficiency, and scope of flood susceptibility assessment.
1 Study area

Fig.2 Geologic map of the area showing the location of the study area and the geological cross section along the line trending SW - NE
The study area encompasses the University of Nigeria, Nsukka and its environs, situated in Nsukka town, Enugu State, Southeastern Nigeria.It covers a vast area of land and is nestled within the landscape of Nsukka.The locale is enriched by a lush tapestry of vegetation, including an assortment of trees and shrubs, which contribute to the area's visual appeal.Geologically, the study area lies within the Ajali and Nsukka Formations (Fig.2) which are parts of the Anambra sedimentary basin situated within the Benue Trough-a prominent geological feature in Nigeria.The Benue Trough is a sedimentary basin characterized by layers of sedimentary rocks comprising shales,sandstones, and limestones.These rocks were formed over millions of years through the deposition of sediments.According to Reyment (1965),Ajali Formation is a complex geological unit with lithological diversity, primarily characterized by alternating layers of shale, sandstone, and coal(Nwajide and Reijers, 1996; Obiora and Ibuot,2020).The lithology of Ajali Formation provides valuable information about the Late Cretaceous period in the Anambra Basin.The Nsukka Formation was deposited during the Campanian to Maastrichtian ages of the Late Cretaceous period (Agagu et al.1985; Reyment, 1965; Nwajide, 2013).The predominant lithological composition of the Nsukka Formation includes sandstone, shale, conglomerate, and coal.The lithological characteristics of the Nsukka Formation provide information about the depositional environment, paleoclimate,and paleoenvironmental conditions during the Late Cretaceous period in southeastern Nigeria (Reyment, 1965; Agagu et al.1985; Obaje 2009).
The geomorphology of the study area is intricately shaped by the contiguous natural landscape,featuring a undulating terrain comprising hills and valleys, typical of the broader region (Ogbukagu,1976).The topographic diversity has evolved over time due to the influence of erosion and weathering processes, resulting in the formation of distinct landforms.The area is renowned its agricultural potential, with soils of remarkable fertile that support a diverse range of crops, including yam,cassava, maize, and various vegetables.The landscape is dotted with farmlands and small villages,where agriculture plays a pivotal role in the local economy.
2 Materials and Methods
2.1 Geohydraulic properties
Geohydraulic properties are the characteristics of subsurface geologic materials that are related to the movement and behaviour of groundwater within the subsurface.These properties provide valuable information about the earth's subsurface materials and the distribution of subsurface materials.They are derived from primary geoelectric parameters,such as layers resistivity and thickness, and include reflection coefficient, longitudinal and transverse resistivities, and anisotropy.
2.1.1 Reflection coefficient (RC)
The reflection coefficient signifies the extent to which groundwater reflects at an interface between different geologic materials when it encounters this boundary.The resistivity reflection coefficient, a parametric tool, reveals the trend in subsurface resistivity variability, focusing on layers 1, 2, and 3 in this study.The resistivity values were used to estimate the reflection coefficients (k1andk2),expressed respectively in Equations 1 and 2.
Where:k1andk2are the reflection coefficients,ρ1, ρ2, and ρ3are the resistivities of layer 1, 2, and 3, respectively.The reflection coefficient values must fall within the range of +1 to -1.A reflection coefficient of +1 signifies an underlying layer as a pure insulator, while a value of -1 implies a perfect conductor.Whenρ1equalsρ2, an electrical boundary will not exist resulting ink=0 (Ibuot et al.2019).
2.1.2 Longitudinal resistivity, transverse resistivity and anisotropy
Longitudinal resistivity and transverse resistivity are important parameters in characterizing the subsurface properties relevant to the study of flooding.Longitudinal resistivity (ρl), measures the electrical resistance encountered by the current flowing in the same direction as the current electrodes.The current flows in parallel with the geological layers and is expressed in Equation 3(Henriet, 1976).
Longitudinal resistivity offers information regarding different geological formations, including aquifers and confining layers, which are crucial for understanding water behaviour during flooding events.Low longitudinal resistivity values suggest the presence of highly conductive geomaterials such as saturated sediments or clayey soils, indicative of waterlogged or flooded areas.Conversely,high longitudinal resistivity values may indicate low-conductivity formations, such as bedrock or unconsolidated materials with low water content.
Transverse resistivity (ρt) measures the electrical resistance encountered by the current flowing perpendicular to the current electrodes during survey.The flow of current is considered to be normal to the layers and is define by Equation 4(Henriet, 1976).Transverse resistivity helps identify lateral variations in subsurface resistivity.
This parameter aids in detecting areas with contrasting subsurface materials or structures that can influence the movement and accumulation of water during flooding events.Transverse resistivity anomalies may indicate the presence of geological features such as faults, fractures, or preferential pathways for groundwater flow, which can significantly impact on flooding distribution and severity.
Anisotropy arises in the subsurface due to variations in current flowing directions.It characterizes the variations in hydraulic properties and behaviour of water flow in different directions within porous medium, such as soil or rock.Equation 5 expresses the coefficient of anisotropy (λ) as the square root of the ratio of the resistivity measured perpendicular to the bedding to that measured parallel to the bedding.
The coefficient of anisotropy is typically close to 1.0 for isotropic medium and rarely exceeds 2.0 in most geological locations (Zohdy et al.1974;Shailaja et al.2016; Ekanem, 2020).
2.2 Data acquisition
The electrical resistivity method is based on injecting current into the ground via two current electrodes and measuring the potential difference across the subsurface through two additional potential electrodes.This study employs established electrical resistivity techniques, namely Electrical Resistivity Tomography (ERT) and Vertical Electrical Sounding (VES), as conventional geophysical investigation tools.These methods facilitate the mapping of shallow subsurface electrostratigraphy by identifying variations in resistivity or conductivity among different lithological units within geologic formations (Keller and Frischknecht,1966; Telford et al.1990; Lowrie, 1997).
VES is a specific application designed to vertically measure subsurface resistivity at a single location.It provides insights into the subsurface structure and stratigraphy, which is valuable for flood studies.Through analysing resistivity profiles, VES technique can identify different layers and their properties, such as variations in resistivity, lithology, porosity, and permeability.The information from VES aids in understanding the geological factors influencing flood behaviour,such as preferential flow paths, potential storage areas, and waterlogged regions (Aizebeokhai et al.2010; Ekanem, 2020).By mapping resistivity variations, VES can identify areas with higher conductivity, indicative of potential subsurface water pathways during flooding.By measuring the resistivity at varying depths, the result of VES enables to identify water-bearing layers, providing insights into their thickness, extent, and properties, which in turn helps the understanding of subsurface dynamics (George et al.2018; Obiora and Ibuot, 2020).
The electrical resistivity survey in the study area was conducted using the Integrated Geo and Instrument Services (IGIS) signal enhancement resistivity meter with model SSR-MP-ATS and its associated equipment.The 1-D VES technique with Schlumberger electrode configuration was used at fifteen different locations.In this configuration,direct current was introduced into the ground through a pair of current electrodes (AandB), and a separate pair of potential electrodes (MandN),which measured the potential difference created.During this process, the apparent resistance (Ra) of the penetrated geologic materials was recorded from the resistivity meter's display.The apparent resistivity was calculated by multiplyingRaby the geometric factor (K), as expressed in Equation 6;
Where: The geometric factorKis given by the expression in Equation 7:
The estimated resistivity values were plotted on a bilogarithmic graph, which facilitates the smoothening and correction of outliers, treated as noise.The smoothened resistivity curves were electronically inverted to true resistivity using the WINRESIST software program.This program generates VES curves (Fig.3a and Fig.3b), and gives the primary parameters including true resistivity, thickness and depth.The inversion of the resistivity of the overburden layer yields overburden conductivity (σ).The spread of the conductivity/resistivity was achieved using the Origin software program,which displays the resistivity contrasts in contour segments.
ERT is a geophysical imaging technique that assesses the distribution of subsurface electrical resistivity.It plays a vital role in flood studies by providing valuable subsurface information for understanding flood behaviour, improving flood modelling, assessing flood risk, monitoring groundwater dynamics, and detecting potential levee failures.By integrating ERT with other geophysical and hydrological techniques, researchers can enhance their understanding of floods and develop effective strategies for flood management and mitigation (Tehrany et al.2014; Dekongmen et al.2021; Ajibade et al.2021; Negese et al.2022).ERT helps in characterizing the subsurface by mapping the distribution of resistivity variations,enabling the identification of potential water flow paths, aquifers, impermeable layers, and other subsurface features relevant to flooding.

Fig.3 Sample VES curves (a) VES 1 and (b) VES 4
In this study, the Wenner electrode configuration was used, as the focus was on overburden layers.This method is invaluable for the study of floods, providing valuable insights into flood behaviour, groundwater dynamics, and flood risk assessment.In 2-D electrical resistivity measurement for ERT, the same Integrated Geo and Instrument Services (IGIS) and its accessories were used.Here, the pair of current and potential electrodes were incrementally spaced at 5-meter intervals throughout entire measurement, progressively increasing the separation until reaching the maximum length.This implies that measurement was taken in steps of 5 m, 10 m, 15 m, 20 m, etc., until the maximum length is exhausted.The forward modelling subroutine was applied in the calculation of the apparent resistivity values, and the inverse procedure depends on an iterative smoothness-constrained least-squares algorithm.This inversion process effectively eliminates geometric effects and provides a true depth and actual resistivity image.The iteration continues until the objective function, constrained by combined smoothness, is minimized.The measured resistances for different intervals were converted to apparent resistivity using the expression in Equation 8;
Where:ais the electrode separation.The obtained resistivity data was then used to generate ERT profiles using the RES2DINV software program.
3 Results and Discussion
3.1 Vertical Electrical Sounding (VES)
The interpretation of VES data provided valuable insights into the electrical resistivity, thickness and depth of geo-electrical layers, as summarized in Table 1.The survey revealed four distinct geoelectrical layers obtained within the maximum depth penetrated by the current electrode spread.
The first layer was delineated as lateritic topsoil intercalated with clay with resistivity ranging from 190.5 Ω·m to 6,775.7 Ω·m, while its thickness and depth range from 0.5 m to 3.6 m.The significant variability in resistivity values within this layer could be attributed to factors like the presence of artificial structures and persistent bioturbating activities.
The second geoelectric layer, delineated as a brownish medium-coarse grained sand intercalated with clay, has resistivity, thickness and depth ranging from 42.3 Ω·m to 7,297.4 Ω·m, 2.3 m to 21.9 m, and 3.5 m to 23.2 m, respectively.
The third geoelectric layer featured blackish coarse pebbly sand with resistivity, thickness and depth ranging from 320.2 Ω·m to 24,433.3 Ω·m,5.1 m to 40.9 m, and 12.5 m to 64.1 m, respectively.
The fourth geoelectric layer has relatively high resistivity values ranging from 198.2 Ω·m to89,226.5 Ω·m, but the thickness and depth could not be determined within the limit of maximum current electrode spread used.
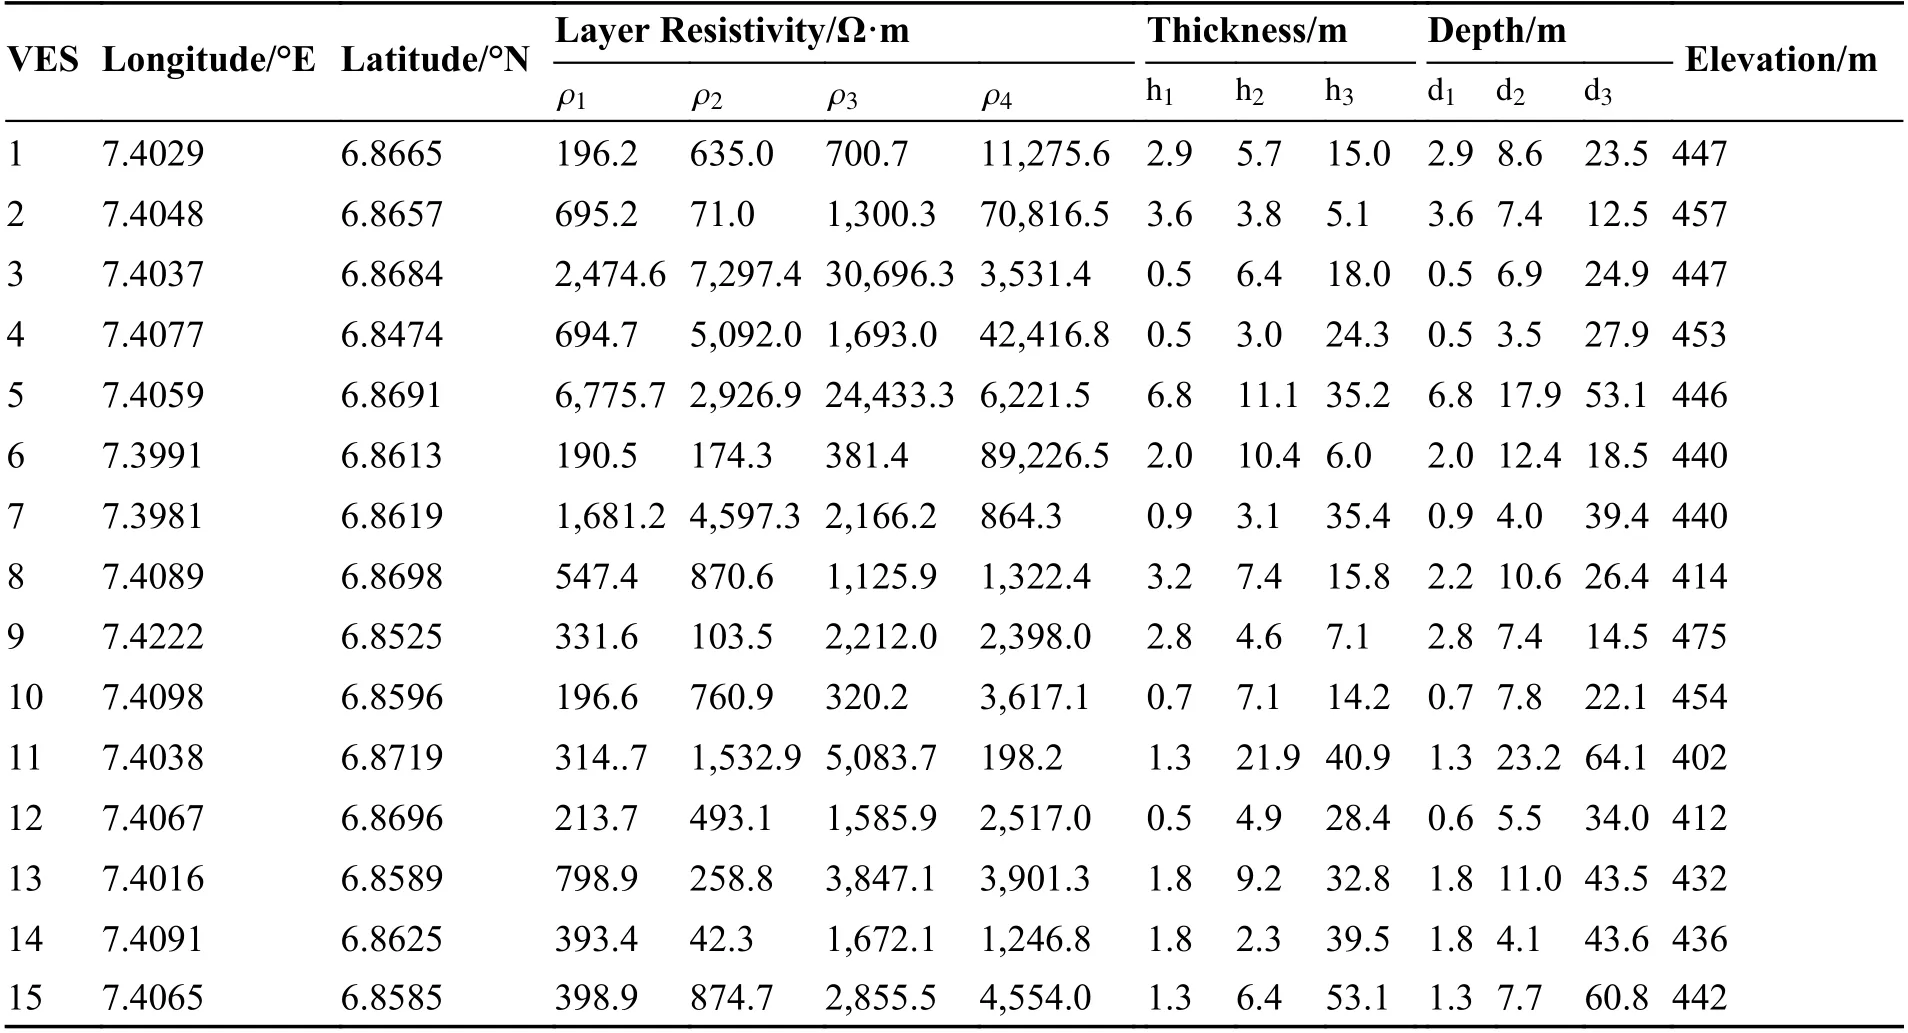
Table 1 Summary of measured electrical resistivity data in the study area
The results summarized in Table 1 indicate a trend of increased thickness with depth concerning the geologic units penetrated by currents.Fig.4 illustrates the variations of resistivity in layers 1, 2,and 3.

Fig.4 Variation of resistivity of the layers 1, 2 and 3
Equations 1 to 5 were employed in computing the second-order geoelectric parameters.The parameters considered in this study included the resistivity reflection coefficient, longitudinal resistivity, transverse resistivity and coefficient of anisotropy.The summary of the computed data is presented in Table 2.
The reflection coefficients (K1andK2) were computed for layers 1, 2, and 3 to assess the variability of subsurface resistivity within these layers.Layers 1 and 2 were considered forK1and layers 2 and 3 forK2.The values ofK1andK2ranged from-0.04 to 0.76 and -0.36 to 0.95, respectively,These values are shown in Fig.5, where the negative values indicate an inversion in resistivity between the upper layer and the underlying one,whereas positive values indicate an increase in resistivity as current passes from the layer above to the underlying layer (Ekanem, 2020; George,2020).The distributions ofK1andK2are illustrated in Fig.6 and Fig.7.The contour maps show the regions with high K1 which corresponding to regions with low K2 and vice versa.The distributions also indicate the inversion in reflection coefficients as a result of the alternation in resistivity between the pairs of lithological units.High reflection coefficients act as barriers to groundwater,while low reflection coefficients promote smoother groundwater flow across geological boundaries.
The transverse and longitudinal resistivity values ranged from 243.59 Ω·m to 24,115.42 Ω·m and 199.61 Ω·m to 14,950.76 Ω·m, respectively.It was observed that the values of transverse resistiv-ity were consistently higher than those of longitudinal resistivity across all VES locations.This suggests that the subsurface material is anisotropic,implying varying electrical conductivity in different directions.The distribution of transverse resistivity is shown in Fig.8, while the distribution of longitudinal resistivity is shown in Fig.9.These figures reveal similar trends, with the northern part of the study area characterised by higher values of transverse and longitudinal resistivity.Lower values indicate the presence of highly conductive geomaterials such as saturated sediments or clayey soils, suggesting waterlogged or flooded areas.The region with high transverse and longitudinal resistivities indicates that the subsurface materials have limited conductivity, low permeability, and slow drainage capabilities.

Table 2 Summary of estimated hydrogeologic parameter

Fig.5 Trend of resistivity reflection coefficients K1 and K2

Fig.6 Distribution of K1

Fig.7 Distribution of K2

Fig.8 Distribution of transverse resistivity

Fig.9 Distribution of longitudinal resistivity
The coefficient of anisotropy expresses the variation in hydraulic properties and water flowing behaviour in different directions within a porous medium.The values ranged from 1.02 to 2.14, as depicted in the contour map in Fig.10.Low anisotropy suggests relatively uniform flow in all directions, potentially leading to more predictable but potentially prolonged flooding.High anisotropy indicates varying flow characteristics, which can result in preferential flow paths and localized flooding in some areas, while other areas may experience more efficient drainage.Higher values of anisotropy suggest greater variation in permeability along different directions (Shailaja et al.2016).

Fig.10 Distribution of anisotropy
The variations of these hydraulic properties in different directions affect the retention capacity of the medium, and influence surface runoff and flood dynamics.The soil ability to retain water is closely linked to its particle size; fine particles of clayey soil retain water more effectively than coarser particles of sandy soil (Ekanem, 2020).The clayey soils, with high porosity but low permeability, restrict the flow of water from the topsoil to the subsurface.Shallow subsurface with low water retention capacity produces runoff and can lead to floods rapidly.
3.2 Electrical Resistivity Tomography(ERT)
Profiles in Figs.11-14 demonstrate the variations in subsurface electrical resistivity, which are related to the changes in lithology, moisture content, and the presence of conductive materials(e.g.clay or contaminants).The profiles show spatial distributions of low resistivity at the top layers which spread laterally across the study area.The resistivity of the topsoil is typically low,suggesting that the topsoil is highly conductive and is likely prone to rapid saturation during rainfall or flood events.While this can reduce surface runoff in some cases, it may also lead to localized flooding and waterlogging, particularly if the subsurface has limited drainage capacity.Anomalies in resistivity may indicate the presence of conduits,fractures, or other subsurface features that facilitate flow of water.Low resistivity values extend to depths greater than 10 m in as shown Fig.11 and Fig.12, except in Fig.13 and Fig.14, where low resistivity is observed in the deeper layers.The low resistivity values signify the areas with high conductivity, which suggest the presence of saturated or waterlogged areas.These low resistivities may indicate the presence of impermeable layers of clay materials sandwiched between sand bodies(Adabanija and Oladunjoye, 2014), inhibiting the flow of water and contributing to flooding.The deeper layers reveal highly resistive geological formations with resistivity values greater than 1,000 Ω·m except in Fig.14, where resistivity is less than 1,000 Ω·m across the layers penetrated by the introduced current.The ERT models align well with the results of VES, confirming the presence of low resistivities in the top layers, indicative of more conductive, saturated, or waterlogged geomaterials susceptible to flooding.
4 Conclusion

Fig.11 2D electrical resistivity tomography model of the study area along profile 1
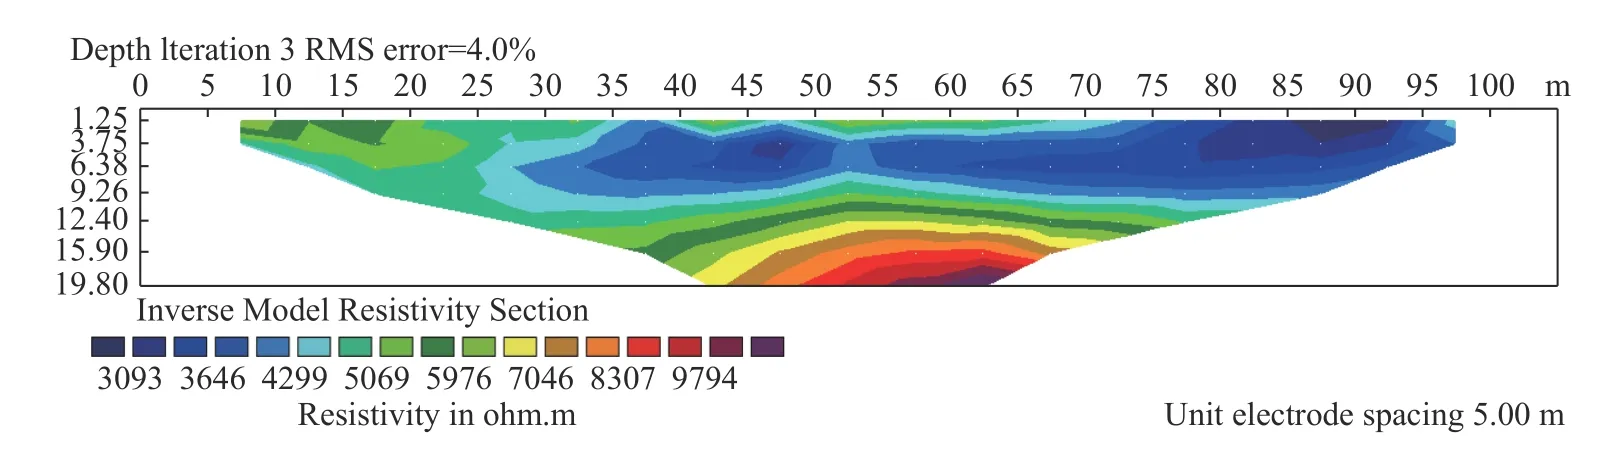
Fig.12 2D electrical resistivity tomography model of the study area along profile 2

Fig.13 2D electrical resistivity tomography model of the study area along profile 3

Fig.14 2D electrical resistivity tomography model of the study area along profile 4
This research utilizes integrated electrical resistivity techniques VES and ERT to conduct a comprehensive subsurface lithological analysis within the University of Nigeria, Nsukka campus, and its surrounding areas.The acquired resistivity data were interpreted to determine both vertical and horizontal electrical properties.Throughout the subsurface assessment, essential parameters, including reflection coefficient, longitudinal and transverse resistivity, and coefficient of anisotropy,were meticulously computed.The inversion of resistivity data, conducted both in 1-D and 2-D,indicates that the uppermost geoelectric layer consists of materials with notably low resistivity,indicative of high conductivity, likely attributed to an elevated water content.The research has successfully mapped out areas characterized by diverse reflection coefficients.Elevated reflection coefficients suggest the presence of less permeable,dense subsurface materials, potentially impeding water infiltration and retention, whereas reflection coefficients indicate subsurface layers with more permeable materials, facilitating efficient drainage.The observed variations in transverse and longitudinal resistivities point to differences in subsurface geological materials in various directions,directly influencing factors such as water infiltration, drainage, permeability, and runoff.The ranged of anisotropy values from 1.02 to 2.14 indicates substantially directional variability in the subsurface materials in the study regarding conductivity or permeability.This directional variability might be attributed to the alternating sequence of sand and clay present in the area.The high porosity and low permeability of clay are instrumental in governing the seepage of water into the subsurface.These findings support the classification of the study area as an anisotropic medium.The ERT profiles depict variations in resistivity both vertically and horizontally, highlighting notably low resistivity in the upper layers.These results have significant implications for understanding flooding patterns, especially during the rainy season..The identification of a sandy-clay layer with low resistivity is one of the key findings, as it serves as a primary factor contributing to flooding, particularly during periods of increased rainfall.The holistic approach of integrating these methods has delivered valuable insights into subsurface hydrogeological conditions within the study area.This knowledge is contributory in identifying areas with diverse subsurface materials or structures that significantly influence water movement, retention, permeability, drainage, and surface runoff during flooding events.
Acknowledgements
The authors are grateful to Tetfund (TET/DR&D/CE/UNI/NSUKKA/BR/2020/VOL.1) for sponsoring the research work.We thank Prof.Anene of the University of Nigeria, Nsukka, for his encouragement.
- 地下水科學與工程(英文版)的其它文章
- Influence of water conservancy project on runoff in the source region of the Yellow River and wetland changes in the Lakeside Zone, China
- Factors driving surface deformations in plain area of eastern Zhengzhou City, China
- Analytical solution for Non-Darcian effect on transient confined-unconfined flow in a confined aquifer
- Using geospatial technologies to delineate Ground Water Potential Zones(GWPZ) in Mberengwa and Zvishavane District, Zimbabwe
- Simulation of thermal breakthrough factors affecting carbonate geothermalto-well systems
- Effects of coal mining and tunnel excavation on groundwater flow system in karst areas by modeling: A case study in Zhongliang Mountain,Chongqing, Southwest China