
Development of aperiodic multilayer mirrors operated at W-Lβ line for plasma diagnostics application
2024-01-15 11:07ZeHuaYangJingTaoZhuZhongLiangLiHongXinLuoShangYuSiYunPingZhuLiZhaoKuanRenFengWangRongQingYi
Nuclear Science and Techniques 2023年11期
Ze-Hua Yang · Jing-Tao Zhu · Zhong-Liang Li · Hong-Xin Luo · Shang-Yu Si · Yun-Ping Zhu · Li Zhao ·Kuan Ren · Feng Wang · Rong-Qing Yi
Abstract Multilayer interference mirrors play a pivotal role in spectroscopic diagnostic systems, which probe electron temperature and density during inertial confinement fusion processes.In this study, aperiodic Mo/B4C multilayer mirrors of varied thicknesses were investigated for X-ray plasma diagnostics at the 9.67-keV W-Lβ line.The thickness distribution of the aperiodic multilayers was designed using the first Bragg diffraction condition and then optimized through a simplex algorithm to realize a narrow bandwidth and consistent spectral response.To enhance spectral accuracy, further refinements were undertaken by matching the grazing incidence X-ray reflectivity data with actual structural parameters.X-ray reflectivity measurements from the SSRF synchrotron radiation facility on the optimized sample showed a reflectivity of 29.7 ± 2.6%, flat-band range of 1.3 keV, and bandwidth of 1.7 keV, making it suitable for high-temperature plasma diagnostics.The study explored the potential of predicting the 9.67 keV reflectivity spectrum using the fitting data from the grazing incidence X-ray reflectivity curves at 8.05 keV.Additionally, the short-term thermal stability of an aperiodic multilayer was assessed using temperaturedependent in situ X-ray measurements.Shifts in the reflectivity spectrum during annealing were attributed to interdiffusion and interfacial relaxation.The research team recommends the aperiodic Mo/B4C multilayer mirror for operations below 300 ℃.
Keywords X-ray multilayer mirror · Aperiodic multilayer · Flat response · Sputtering deposition · Synchrotron radiation
1 Introduction
Over recent decades, high-temperature plasma diagnostics has gained significant attention due to its importance in laser inertial confinement fusion (ICF).X-ray optical diagnostics analyzes the spectrum and angular distribution of characteristic emission lines from metals, such as Fe, Cu, and W,at elevated temperatures.This aids in examining hotspot electron temperature and density [1—3].High-resolution X-ray spectroscopy tools are vital for distinguishing signals amidst the intense background radiation in extreme heat.However, practical applications demand that X-ray devices possess several optical properties.These include a sufficient bandwidth to accommodate the variable spectrum and changes in the emission line breadth and position under extreme conditions [4].A consistent spectral response is crucial for accurately capturing and imaging desired emission lines.Additionally, the device’s spectral performance should remain steady under short-term and localized high temperatures, especially during intense X-ray exposures.The W-Lβ emission line was selected as the focal energy point for this analysis because higher photon energy X-rays from the hotspot diminish the interference from the self-emission of ablating materials.
Multilayer interference mirrors, constructed from alternating layers of materials with high and low refractive indices, are fundamental in the X-ray and EUV spectra [5—9].Periodic multilayers maintain a consistent bilayer thickness adhering to the Bragg diffraction conditions, offering high reflectivity in a narrow spectral range due to constructive interference between bilayers [10—13].Conversely, aperiodic structures exhibit variable layer thicknesses that allow phase modulation across a broader spectrum.This type of a design can achieve, for example, a flat reflectance by continuously optimizing thickness distribution [14—16].However,when pursuing this flat spectral response, the reflectivity of Kiessig oscillations, or side lobes, might increase due to random changes in each bilayer’s thickness ratio [17, 18].Suppressing these side lobes during optimization is essential to maintain a high signal-to-noise ratio (SNR) for plasma diagnostics.A design and preparation approach for aperiodic multilayers that achieve a flat spectral response around the 8.05 keV Cu-Kα line has been presented [16].This aperiodic structure was also deemed suitable for extracting the 9.67 keV W-Lβ line.Yet, the energy-dependent reflectivity prediction and optimization method in Reference [16] warrant validation, especially since a standard thin-film laboratory lacks a direct X-ray source for the 9.67 keV W-Lβ line.Predictions made using 8.05 keV data might introduce inaccuracies due to varied interfacial structures, bilayer thicknesses, and densities between X-ray energies (8.05 keV and higher) [19, 20].Errors from 8.05 keV characterizations could also result in significant deviations in predictions.This paper explores the viability of employing the fitted structural parameters from 8.05 keV X-ray measurements to predict optical performance at 9.67 keV.
Aperiodic multilayers were engineered to realize a reflectivity plateau and confined spectral bandwidth at a grazing angle of 0.8°.The Mo/B4C combination was chosen for the multilayer structure over the commonly used W-based multilayers to circumvent pronounced absorption at the W L-edge.The thickness distribution for the aperiodic setup was formulated using the first Bragg diffraction condition and was refined with the simplex algorithm.Grazing incidence X-ray reflectivity (GIXRR)measurements ascertained the precise thickness distributions and interfacial widths of the fabricated samples.By harnessing the structural data from the GIXRR curve fits,the reflectivity spectrum was projected, considering specified roughness and density of the aperiodic multilayers.The energy-responsive X-ray reflectivity of the refined multilayer mirror was assessed to validate the proposed prediction approach.The aperiodic multilayer’s optical performance and its thermal stability were analyzed through in situ X-ray evaluations at varying annealing temperatures.
2 Methods and experiments
The design of aperiodic multilayers necessitates finding the optimal layer thickness distribution for the stack.This optimal configuration is achieved by starting with a suitable initial array of layer thicknesses and then refining it through numerical optimization.Various methods can inform the initial array selection, including the periodic sequence [16], block-periodic method [21], depth-grade sequence [22], or specialized algorithms [23, 24].Numerical optimization techniques encompass the genetic algorithm, degenerate algorithm, and simplex algorithm.Given the stringent requirements for the full width at half maximum (FWHM) of the reflectivity curves and constraints on the total number of bilayers, this study employed a design approach using an initial array based on the periodic sequence that satisfies the first Bragg diffraction.This was further optimized using the simplex algorithm for the aperiodic multilayer design.
Optimization hinges on minimizing a merit function that represents the disparity between the desired reflectivityR0and the calculated reflectivityR[15].In this research, the merit function MF, which encompasses both range flattening and side lobe suppression, is articulated in Eq.(1).The initial term focuses on achieving a uniform reflectivity plateau.Here,Eidenotes a discrete photon energy point within the response domain, andmsignifies the total count of discrete energy points assessed within that domain.The subsequent term is utilized to suppress sidelobes beyond the flat-band domain.Ejrepresents a discrete photon energy point outside the response domain, whilendenotes the aggregate of discrete energy points beyond the said domain.Within this energy spectrum, the desired reflectivityR0is set at zero.The coefficientaserves to balance the importance between central flattening and sidelobe suppression.
The aperiodic multilayers comprised a total of 50 layers, a balance struck between attaining high theoretical reflectivity and managing the cumulative effects of interfacial width.During the optimization of these multilayers, all layer thicknesses, defined in an array, acted as the variables to be optimized, with a set range between 1.7 and 4.5 nm.Initially, each interface width was considered zero,and material density was based on its bulk density.For further refinement, specific roughness and density values were informed by experimental data.Figure 1 illustrates the computed reflectivity curves for both periodic and aperiodic Mo/B4C multilayers, each having 50 layers, at a grazing angle of 0.8°.The spectral center for each multilayer mirror aligned at 9.67 keV, in line with the targeted energy point.The reflectivity curve of the aperiodic multilayer showcased the sought-after reflectivity plateau.Notably, its FWHM was no greater than triple that of the periodic multilayer.Computational outcomes revealed a designed reflectivity of (36.9 ±0.1%) within a flat-band span of 1.2 keV.The target FWHM was established at 1.5 keV to encompass the variable spectral line and offer a suitable field angle.

Fig.1 Energy-dependent reflectivity of the periodic and aperiodic Mo/B4C multilayers at a grazing angle of 0.8°
Samples of multilayers were fabricated on 20 ×20 mm ultra-smooth silicon substrates using direct-current (DC) magnetron sputtering.These substrates exhibited a surface roughness of approximately 0.3 nm.The system was maintained at a base pressure below 2×10—4Pa, while the working pressure with high-purity Ar sputtering gas was maintained at 1.5 ×10—1Pa.The sputtering powers were set at 40 W for the B4C target and 20 W for the Mo target.The thickness distribution of the sputtered aperiodic multilayers mirrored that of the computational models.To calibrate the deposition rate for each target,periodic Mo/B4C multilayers with varying bilayer thicknesses were deposited.The calibration utilized periodic multilayers with a consistent count of 10 bilayers.These were categorized into two sets: samples 1—4 exhibited varying B4C thicknesses with Mo layers held at an approximate thickness of 3.8 nm,and samples A—D exhibited variable Mo thicknesses with a consistent B4C layer thickness close to 3.0 nm.The thicknesses and interfacial widths of these periodic Mo/B4C multilayers were determined using GIXRR measurements.With a stable magnetron sputtering apparatus, the deposition rate of a single target is effectively consistent.Thus, layer thickness correlates linearly with deposition duration.The deposition process was meticulously monitored to ensure sub-angstrom precision in deposition.
GIXRR measurements, utilizing theω-2θspecular geometry, were conducted using a PanalyticalEmpyreanXRD diffractometer, equipped with a superior Cu-Kα line X-ray source at 8.05 keV.For each GIXRR curve, individual fittings were performed five times to yield an average for the fitting parameters.Energy-dependent reflectivity evaluations were conducted at the BL09B beamline of the SSRF, spanning a photon energy range of 8.5—11.5 keV.The BL09B beamline employs a sequence of optical devices, including a double crystal monochromator (DCM), compound refractive lens (CRL), and a toroidal mirror (TM), delivering high-resolution X-rays that cover the 5—40 keV range with a minimal unfocused spot measuring less than 300 μm (V)× 500 μm (H) [16, 25].During the experiments, the reflectivity intensity was gauged using a four-circle diffractometer, paired with a slit and PIN diode, throughout the DCM energy scan.The ratio of the reflective beam’s measured current to the direct beam’s current determined the reflectivity.In situ X-ray reflectivity assessments at varying temperatures were facilitated using a computer-controlled hot stage located outside the experimental hutch.This hot stage was situated inside a sealed chamber, equipped with two gas conduits for generating a gas flow environment.Pure helium served as the shielding gas during these thermal procedures.In the course of the experiment, the multilayer sample atop the heat stage underwent continuous annealing at intervals of 100 ℃, 200 ℃, 300 ℃, and 400 ℃, each for 10 min.The temperature ramp rates for both heating and cooling were set at 100 ℃/min.Energy-dependent X-ray reflectivity curves were captured at each designated temperature.
3 Experimental results and discussion
Figure 2a displays the GIXRR curves for samples 1—4,while Fig.2b depicts those for samples A—D.The specular reflectivity curves feature numerous distinct Bragg peaks, suggesting the formation of coherent and continuous interfaces by the periodic Mo/B4C multilayers.Structural parameters of the periodic Mo/B4C samples—including layer thickness, density, and interfacial width—were determined using Parratt’s standard formula paired with the Névot—Croce factor [26, 27], facilitated by a genetic algorithm.The derived data are compiled in Table 1.The fitted thicknesses for the Mo and B4C layers correlate linearly with deposition time, exhibiting a coefficient of determination surpassing 0.999.Nonetheless, the fitted density does not maintain a linear relationship as Mo or B4C thickness increases.This phenomenon might be due to the growth of Mo crystals and the subsequent interdiffusion between neighboring layers [28].For samples A—D, the fitted interfacial width of the B4C-on-Mo interface remains nearly consistent with increasing Mo layer, likely due to the minimal bombardment from the settling B4C clusters.In contrast, in samples 1—4, the Mo-on-B4C interface reveals unpredictable variations, attributed to the elevated kinetic and surface energies of the settling Mo atoms.For the spectral analysis of aperiodic multilayers, averages of the fitted parameters are pivotal.Notable averages include interfacial width means ofσMo= 0.30 nm andσB4C= 0.45 nm, as well as density averages ofρMo= 0.93 andρB4C= 1.
The GIXRR curves of the aperiodic Mo/B4C multilayer were analyzed to discern the actual thickness distribution.Figure 3a depicts the GIXRR curve as blue dots, while the predicted reflectivity curve is illustrated by a black dotted line.Instead of using direct light intensity, the GIXRR curve was normalized to the peak of total external reflection to eliminate the horizontal size effect stemming from a line spot.The designed aperiodic multilayer, which was intended for a flat response around 9.67 keV, displayed an intrinsic figure error in the flat-band region at 8.05 keV in the calculated curve.The GIXRR measurement reveals a response range from 0.87° to 1.02°, with an observed average reflectivity of 28.0%, which is slightly lower than the predicted 32.4%.Although the angular positions of the response center and sidelobe peaks in Fig.3a align with theoretical expectations, suggesting a consistent thickness distribution, a noticeable dip in the reflectivity plateau—with a peak deviation of 8.6%—suggests potential errors in effective thickness and interfacial impacts.To probe the origins of this spectral dip, the GIXRR curve was fitted to determine the thickness distribution.In this fitting process,the interfacial width was held constant to sidestep further discrepancies in the fitted thickness distribution.This constant interfacial width was based on the average from the fitted data of the periodic Mo/B4C multilayers.

Fig.2 (Color online) GIXRR curves at 8.05 keV of the periodic multilayers a GIXRR curves of samples 1—4.In this group, the thickness of Mo layers is constant, while that of B4C layers is variable.b GIXRR curves of samples A—D.In this group, the thickness of B4C layers is constant while that of Mo layers is variable.The black dots indicate the experimental data, while the red solid lines present the fitting curves

Table 1 GIXRR-fitted layer thicknesses (d), density (ρ), and interfacial width (σ) of the Mo/B4C multilayers

Fig.3 (Color online) a GIXRR curve and calculated curve at 8.05 keV of the aperiodic multilayer.b The design and fitting of thickness distribution.Solid dots denote B4C thickness data and hollow dots denote Mo thickness data
In Fig.3a, the fitting curve closely aligns with the GIXRR measurements.Meanwhile, Fig.3b displays the average of five repeated fitting data points, represented by red square dots.The desired thickness distribution is illustrated by blue round dots.To offer a clearer insight into the fitting variance, an error bar has been included for the thickness sequence across more than 50 variables.Calculations indicate that the maximum deviation in layer thicknesses does not exceed 0.25 nm, with an average random deviation of 0.08 nm, equating to approximately a 3.0% relative deviation.However, for other Mo/B4C aperiodic samples that were prepared using consistent parameters, the GIXRR measurements consistently showed the same spectral characteristics.This suggests that the spectral depression cannot be solely attributed to random deposition errors.The effect of interfacial width was also assessed, with estimates placing it between 0.3 and 1.0 nm to account for the potential peak roughness accumulation.Although this contributes to the pronounced attenuation of reflectivity, it does not appear to correlate directly with a noticeable error in the reflectivity profile.
The observed depression in the GIXRR curve may result from the interdiffusion between the adjacent Mo and B4C layers, leading to a phase error in the constructive interference.This phase mismatch is evident in the fitting density.In the fitting data for the periodic samples, the density of the Mo layers rises from 90 to 96% as the Mo thickness increases from 1.78 to 3.11 nm.Conversely, the B4C density shows an inconsistent variation, ranging from 90.1 to 110%with increasing B4C thickness.In this context, the deviation in density can be associated with a noticeable figure error in the reflectivity profile, mirroring the effects of random thickness deviation.
Given that the stable compound at the Mo/B4C multilayers’ interfaces has not been uniquely identified among the contenders—MoB, MoB2, and Mo2C—there is not a standard value for the optical constants of the interdiffusion zones to refer to.Consequently, the fitting densities of the Mo and B4C layers were utilized to depict the additional phase effects of these interdiffusion layers.The thickness distribution of the aperiodic Mo/B4C multilayer was finetuned based on a specified interfacial width and density to enhance the spectral performance.Incorporating these fixed parameters as optimization constraints inevitably complicates achieving a stable solution.To strike a balance, we tweaked parameterain the merit function MF to emphasize response flattening, thereby fostering higher low-angle side lobes in the reflectivity curves.The fixed parameters were drawn from the fitting data of the periodic Mo/B4C samples,notably the average interfacial width ofσMo= 0.30 nm andσB4C= 0.45 nm, along with the average densities ofρMo=0.93 andρB4C= 1.The revised design was produced under identical preparation conditions as the original sample.Figure 4 displays the GIXRR measurements of the enhanced sample, denoted by the red dotted line.Notably, the original depression was markedly mitigated, yielding a more consistent response within the angle range of 0.88—0.98°.However, the spectral response presented undulating variances and a noticeable gradient near its diminishing edge.This observed discrepancy in the GIXRR curve primarily stems from the fluctuating diffusion zone with the expansion of bilayer thickness, diverging from a static state in the design.The low-angle side lobes span the angle range of 0.6—0.75°,resulting in a diminished SNR for the imaging diagnostic experiment.Luckily, this segment of the spectral response can be effortlessly isolated using the basic structure of an optical system.Meeting the optical specifications for X-ray optical diagnostics, the energy-dependent reflectivity curves for this sample series were subsequently analyzed.
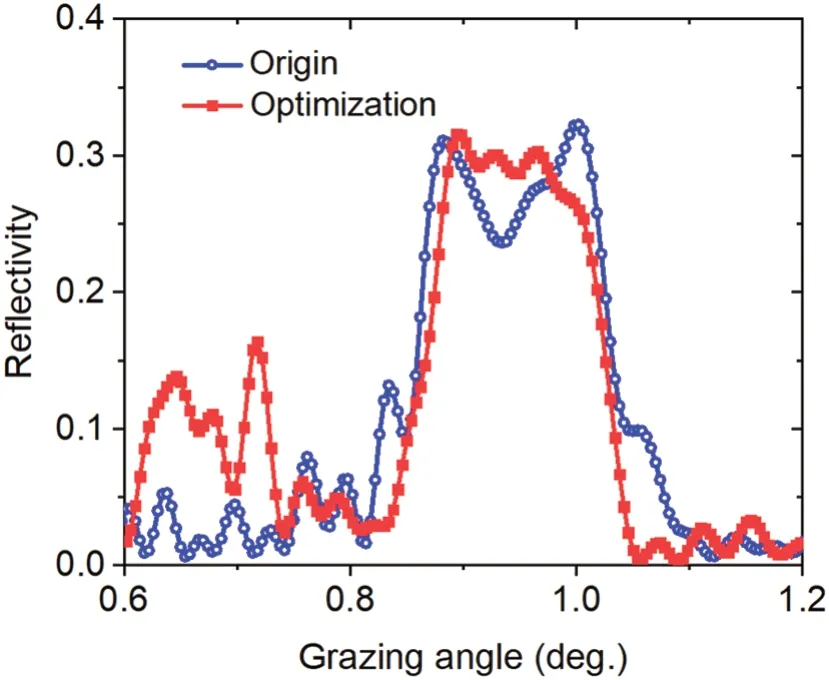
Fig.4 (Color online) GIXRR curves at 8.05 keV of the original sample and the optimized sample
Figure 5 presents the energy-dependent spectrum of the optimized sample, as recorded at SSRF BL09B.There is an evident shift in the measured reflectivity profile, pushing toward the high-energy direction by approximately 300 eV in comparison with the design.This shift is largely due to the incident angle error during the measurement, with a 300-eV shift equivalent to a minor angle error of 0.03°.This type of an error was induced by the uneven surface of the sample stage.The full width spans from 9.3 to 10.6 keV,a total of 1.3 keV, while the full width at half maximum(FWHM) of the reflectivity peak measures 1.7 keV.The average reflectivity on the plateau reads 29.7%, below the projected 36.9%; the uncertainty of this measurement is roughly 0.2%.The fluctuation in reflectivity within the flat response was between ± 2.6%.The curve derived from the GIXRR measurement fitting data is depicted as a solid line in Fig.5.Structural and interfacial parameters were fixed in the design, specifically,σMo= 0.30 nm andσB4C= 0.45 nm for average interfacial width, andρMo= 0.93 andρB4C= 1 for average density.The grazing angle was set at an actual angle of 0.77°.This calculated curve aligns well with the experimental data, signifying that predicting energy-dependent X-ray reflectivity with GIXRR fitting data is feasible.Yet, the calculated reflectivity profile is not entirely accurate, especially for photon energy regions above 10 keV.This discrepancy could be due to the heightened sensitivity of high-energy X-rays on thin-layer structures (exceeding 8.05 keV).The relative discrepancies between the predictive and measured curves are 4.4% for average reflectivity,7.1% for flat-band width, 5.1% for reflectivity fluctuation,and 1.4% for FWHM.

Fig.5 (Color online) Measured and calculated reflectivity spectra of the optimized Mo/B4C multilayer at an incident angle of 0.77°

Fig.6 (Color online) Measured and calculated reflectivity curves of the Mo/B4C multilayer upon the in situ thermal annealing.The grazing incident angle is 0.8°.The color dots indicate the experimental data, while the red solid lines denote the calculated curves.The sample aligns with the series of the optimized aperiodic design
Figure 6 depicts the energy-dependent reflectivity curves of the Mo/B4C multilayer during the in situ thermal process,represented by hollow dots.The samples tested were created with identical thickness distribution and preparation parameters as the optimized design.The reflectivity curve’s response range at a room temperature of 25 ℃ aligns with the calculated data, signifying that the grazing incident angle was precisely maintained at 0.8°.As the annealing temperature rose, the bilayer thickness of the aperiodic multilayer exhibited an overall increase, causing the flat-band center of the reflectivity curves to shift consistently toward the low-energy side.The annealing process also influenced the average reflectivity within the response range: there was a notable increase in average reflectivity when the annealing temperature rose from 25 to 200 ℃, which then dropped for temperatures above 200 ℃.Several studies on periodic Mo/B4C multilayers have documented significant interdiffusion in layer thickness and interface evolution [29—31].These studies highlighted that the B4C thickness dictates the dual paths of thickness evolution due to interdiffusion depth, specifically period expansion for periods with a thick B4C layer and period contraction for those with a thin B4C layer [30].The pivotal thickness for these evolution directions fluctuates between 1.5 and 2 nm, contingent upon the annealing temperature and duration.Given this, the aperiodic multilayer’s thickness distribution, which spans 1.7—4.5 nm, could exhibit dual evolution directions under identical temperature conditions as their periodic counterparts.With brief annealing at lower temperatures, the diffusion length of the surplus Mo atoms does not suffice to entirely replace the neighboring B4C layer, leading to the formation of low-density compounds in interfacial regions, thus contributing to an overall thickness increase.This period expansion also dominates the thickness evolution at the elevated temperature of 400 ℃.Nevertheless, in some bilayers, the interdiffusion spanned almost the full extent of the B4C layer with a thickness below 2 nm, inducing densification and period contraction.This contradictory evolution in these bilayers, set against an overall expanding thickness sequence, could introduce further phase match errors across the intended flat-band area.A discernible figure error became evident in the reflectivity curve when annealed at 400 ℃.To gauge interface evolution,the curves derived from the GIXRR measurement fitting data are illustrated as red lines in Fig.6.The simulated data reveal a decline of several angstroms in the interfacial width at temperatures below 200 ℃, a consequence of roughness relaxation during the thermal process.However, as temperatures continued to increase, the interfacial width steadily expanded due to the significant growth of interlayers.Given that the central energy of the reflectivity plateau must remain around 9.67 keV, it is advisable for aperiodic Mo/B4C multilayers to function at temperatures not exceeding 300 ℃.
4 Conclusion
This study introduced an aperiodic Mo/B4C multilayer mirror designed for operation at 9.67 keV (W-Lβ line), featuring a reflectivity plateau with a narrow bandwidth.Initially,the thickness distribution of this aperiodic multilayer was conceived via Bragg diffraction and later refined via a merit function paired with the simplex algorithm.The projected reflectivity curve reveals a design reflectivity of 36.9%alongside a flat-band width of 1.2 keV.Adhering to a calibrated deposition rate, we fabricated aperiodic Mo/B4C multilayers on ultra-smooth silicon substrates via DC magnetron sputtering.Fitting data suggest that the mean deviation in thickness distribution was around 3.0%.Further optimizations were made to the aperiodic Mo/B4C multilayer’s thickness distribution, considering specific roughness and density, to enhance spectral performance.The GIXRR curve for the enhanced sample demonstrated a notable improvement in response consistency.The energy-dependent X-ray profile of this improved sample was captured at the SSRF, revealing an average reflectivity of 29.7% and a fluctuation margin of ± 2.6%.The flat-band width spans 1.3 keV from 9.3 to 10.6 keV, and the FWHM measures 1.7 keV—showing potential for high-temperature plasma diagnostic applications.The prediction curve derived from GIXRR fitting data aligns closely with experimental findings, barring a minor discrepancy in the region above 10 keV.Disparities between computed results and actual measurements remained under 10% for primary structural parameters, underscoring the viability of this method for X-ray spectrum prediction.Energydependent X-ray reflectivity assessments during annealing recorded a general shift of the flat-band response area toward the low-energy side, linked with the prevalent period expansion.The observed transformations in thickness and interface can be attributed to interdiffusion and interface relaxation dynamics.This evaluation of thermal stability suggests an optimal operational temperature of 300 ℃ for the aperiodic Mo/B4C multilayers.
Author contributions All authors contributed to the study conception and design.Material preparation, data collection and analysis were performed by Ze-Hua Yang, Jing-Tao Zhu, Shang-Yu Si, Yun-Ping Zhu and Zhong-Liang Li.Experimental resources and funding were provided by Jing-Tao Zhu, Hong-Xin Luo, Li Zhao, Kuan Ren,Feng Wang, Rong-Qing Yi.The first draft of the manuscript was written by Ze-Hua Yang, and all authors commented on previous versions of the manuscript.All authors read and approved the final manuscript.
Data availability The data that support the findings of this study are openly available in Science Data Bank at https:// www.doi.org/ 10.57760/ scien cedb.10936 and https:// cstr.cn/ 31253.11.scien cedb.10936.
Declarations
Conflict of interest The authors declare that they have no competing interests.
 Nuclear Science and Techniques2023年11期
- Nuclear Science and Techniques的其它文章
- Effective extraction of photoneutron cross-section distribution using gamma activation and reaction yield ratio method
- Gravitational wave echoes from strange quark stars in the equation of state with density-dependent quark masses
- Pseudo-rapidity distributions of charged particles in asymmetric collisions using Tsallis thermodynamics
- Pairing effects on the fragment mass distribution of Th, U, Pu, and Cm isotopes
- Dynamic evaluation of a scaled-down heat pipe-cooled system during start-up/shut-down processes using a hardware-in-the-loop test approach
- A method for correcting characteristic X-ray net peak count from drifted shadow peak