
Rice Variety Classification Based on Optimized Near-Infrared Spectral Classification Model
2024-03-09 08:34YangSenWangZhenminZhangHouqingSongWenlong
Rice Science 2024年1期
Yang Sen, Wang Zhenmin, Zhang Houqing, Song Wenlong
Letter
Rice Variety Classification Based on Optimized Near-Infrared Spectral Classification Model
Yang Sen1, Wang Zhenmin1, Zhang Houqing2, Song Wenlong1
(College of Computer and Control Engineering, Northeast Forestry University, Harbin 150040, China; The 49th Research Institute of China Electronics Technology Group Corporation, Harbin 150000, China)
Accurate classification of rice variety is essential to ensure the brand value of high-quality rice products. Considering the impact of sample state on modeling optimization algorithms, rice samples after grinding and sealing were selected.To enhance the accuracy of rice variety classification, we introduced a spectral characteristic wavelength selection method based on adaptive sliding window permutation entropy (ASW-PE), and combined it with spectral preprocessing methods and classification models to conduct global optimization research on four rice varieties: Wuchang (WC), Xiangshui (XS), Yinshui (YS), and Yueguang (YG). ASW-PE significantly improved the classification modeling accuracy, achieving at least a 3.12% increase when compared with the other five traditional methods. Through the combination of independent steps and global optimization, we determined the optimal characteristic wavelength range for four rice varieties to be 4755–4948 cm-1, achieving a classification accuracy ranging from 92.5% to 100.0%.
High-quality rice products are highly sought after by consumers due to their nutritional value, quality, and taste characteristics, presenting significant market potential (Mishra et al, 2021; Chen et al, 2022). Unfortunately, unscrupulous traders attempt to maximize profits by blending high-quality rice with other non-high-quality rice (Bazoni et al, 2017; da Silva Medeiros et al, 2022). These actions not only tarnish the reputation and popularity of high-quality rice products, but also infringe upon the legitimate rights and interests of high-quality rice growers (Salgó and Gergely, 2012; Cruz-Tirado et al, 2021; Yang, 2021). Consequently, consumers, retailers, producers, and government agencies face a pressing need for accurate classification of high-quality rice varieties (Cassells et al, 2007).Numerous researchers have conducted comprehensive studies on rice variety classification, employing various methods such as inorganic element analysis (Li et al, 2016), near-infrared spectroscopy (Barbin et al, 2016; Song et al, 2017; Qian et al, 2018; Srinuttrakul et al, 2021), Raman spectroscopy (Sha et al, 2019), plasma mass spectrometry (Qian et al, 2019), and hyperspectral analysis (Lin et al, 2020). Among these methods, near-infrared spectroscopy is the most extensively studied. Liu et al (2020) explored the feasibility of discriminating adulterated WCrice using near-infrared two-dimensional correlation spectroscopy.Miao et al (2021) investigated an effective method for distinguishing rice from different storage years using near-infrared spectroscopy combined with chemometric methods. Tong et al (2021) developed a rapid identification method for determining the variety and origin of commercial rice grains based on Fourier transform near-infrared diffuse reflectance spectroscopy. Srinuttrakul et al (2021) achieved the authenticity and geographical origin detection of Thai Hom Mali rice through attenuated total reflection Fourier transform infrared spectroscopy and near-infrared spectroscopy. In research on rice variety classification based on near-infrared spectroscopy, the process typically involves special sample pretreatment, followed by spectral data, including spectral preprocessing, spectral characteristic selection, and spectral data classification. This comprehensive approach ultimately enables accurate classification of rice varieties. Nevertheless, existing research on rice varietyclassification using near-infrared spectroscopy primarily focuses on method implementation and classification of different varieties, often overlooking the optimization of individual steps and their combinations in the classification process, which could directly enhance the accuracy of rice variety classification.
To address the aforementioned issues, we aimed to achieve optimal classification of rice varieties by optimizing individual and combined steps.The specific research is divided into the following parts: (1) We studied and determined the optimal combinations of various spectral pretreatment methods and classification modeling methods; (2) We proposed a characteristic wavelength selection method for rice spectral data based on ASW-PE to enhance the selection performance of characteristic wavelengths; and (3) We achieved the optimal classification of measured samples based on a variety of classification models, catering to different measurement requirements.
The original spectral curves of the training set samples from four rice varieties are shown in Fig. 1-A. Each spectral curve of a single sample consisted of a total of 1972 data points, with spectral wavelengths ranging from 4000 to 7800 cm-1. To examine the adaptability of different pretreatment methods in rice classification models, we established a rice variety classification model using various pretreatment methods (Fig. 1-B). The classification models included partial leastsquares (PLS), particle swarm optimization support vector machine (PSO- SVM), and random forest (RF), which are commonly employed in rice variety classification. The selected pretreatment methods encompassed standard normal variate (SNV), equalization, normalization, and standardization. We employed the coefficient of determination (2) and root mean square error (RMSE) as the experimental evaluation criteria.The training set samples were used for modeling data, and the test sets were used to assess the optimal combination of pretreatment and classification methods. As depicted in Fig. 1-B, for classification models based on PLS and RF, the adoption of standardized pretreatment yielded the highest2and the smallest RMSE. In contrast, for classification models based on PSO-SVM, SNV preprocessing resulted in the highest2and the smallest RMSE. Consequently, in subsequent classification modeling, the input data for PLS and RF classification models underwent standardized preprocessing, while the input data for PSO-SVM classification models underwent SNV preprocessing.
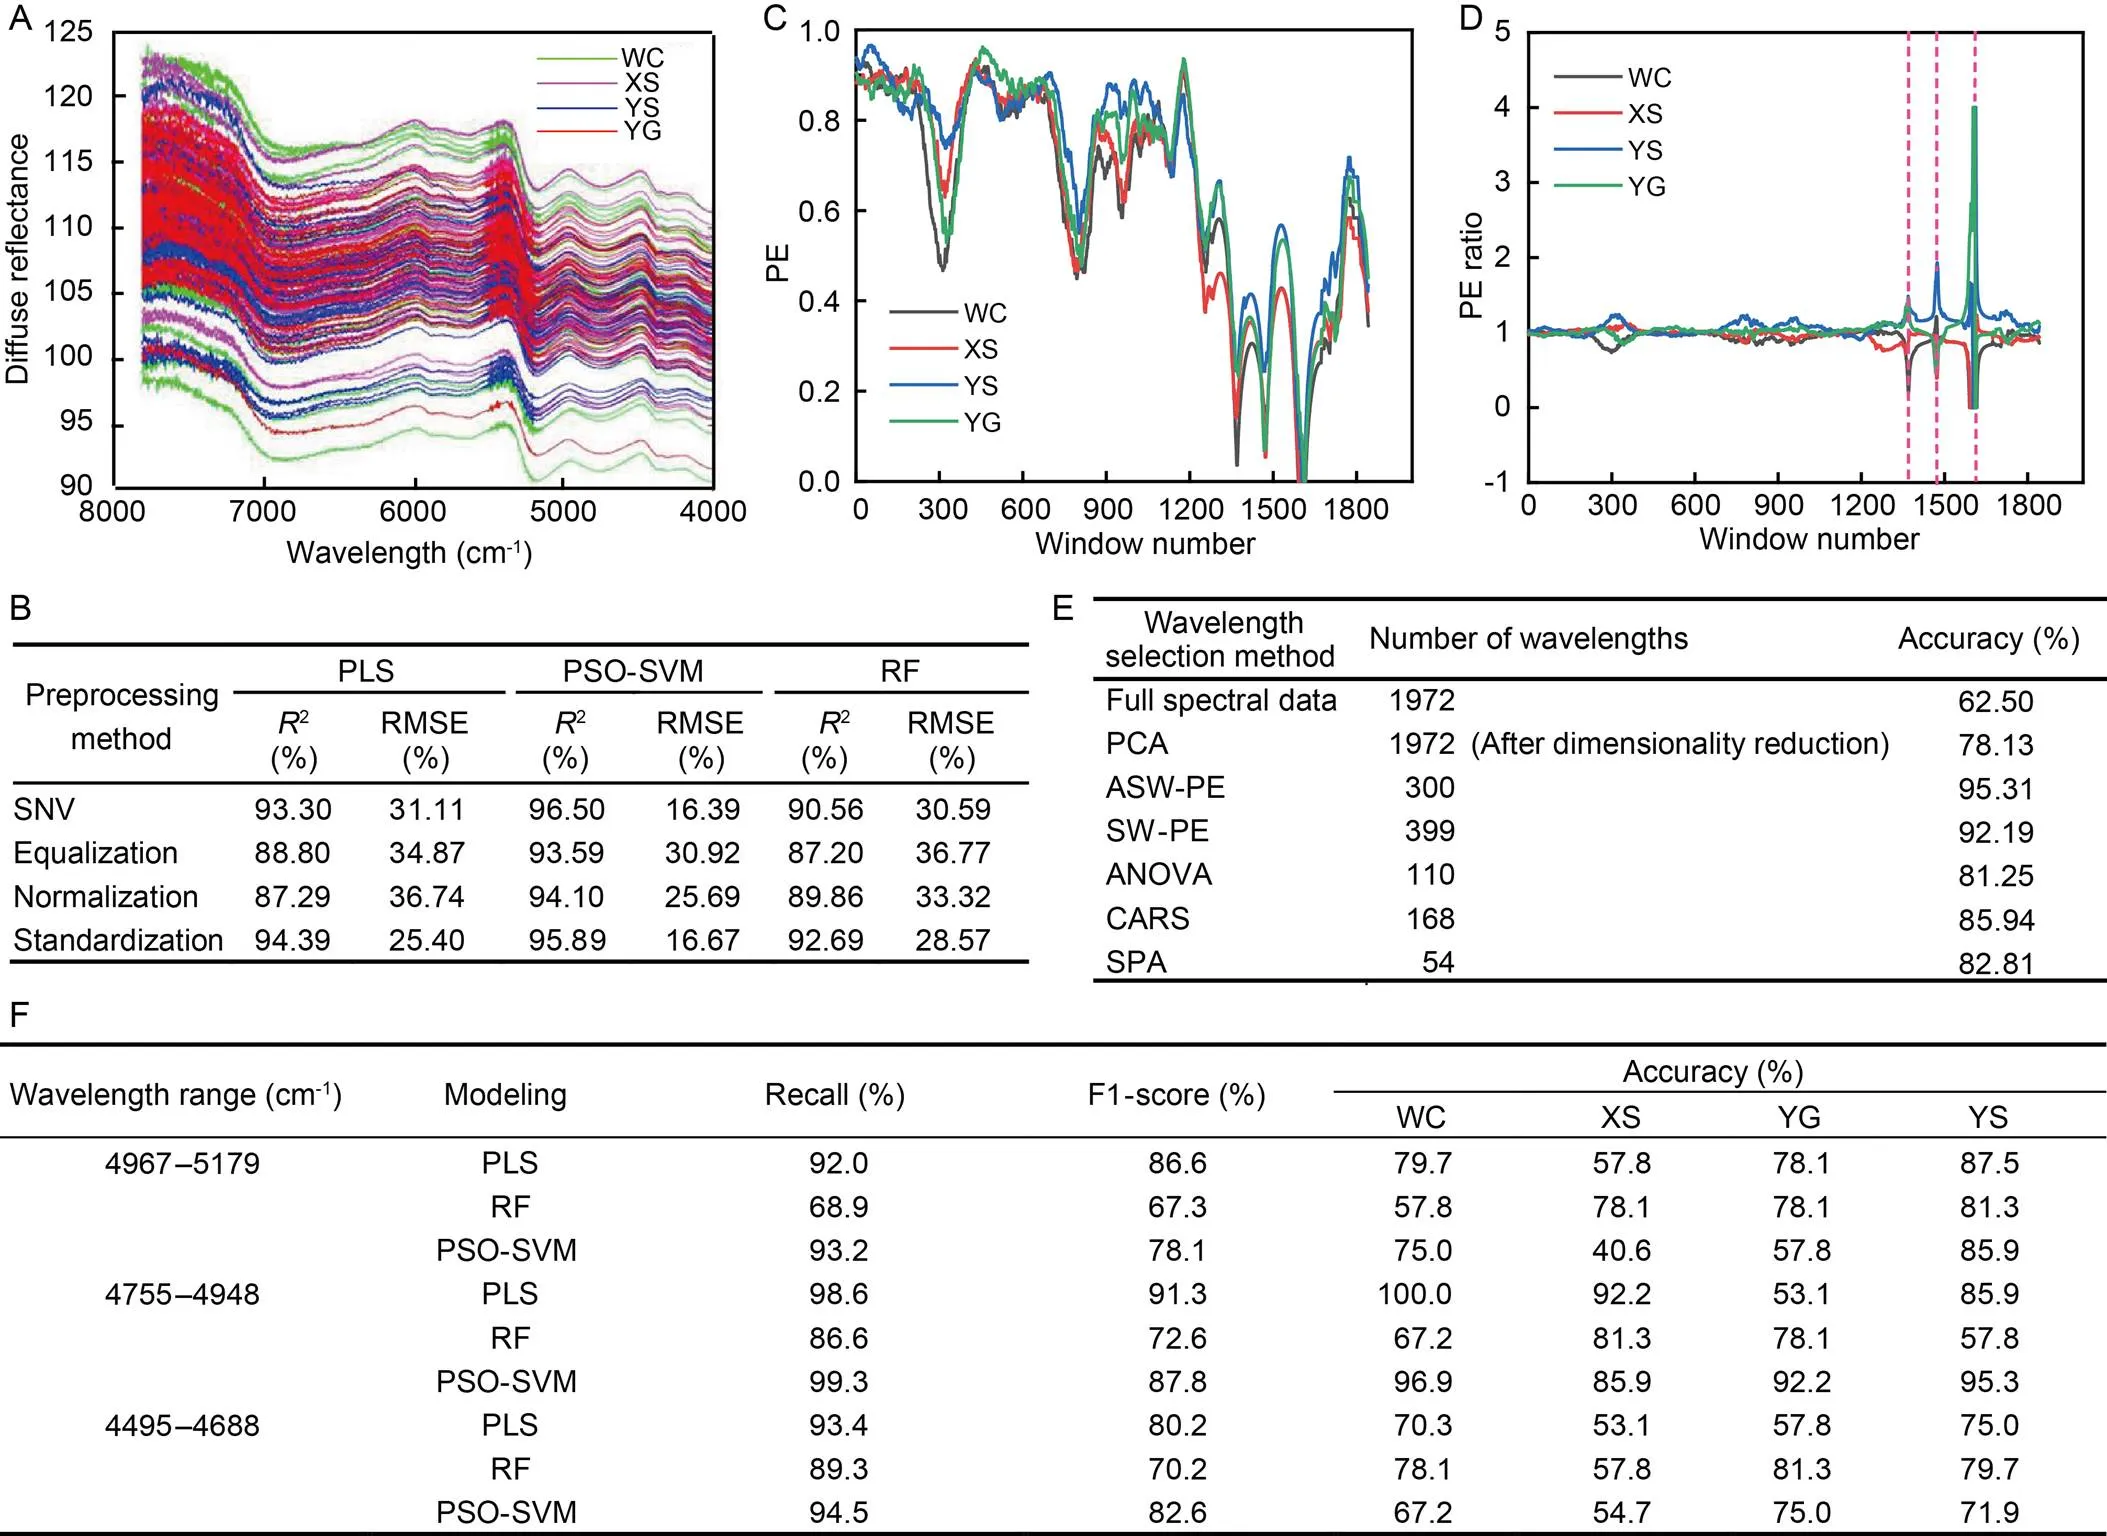
Fig. 1. Spectral data, data processing, and index analysis of four rice varieties.
A, Original spectral curves of grinding sample offour rice varieties. B,Classification accuracy of different preprocessing methods under different classification models. C,Four kinds of ricegrinding sample spectral (PE) values obtained based on the ASW-PE algorithm. D, Four kinds of ricegrinding sample spectral PE ratios obtained based on the ASW-PE algorithm. E,Rice variety classification accuracy based on full spectral data and six characteristic wavelength selection algorithms. F,Classification ability of rice variety under different classification modeling methods. WC, XS, YS, and YG represent rice varieties Wuchang, Xiangshui, Yinshui, and Yueguang, respectively. SNV, Standard normal variate; PLS, Partial leastsquares; PSO-SVM, Particle swarm optimization support vector machine; RF, Random forest;2, Coefficient of determination; RMSE, Root mean square error; PE, Permutation entropy; PCA, Principal component analysis; ASW-PE, Adaptive sliding window permutation entropy; SW-PE, Sliding window permutation entropy; ANOVA, Analysis of variance; CARS, Competitive adaptive reweighted sampling; SPA, Successive projection algorithm.
To enhance the overall performance of the model through spectral characteristic wavelength selection and data dimension reduction, we introduced a characteristic wavelength selection method based on ASW-PE. The characteristic wavelength selection process comprised the following steps: (1) Initialization of sliding window parameters [Window width (W) is 130; step size (s) is 1 in this experiment] and permutation entropy (PE) algorithm parameters [Embedded dimension (m) is 4; delay time (τ) is 1]. Subsequently, adaptive sliding segmentation of time series was performed based on the window forgetting index to obtain sub-sequences. The time series in this experiment consisted of data from four types of rice grinding samples after near-infrared spectroscopy pretreatment. (2) Phase space reconstruction of the subsequences was carried out, and the reconstructed components were sorted in an ascending order. (3) The relative frequency! was calculated and the valuewas taken as the probability of this component. (4) The PE value of the rice sample was determined as the sum of the information entropy of the spectral subsequence components. The optimal window and characteristic wavelength were selected based on the PE ratio (|PE ratio| > 1.5). It should be noted that the PE ratio represents the value of the spectrum of a single rice variety divided by the average of the spectra of the four rice varieties. To better illustrate the differences in spectral PE values among the grinding samples of the four rice varieties, we employed the PE ratio for analyzing the distinctions between sequences. As shown in Fig. 1-C, a total of 1872 window sequences were generated by the sliding window, and the PE values of the near-infrared spectra of the four types of rice grinding samples exhibited substantial overlap. However, in Fig. 1-D, it was evident that the differences in PE values were more effectively analyzed through the use of the PE ratio, with a more pronounced peak. Three window sequences numbered 1360, 1480, and 1615 were selected based on the absolute PE ratio of the four rice spectra, each exceeding 1.5. These corresponded to characteristic wavelength ranges of 4967 to 5179 cm-1, 4755 to 4948 cm-1, and 4495 to 4688 cm-1, resulting in a total of 300 characteristic wavelength points.
To evaluate the performance of the ASW-PE algorithm, it was compared with SW-PE (Liu et al, 2020; Feng et al, 2021), analysis of variance (ANOVA), successive projection algorithm (SPA), competitive adaptive reweighted sampling (CARS),and principal component analysis (PCA). Modeling data, including selected characteristic wavelengths, full spectra,and reduced-dimension full spectra, were used to establish a rice variety classification model. The performance of the six algorithms in characteristic wavelength selection was evaluated based on model classification accuracy. As depicted in Fig. 1-E, compared with the full spectral data and the full spectral data after dimensionality reduction, the other five characteristic wavelength selection algorithms not only simplified the input data of the classification model but also enhanced the classification accuracy to various degrees. In comparison to traditional SW-PE, ANOVA, CARS, SPA, and PCA algorithms, the ASW-PE algorithm improved the model’s classification accuracy by 3.12%, 14.06%, 9.37%, 12.50%, and 17.18%, respectively. This validated the superiority of the ASW-PE algorithm in characteristic wavelength selection.
To accommodate the measurement requirements for different rice varieties, classification experiments were conducted on test set samples using various classification models to achieve the best classification accuracy for different varieties. The original spectral data were normalized and SNV preprocessed, followed by the selection of characteristic wavelengths using the ASW-PE method. Subsequently, PLS, RF, and PSO-SVM classification models were established based on the three selected characteristic wavelength ranges. Evaluation of the classification models was carried out from three perspectives: recall, F1-score, and classification accuracy.As seen in Fig. 1-F, the three classification models exhibited various classification and generalization abilities for different rice varieties and spectral wavelength ranges. The classification abilities of the three models for rice varieties were weaker in the wavelength range of 4967–5179 cm-1and 4495–4688 cm-1, while those were the strongest in the wavelength range of 4755–4948 cm-1. Therefore, we selected the wavelength range of 4755–4948 cm-1as the optimal characteristic wavelength range. Building PLS, RF, and PSO-SVM models based on these three wavelength ranges recalled up to 98.6%, 89.3%, and 99.3%, as well as F1-scores of up to 91.3%, 72.6%, and 87.8%, respectively. This demonstrated the superiority of PLS and PSO-SVM models in addressing the problem of rice near-infrared spectral classification. It is worth noting that under the same wavelength range, the same classification model exhibited different classification abilities when dealing with different rice varieties, primarily due to algorithm characteristics. Based on the analysis results in Fig. 1-F, it’s apparent that the PSO-SVM classification effect was relatively good when the measurement requirement was to classify four types of rice samples. If the measurement requirement was to distinguish the authenticity of WCorXS, the PLS classification model should be chosen, achieving classification accuracies of 100.0% and 92.2%, respectively. If the measurement requirement was to identify the authenticity of YG or YS, the PSO-SVM classification model should be selected, with classification accuracies of 92.2% and 95.3%, respectively. The optimal classification accuracy for WC, XS, YG, and YS rice varieties, based on multiple classification model strategies reached 100.0%, 92.2%, 92.2%, and 95.3%, respectively.In summary, the use of near-infrared spectroscopy enabled the rapid classification of different rice varieties. The research on optimizing the combination of independent and different steps is more flexible and versatile compared with traditional methods, providing technical support for subsequent research on agricultural product classification.
Acknowledgements
This study was supported by the National Natural Science Foundation of China (Grant No. 61975028), the Natural Science Foundation of Heilongjiang Province, China (Grant No. LH2022E004), and the Postdoctoral Foundation of Heilongjiang Province, China (Grant No. LBH-Z22057).
SUPPLEMENTAL DATA
The following material is available in the online version of this article at http://www.sciencedirect.com/journal/rice-science; http://www.ricescience.org.
File S1. Methods.
Barbin D F, Sobottka R P, Risso W E, Zucareli C, Hirooka E Y. 2016. Influence of plant densities and fertilization on maize grains by near-infrared spectroscopy., 49(2): 73–79.
Bazoni C H V, Ida E I, Barbin D F, Kurozawa L E. 2017. Near-infrared spectroscopy as a rapid method for evaluation physicochemical changes of stored soybeans., 73: 1–6.
Cassells J A, Reuss R, Osborne B G, Wesley I J. 2007. Near infrared spectroscopic studies of changes in stored grain., 15(3): 161–167.
Chen Y B, Wang Z D, Wang C R, Li H, Huang D Q, Zhou D G, Zhao L, Pan Y Y, Gong, Zhou S C. 2022. Comparisons of metabolic profiles for carbohydrates, amino acids, lipids, fragrance and flavones during grain development inrice cultivars., 29(2): 155–165.
Cruz-Tirado J P, Oliveira M, de Jesus Filho M, Godoy H T, Amigo J M, Barbin D F. 2021. Shelf life estimation and kinetic degradation modeling of chia seeds () using principal component analysis based on NIR-hyperspectral imaging., 123: 107777.
da Silva Medeiros M L, Cruz-Tirado J P, Lima A F, de Souza Netto J M, Ribeiro A P B, Bassegio D, Godoy H T, Barbin D F. 2022. Assessment oil composition and species discrimination ofseeds based on hyperspectral imaging and portable near infrared (NIR) spectroscopy tools and chemometrics., 107: 104403.
Feng Y Z, Tang B F, Zhao N. 2021. JTC state detection based on improved multi-scale permutation entropy and fuzzy algorithm., 18(12): 3337–3346. (in Chinese with English abstract)
Li Y L, Zheng Y J, Tang L, Su Z Y, Xiong C. 2016. Study on the identification of geographical indication Wuchang rice based on the content of inorganic elements., 36(3): 834–837. (in Chinese with English abstract)
Lin L, Wu J Z, Liu C L, Yu C C, Liu Z, Yuan Y L. 2020. Study on hyperspectral identification method of rice origin in northeast/ non-northeast China based on conjunctive model., 40: 905–910. (in Chinese with English abstract)
Liu J P, Wang J, Tang C H, He J B, Xie Y F, Ma T Y. 2020. Industrial process fault monitoring based on adaptive sliding window-recursive sparse principal component analysis., 48(9): 1795–1803. (in Chinese with English abstract)
Liu Y C, Li Y Y, Peng Y K, Yan S, Wang Q, Han D H. 2020. Application of two-dimensional correlation spectra in the identification of adulterated rice., 40(5): 1559–1564. (in Chinese with English abstract)
Miao X X, Miao Y, Tao S H, Liu D B, Chen Z W, Wang J M, Huang W D, Yu Y Y. 2021. Classification of rice based on storage time by using near infrared spectroscopy and chemometric methods., 171: 106841.
Mishra P, Angileri M, Woltering E. 2021. Identifying the best rice physical form for non-destructive prediction of protein content utilising near-infrared spectroscopy to support digital phenotyping., 116: 103757.
Qian L L, Song X J, Zhang D J, Zuo F, Lu B X, Chi X X, Zhao H Y. 2018. Authentication of Wuchang rice based on Fourier transform near infrared spectroscopy., 39(8): 231–236. (in Chinese with English abstract)
Qian L L, Zhang C D, Zuo F, Zheng L N, Li D, Zhang A W, Zhang D J. 2019. Effects of fertilizers and pesticides on the mineral elements used for the geographical origin traceability of rice., 83: 103276.
Salgó A, Gergely S. 2012. Analysis of wheat grain development using NIR spectroscopy., 56(1): 31–38.
Sha M, Gui D D, Zhang Z Y, Ji X Y, Shi X J, Liu J, Zhang D. 2019. Evaluation of sample pretreatment method for geographic authentication of rice using Raman spectroscopy., 13(3): 1705–1712.
Song X J, Qian L L, Zhang D J, Wang X H, Yu G, Yu J C, Zhou Y. 2017. Tracing the geographical origin of rice grown in different crop years based on diffuse reflectance Fourier transform near infrared spectroscopy., 38(18): 286–291. (in Chinese with English abstract)
Srinuttrakul W, Mihailova A, Islam M D, Liebisch B, Maxwell F, Kelly S D, Cannavan A. 2021. Geographical differentiation of Hom Mali rice cultivated in different regions of Thailand using FTIR-ATR and NIR spectroscopy., 10(8): 1951.
Tong P J, Kevin L J, Wei T T, Elejalde U, Zhang H C, Jiang Y R, Cao W M. 2021. Rapid identification of the variety and geographical origin of Wuyou No.4 rice by fourier transform near-infrared spectroscopy coupled with chemometrics., 102: 103322.
Yang S. 2021. Development of an integrated variety and appearance quality measurement system for milled rice., 15(5): 4679–4685.
Zhang Houqing (zhq1695641968@163.com)
15 May 2023;
31 October 2023
Copyright ? 2024, China National Rice Research Institute. Hosting by Elsevier B V
This is an open access article under the CC BY-NC-ND license (http://creativecommons.org/licenses/by-nc-nd/4.0/)
Peer review under responsibility of China National Rice Research Institute
http://doi.org/10.1016/j.rsci.2023.11.003
- Rice Science的其它文章
- Effects of Nitrogen-Regulating Gene AreA on Growth,Pathogenicity,and Fumonisin Synthesis of Fusarium proliferatum
- Rice Husk at a Glance:From Agro-Industrial to Modern Applications
- Smart Farming for Sustainable Rice Production:An Insight into Application,Challenge, and Future Prospect
- A β-Carotene Ketolase Gene NfcrtO from Subaerial Cyanobacteria Confers Drought Tolerance in Rice
- OsbZIP01 Affects Plant Growth and Development by Regulating OsSD1 in Rice
- Potential Secretory Transporters and Biosynthetic Precursors of Biological Nitrification Inhibitor 1,9-Decanediol in Rice as Revealed by Transcriptome and Metabolome Analyses