
Coupling effect on the thermal hazard assessment of hazardous chemical materials via calorimetric technologies and simulation approaches
2024-03-20 06:44YbeiXuJinkunShoWeiWngShenglingXuDongpingChen
Defence Technology 2024年2期
Ybei Xu , Jinkun Sho , Wei Wng , Shengling Xu , Dongping Chen ,*
a State Key Laboratory of Explosion Science and Technology, Beijing Institute of Technology, Beijing 100081, China
b Science and Technology on Aerospace Chemical Power Laboratory, Hubei Institute of Aerospace Chemotechnology, Xiangyang 441003, China
Keywords:Calorimetric technologies Kinetics Thermal hazard Phase transformation Thermal decomposition
ABSTRACT The coupling effect of heat absorption and release exists in the thermal decomposition of a few chemical materials.However,the impact of the above coupling on thermal hazard assessment is not considered in the literature studies.In this work, nitroguanidine (NQ) and 1,3,5-trinitro-1,3,5-triazine (RDX) are selected as representative materials to explore the influence of the coupling effect on the thermal hazard assessment of chemical materials.The linear heating experiments of NQ and RDX are carried out by a microcalorimeter and synchronous thermal analyser.The thermal decomposition curves are decoupled by advanced thermokinetics software.The thermal decomposition and kinetic parameters before and after decoupling are calculated.The results of TG experiment show that both NQ and RDX began to lose mass during the endothermic stage.The endothermic melting and exothermic decomposition of NQ and RDX are coupled within this stage.The coupling effect has different degrees of influence on its initial decomposition temperature and safety parameters.Compared with the parameters in the coupling state,the initial decomposition temperature and adiabatic induction period after decoupling decrease.The self-accelerating decomposition temperature increases,and internal thermal runaway time decreases.In the thermal hazard assessment of chemical materials with coupling effects, the calculated parameters after decoupling should be taken as an important safety index.
1.Introduction
In the thermal decomposition of chemical substances, the exothermic process is sometimes coupled with the endothermic process at the initial decomposition stage.The endothermic and exothermic processes partially overlap [1], which is referred to as"endothermic and exothermic coupling"in this work.Endothermic and exothermic coupling,which is a very dangerous phenomenon,causes the sample to melt and decompose at the same time.Due to the endothermic feature of melting, the sample does not show a temperature rise in the initial stage of decomposition and may even exhibit a temperature drop.This physical phenomenon delays the detection of thermal decomposition in practice and causes critical safety accidents without protection actions in time [2].Furthermore, the current kinetic models in thermal analysis are based on the premise that the exothermic curve is complete and is not disturbed by the endothermic process.However, the endothermic process has a significant effect on the exothermic process in practical thermal analysis.Without the evaluation of endothermic and exothermic coupling in thermal hazards, one may derive inappropriate kinetic parameters.
In the collection of differential scanning calorimetry (DSC)spectrogram,including 850 common reactive substances compiled by the Industrial Safety Research Institute of the Ministry of Labor(Japan) [3,4], 128 substances exhibit the phenomenon of endothermic and exothermic coupling.In recent years,the endothermic and exothermic coupling has received increasing attention in the field of chemical thermal analysis.Zhang et al.[5] conducted a linear heating test on azodiisobutyronitrile (AIBN) by differential scanning calorimetry (DSC) and found that the endothermic process of AIBN due to phase transition interferes its exothermic decomposition process.AIBN was dissolved in aniline solution to eliminate the effect of the melting endotherm, and a liquid decomposition curve of AIBN was obtained without endothermic interference.The initial decomposition temperature of AIBN was significantly lower than that of solid AIBN by approximately 5°C.Xu et al.[6] used DSC and thermogravimetric analysis (TGA) to study the thermal decomposition process of BPO.The experimental results show that BPO has endothermic and exothermic coupling at different heating rates.The endothermic and exothermic coupling induces uncertainty in the determination of the initial decomposition temperature and enthalpy of BPO.Wang et al.[7] combined non-isothermal experiments and kinetic analysis to describe the complex thermal decomposition process of 2,6-diamino-3,5-dinitropyrazine-1-oxide (LLM-105).In this system, multiple decomposition reactions exhibit coupling behavior, and the influence of each decomposition reaction on the whole reaction process was analyzed for the first time.Yu et al.[8] found a significant coupling phenomenon between the endothermic peak of melting and the decomposition peak of hexahydro-1,3,5-trinitro-1,3,5-triazine (RDX) during the linear heating test by a microcalorimeter.Khichar et al.[9] identified the endothermic peak of RDX locating in the range of 190-195°C, which also overlaps with the melting process of sample,using TG and DSC measurements.In the liquid phase, mass loss occurs mainly due to thermal decomposition.Oxley et al.[10] applied DSC measurements to test the linear temperature rise of nitroguanidine(NQ)at a heating rate of 20°C/min, and an obvious endothermic peak occurs at 237.7°C.The endothermic and exothermic peaks are partially coupled.Lee et al.[11] used DSC to study the thermal decomposition of RDX,2,2’,4,4’,6,6’-hexanitrostilbene (HNS) and hexahydro-1,3,5-trinitro-1,3,5-triazine (HMX) under non-isothermal conditions.The results showed that the three hazardous materials all exhibit obvious endothermic and exothermic processes, and partial coupling occurs in non-isothermal experiments.The coupling phenomenon increases the uncertainty of thermal decomposition,making it difficult to accurately determine the decomposition temperature.The coupling phenomenon makes energetic materials prone to explosions during production, use, and storage, causing casualties.
For example, in August 2020, a large explosion accident occurred in the port area of Beirut, the capital of Lebanon.The explosion was caused by a large amount of ammonium nitrate.The accident resulted in at least 218 casualties and more than 6500 injuries [12].In June 2019, an explosion accident occurred in Russia's Kristall Explosive Factory, which mainly produces RDX and HMX, causing a large number of property losses and dozens of casualties [13].In August 2015, a particularly major incident occurred in Tianjin Binhai New Area due to the fire in the warehouse storing ammonium nitrate, resulting in 165 deaths and billions of economic losses [14].In February 2012, an explosion accident occurred in the NQ workshop of a chemical plant in Hebei Province,China,causing many casualties[15].Through the analysis of the above accidents [12-14], it is found that there are some common factors leading to these accidents: first, the mass is relatively large and the storage is improper; second, the explosive is heated and rapidly decomposed.The explosion of a large mass sample is easily triggered by thermal decomposition,and coupling effect is an important phenomenon that cannot be ignored during the decomposition process [16].Researchers have conducted thermal hazard assessments on these hazardous substances with coupling phenomena.Lai et al.[17]conducted non-isothermal and isothermal experimental measurements on BPO and found that the thermal decomposition curve of BPO exhibits a significant endothermic and exothermic coupling phenomenon.Based on this thermal decomposition curve,the thermal hazard level of BPO was further evaluated, and parameters such as the time to reach the maximum reaction rate were calculated.Chen et al.[18]performed DSC testing on RDX/GAP and made safety predictions based on the resulting DSC curve, including the thermal explosion critical temperature and the self-accelerating decomposition temperature.However,if the calculation is based on the thermal decomposition curve with exothermic and endothermic coupling phenomena,the obtained kinetic parameters and thermal hazard calculation results obviously ignore the influence of the exothermic process, and the accuracy is somewhat insufficient.
The previous calculations results [9,19,20] indicate that the thermal decomposition process of substances with coupling phenomena is relatively complex and involves chemical reactions between different phases.Khichar et al.[9] developed solid sublimation and liquid evaporation models to estimate the mass loss caused by sublimation and evaporation during the heating process of RDX in solid-liquid states.Sublimation accounts for 10.8%,5.2%,and 3.9% of mass loss for the 5°C/min,10°C/min,and 15°C/min heating rates, respectively.Vaporization accounts for 29.6%,34%,and 35.9%of mass loss for the 5°C/min,10°C/min,and 15°C/min heating rates,respectively.Zhang et al.[20]used the DFT method to construct the potential energy surfaces for the primary and secondary reactions during RDX decomposition,and proposed the early decomposition pathway of RDX and the gas-phase kinetics of secondary reactions.Patidar and Thynell[19]established a detailed chemical kinetic mechanism at the B3LYP/6-311++G(d,p)theoretical level, explained the different liquid phase decomposition pathways and early ring-opening reaction pathways of RDX,and elucidated the different reaction processes and subsequent reactions of intermediate products in liquid phase RDX.Therefore,this type of substance has complex reactions during the early stages of decomposition.When conducting thermal hazard assessments,it is necessary to consider the effects of exothermic and endothermic coupling.Although researchers have extensively explored the phenomenon of thermal decomposition coupling and gained some understanding [5,7,9,19,21-26], there are still some shortcomings in revealing how endothermic and exothermic coupling affects the storage and safety assessment of such hazardous chemicals.
In this work, RDX and NQ are selected as the representative energetic materials to illustrate the effect of endothermic and exothermic coupling on thermal hazard assessment.First, the linear heating experiments of RDX and NQ are carried out by a microcalorimeter and a synchronous thermal analyzer at different heating rates.The influence of the mass effect on the decomposition temperature and the evolution of mass loss during decomposition is analyzed.On this basis, the endothermic melting and exothermic decomposition curves are obtained by decoupling the peaks.The decomposition temperature is determined after decoupling.Parameters, such as apparent activation energy, selfaccelerating decomposition temperature (SADT) and the time to maximum rate under adiabatic conditions (TMRad), are obtained through kinetic calculations.Safety parameters for the production,transportation and storage of RDX and NQ are obtained by analyzing the variation in the coupling effect.
2.Experimental methods
The RDX and NQ samples are provided by Gansu Yinguang Chemical Co., LTD.The median particle sizes of the RDX and NQ samples measured by a laser particle size distribution analyzer(D50) are 20.27 μm and 1.16 μm, respectively.The synchronous thermal analyzer (STA) [27,28] can simultaneously measure the weight loss and thermal decomposition of sample.The ceramic crucible of STA is shown in Fig.1(a).STA is used to perform the thermal decomposition and mass loss measurements of the RDX and NQ samples.The crucible is covered by a lid with a round hole that has a diameter of 1 mm.Both purge gas and protective gas are high-purity nitrogen with a flow rate of 40 mL/min.The reference crucible is an identical crucible as the STA measurement.The resolution of TG and DSC is 0.025 μg and 1 μw, respectively.The sample mass is 0.5 mg.The sample is heated from room temperature until the sample is completely decomposed.The heating rates are 5.0°C/min,10.0°C/min,15.0°C/min and 20.0°C/min.
Compared with the conventional thermal analyser.The Microcalorimeter(C600) has high sensitivity and uses a 3D sensor array to measure the temperature,as shown by the red curve in Fig.1(b).The reaction chamber is a high-pressure pool (nickel-chromium alloy,Fig.1(b)),which can measure large mass samples and reduce the influence of other factors (i.e., sample shape, contact mode between sample and sensor).The maximum pressure of reaction chamber is 100.0 bar.The programmed heating rate in the microcalorimeter is set as 0.001-2.0°C/min.The calorimetric accuracy is 2.0%, and the resolution is 0.5 μW.The measurable experimental temperature ranges from 0 to 600.0°C.In the microcalorimeter experiment, the linear heating rise of RDX and NQ is measured by C600[21].The sample mass is 10.0 mg.The sample is heated from room temperature until the sample is completely decomposed.The heating rates are 0.5°C/min,1.0°C/min,1.5°C/min,and 2.0°C/min.
In this work, kinetic calculations are carried out on thermal decomposition curves by advanced kinetics and technology solutions (AKTS).AKTS performs kinetic analysis on the DSC and TGA data of energetic materials, pyrotechnic materials and hazardous chemicals, and determines the kinetic parameters based on the multicurve method using the Friedman model.Four thermal decomposition curves under different heating rates are imported into AKTS.The experimental sample mass,relative molecular mass,heating rate and other parameters are integrated in the AKTS calculations.
In the field of thermal kinetics, the iso-conversional method is the most commonly used, and the Friedman method is a popular choice [29].In this work, the Friedman method is applied to calculate the thermal decomposition curves of RDX and NQ after decoupling.The relationship curve between activation energy and conversion rate is obtained to determine whether the reaction mechanism changes in the whole reaction process [30].Further thermal safety prediction under different conditions can be carried out to evaluate key parameters,such as SADT and TMRad[31,32].
The equation of the Friedman method is as follows:
where β is the different heating rates;α is the conversion rate;T is the reaction temperature; A is the preexponential factor; Eais the apparent activation energy;R is the universal gas constant;and f(α)is the reaction mechanism function.
TMRadis defined as the arrival time of the maximum reaction rate under adiabatic conditions, which is of great significance for evaluating the safety state.In this work, AKTS software is used to calculate the thermal decomposition curves under four different heating rates, and predict the TMRadof the samples.In the processing of decomposition curve by AKTS,it can be considered that the thermal decomposition curve is composed of the thermal effects of all elementary reactions.For one elementary reaction, the energy balance equation can be expressed as

where U is the comprehensive heat transfer coefficient; S is the contact area between the experimental sample and the crucible;m is the mass of the sample; ΔHris the reaction enthalpy; cpis the specific heat capacity; subscript env, s and b represent the environment, sample, and crucible, respectively.
In the reaction process,we assume that all the heat generated by the thermal decomposition of the sample is to heat the sample itself and the crucible,that is,U=0,and there is thermal equilibrium between the sample and the crucible, the formula is
As the heating rate remains constant,Eq.(4)can be transformed into

Fig.1.Schematic diagram of crucible heating and sensor distribution for a(a)synchronous thermal analyzer and(b)microcalorimeter.There are two crucibles,one is the reference crucible and the other is the sample crucible.The red curve represents the distribution of heat sensors, and the red dots represent the heaters.
dα/dt is computed according to the kinetic parameters from the Friedman method.Hence,the temperature of the adiabatic reaction system can be represented by time,kinetic parameters,heat release and the properties of the experimental sample.
Therefore, the above formula can not only predict the temperature growth rate dT/dt, but also obtain the arrival time of the maximum reaction rate at different initial temperatures, namely TMRad, by differentiating T(t).
3.Results and discussion
3.1.Thermal decomposition of NQ and RDX
In this work, the initial decomposition temperature (Tonset) is determined as to the temperature when the thermal decomposition curve deviates from the baseline.Similarly,the determination of the decomposition completion temperature (Toffset) is also interpreted from the temperature when the thermal decomposition curve converges to the baseline.Figs.2 and 3 show STA experimental results of NQ and RDX at 5°C/min,10°C/min,15°C/min and 20°C/min,respectively.TG,DSC and temperature variation processes of NQ and RDX can be derived from Figs.2 and 3.The STA curve of NQ is exhibited in Fig.2, and the heating rates are 5.0°C/min,10.0°C/min,15.0°C/min,and 20.0°C/min.The Tonsetand Toffsetof NQ is 243.3-261.6°C and 273.1-331.3°C, respectively.The decomposition peak temperature(Tpeak) refers to the temperature that the DSC curve reaches its maximum.For the four heating rates,Tpeakfalls in the range of 247.0-272.9°C.From STA results,obvious endothermic peaks of NQ due to melting can be identified for all the heating rates except the case of 5°C/min.In Fig.2,the Tpeakof NQ exhibits a sharp transition from the endothermic peak temperature,indicating intense reactions in the initial decomposition stage.This is consistent with the findings of Wang et al.[33].Fig.3 presents the STA curve of RDX.The Tonset, Toffsetand Tpeakof RDX is 210.3-224.0°C, 258.6-316.3°C and 233.6-256.5°C, respectively.These values agree with previous measurements at the same heating rate[23].Similar to the decomposition behaviors of NQ,the endothermic peak of RDX occurs prior to the exothermic decomposition peak.
In the endothermic stage,NQ and RDX loss their mass by 15%-20%and 10%-15%at different heating rates,respectively.It can also be observed in other works [23,34] that the TG curves of NQ and RDX decrease in the endothermic stage.We speculate that the mass decline in this period is mainly due to two reasons: first, the mass decline caused by thermal decomposition; and second, the mass loss caused by sublimation.Our conjecture is based on previous experiment research[34-36].For example,in the TG/DSC-MS-FTIR experiment of NQ, the mass spectrum signal of pyrolysis gas products could be detected at 240°C,and this temperature is in the endothermic stage of NQ [34].Similarly, Zeng and coworkers [35]found that the decomposition products of RDX, such as CO2, HCN,N2O, H2O, NO, CO and HCHO could be detected at 197°C.At this temperature, the melting endothermic of RDX starts to occur and the TG curve also starts to decline.These previous experiments indicate that thermal decomposition reaction occurs in the endothermic stage of NQ and RDX[34,35].Sublimation may also play an important role in the endothermic stage.Hikal and Weeks [36]analyzed the sublimation phenomenon of RDX and other substances during the heating process and found that sublimation in the solid-state is responsible for a minor mass loss.However,the sublimation of NQ has not been shown by relevant experiments.

Fig.2.STA curves of NQ at different heating rates from 5 to 20 °C/min.The green,blue and red lines represent the TG results,DSC results,and temperature,respectively:(a)5 °C/min; (b) 10 °C/min; (c) 15 °C/min; (d) 20 °C/min.

Fig.3.STA curves of RDX at different heating rates from 5 to 20 °C/min.The green,blue and red lines represent the TG results,DSC results,and temperature,respectively:(a)5 °C/min; (b) 10 °C/min; (c) 15 °C/min; (d) 20 °C/min.
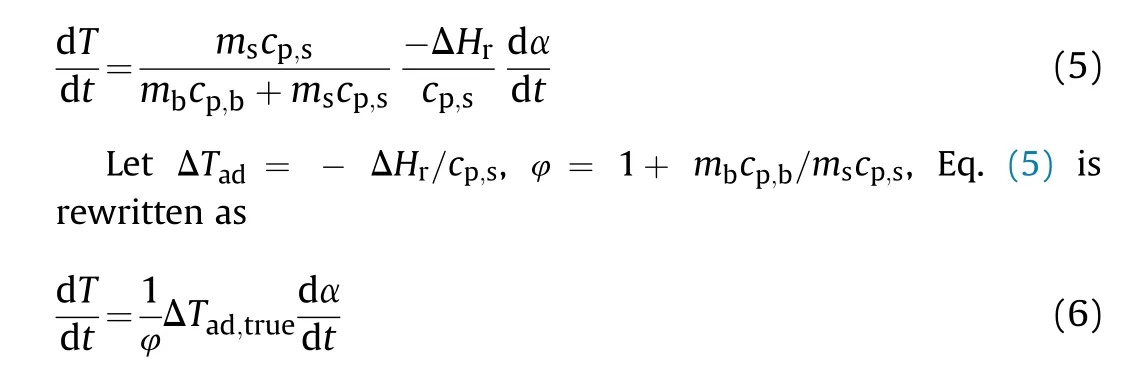
In the microcalorimeter,TG experiments are carried out using a larger sample mass (10.0 mg) and reduced heating rates (<5°C/min).These testing conditions are consistent with the slow heating issues in the safety evaluations of chemicals in practice.Fig.4(a)presents the microcalorimetry curves of NQ at 0.5°C/min,1°C/min,1.5°C/min and 2°C/min.The Tonset, Toffsetand Tpeakof NQ is 178.8-201.7°C, 283.3-297.2°C and 223.8-236.3°C, respectively.Fig.4(b)exhibits the microcalorimetry curves of RDX at 0.5°C/min,1°C/min,1.5°C/min and 2°C/min.The three decomposition temperatures of RDX can be extracted from Fig.4(b)as 205.7-209.6°C,236.2-291.7°C and 215.0-233.4°C.
The thermal decomposition curves of microcalorimeter and STA experiments are similar in their decomposition laws.All Tonset,Toffset,and Tpeakincrease with increasing heating rate.This is known as the thermal lagging phenomenon during the thermal decomposition process.As the heating rate increases, the heat exchange between the sample and the environment is shortened, leading to an increase in the decomposition temperature [17,37].The decomposition temperature of NQ and RDX in the microcalorimeter experiment is lower compared to the decomposition temperature of the STA experiment.For example, the Tonsetof NQ in the microcalorimeter experiment is 178.8-201.7°C, while the Tonsetin the STA experiment is 243.3-261.6°C.This can be attributed to the reduced heating rate and larger sample size in the microcalorimeter experiment.With an increase in the sample mass, it typically requires a longer time to remove the reaction heat of decomposition to surrounding medium.The heat accumulation effect is enhanced causing a gradual decrease in the decomposition temperature.In the practical production and storage, the amounts of NQ and RDX is generally much larger than the sample mass in this work by several orders of magnitude that the heat accumulation effect must be accounted for in the risk evaluation [38-40].
Fig.4.Microcalorimeter curves of(a)NQ and(b)RDX at different heating rates.Black,red,blue and tawny lines represent 0.5 °C/min,1 °C/min,1.5 °C/min,2 °C/min,respectively.
From the analyses of the experiments using both STA and microcalorimeter, thermal decomposition process of NQ and RDX mainly has two stages: phase transition due to melting and exothermic decomposition.During the heating process, the high temperatures induce a phase change of the sample.In the STA experiments,the sample mass began to decrease in the initial stage of the phase transition, suggesting that the partial decomposition of NQ and RDX occur in the solid-liquid mixture.The decomposition rate in the liquid is generally higher than that in the solid system.The accelerated decomposition rate results in a sharp decomposition curve (Figs.2 and 3).Due to the nature of endothermic melting, it causes an illusion that the entire reaction system is cooled down without decomposition.However, the decomposition process is initialized in the initial stage.This misinterpretation can lead to dangerous accidents in practice.
3.2.Endothermic and exothermic coupling
NQ and RDX exhibit an endothermic and exothermic coupling during the thermal decomposition process.The melting endothermic phase change interferes with the exothermic decomposition process, which deforms the thermal decomposition curve.Therefore, it is necessary to conduct an in-depth analysis of these coupling phenomena.The decoupling process of the decomposition curve is carried out by the data processing module in AKTS software in this work.The decoupling process follows: the decomposition curves are input into AKTS, and the points of the highest decomposition exothermic peak are selected.A numerical fitting process of the selected exothermic peak is carried out in AKTS to get a complete exothermic curve.Finally, the exothermic curve is subtracted from the original experimental curve to obtain the endothermic curve.Similar treatment can be seen in previous works[21,41].
As the operation conditions of microcalorimeter is close to the early stage of thermal runaway during storage in practice, the influence of the coupling effect on thermal safety is analyzed using the experimental results from the microcalorimeter.Fig.5 illustrate the decoupling results of NQ from the microcalorimeter measurements, and the characteristic parameters are summarized in Table 1.The average fitting coefficient between the decoupling curve and the original curve of NQ is 0.83.In the NQ case of 0.5°C/min and 1°C/min, the fitting coefficient of the decoupling curve and the experimental curve are 0.8 and 0.73, and the decoupling effect is poor.When the heating rate is 1.5°C/min and 2°C/min,the higher fitting coefficients are 0.86 and 0.92, respectively.With the increase of heating rate, the fitting coefficient between the decoupling curve and the original curve of NQ gradually increases.This may be related to the energy release characteristics of NQ.When the heating rate is low, the endothermic signal is not observable, and the appearance is exothermic.The complete heat release curve (peak 1) is obtained by decoupling the thermal decomposition curve (raw curve) of NQ under different heating rates,and the heat release are 70.0 J/g,91.9 J/g,98.0 J/g,and 124.5 J/g,respectively.Compared with the coupled state,the heat release is increased by 15.0 J/g,11.4 J/g,12.7 J/g and 14.3 J/g,respectively.This indicates that the endothermic process of NQ covers up the heat generated by decomposition to some extent during the initial decomposition stage.Table 1 illustrate that the Tonsetrange of NQ is 159.5-175.9°C, the Tpeakis 223.8-236.4°C, and the Toffsetis 287.2-296.6°C.

Fig.5.Decoupling peaks of NQ at different heating rates(Black line:raw curve;Red line:first stage exothermic peak;Tawny line:endothermic peak:(a)0.5 °C/min;(b)1.0 °C/min;(c) 1.5 °C/min; (d) 2.0 °C/min.
Table 1 Characteristic decoupling parameters of NQ and RDX at different heating rates.
Fig.6 shows the decoupling results of RDX at different heating rates.Compared with the decoupling result of NQ, the RDX curves exhibit good fittings with an average R2as 0.99.The heat release of RDX after decoupling is 570.7 J/g,1062.8 J/g,1348.3 J/g and 2094.1 J/g, which are 86.1 J/g, 81.4 J/g, 164.0 J/g and128.0 J/g higher than those in the coupling state.The Tonsetof RDX is 185.6-203.2°C,the Tpeakis 215.6-226.7°C, and the Toffsetis 238.3-297.6°C.It should be noted that when the heating rate of RDX is 2°C/min,one melting peak and two exothermic peaks are obtained by the decoupling experimental curve(Fig.6(d)).One of the two exothermic peaks is the main exothermic peak of RDX, and the other is the shoulder peak.This phenomenon can also be observed in the previous experimental results [42,43].At a higher heating rate, the thermal decomposition curve shows a sharp main peak and a shoulder peak.The formation of shoulder peak is due to the secondary reactions in the late stage of thermal decomposition.Compared with the corresponding temperature before decoupling, the Tpeakand Toffsetof NQ and RDX show little change after decoupling.The coupling effect mainly influences the Tonsetand heat release of NQ and RDX.In the initial stage,the endothermic covers up part of the exothermic heat, which makes the observed Tonsethigher and the heat release reduced.It is easy to make an incorrect judgment on whether the substance has started to decompose and protection measures should be taken.
3.3.Kinetic analysis of thermal decomposition
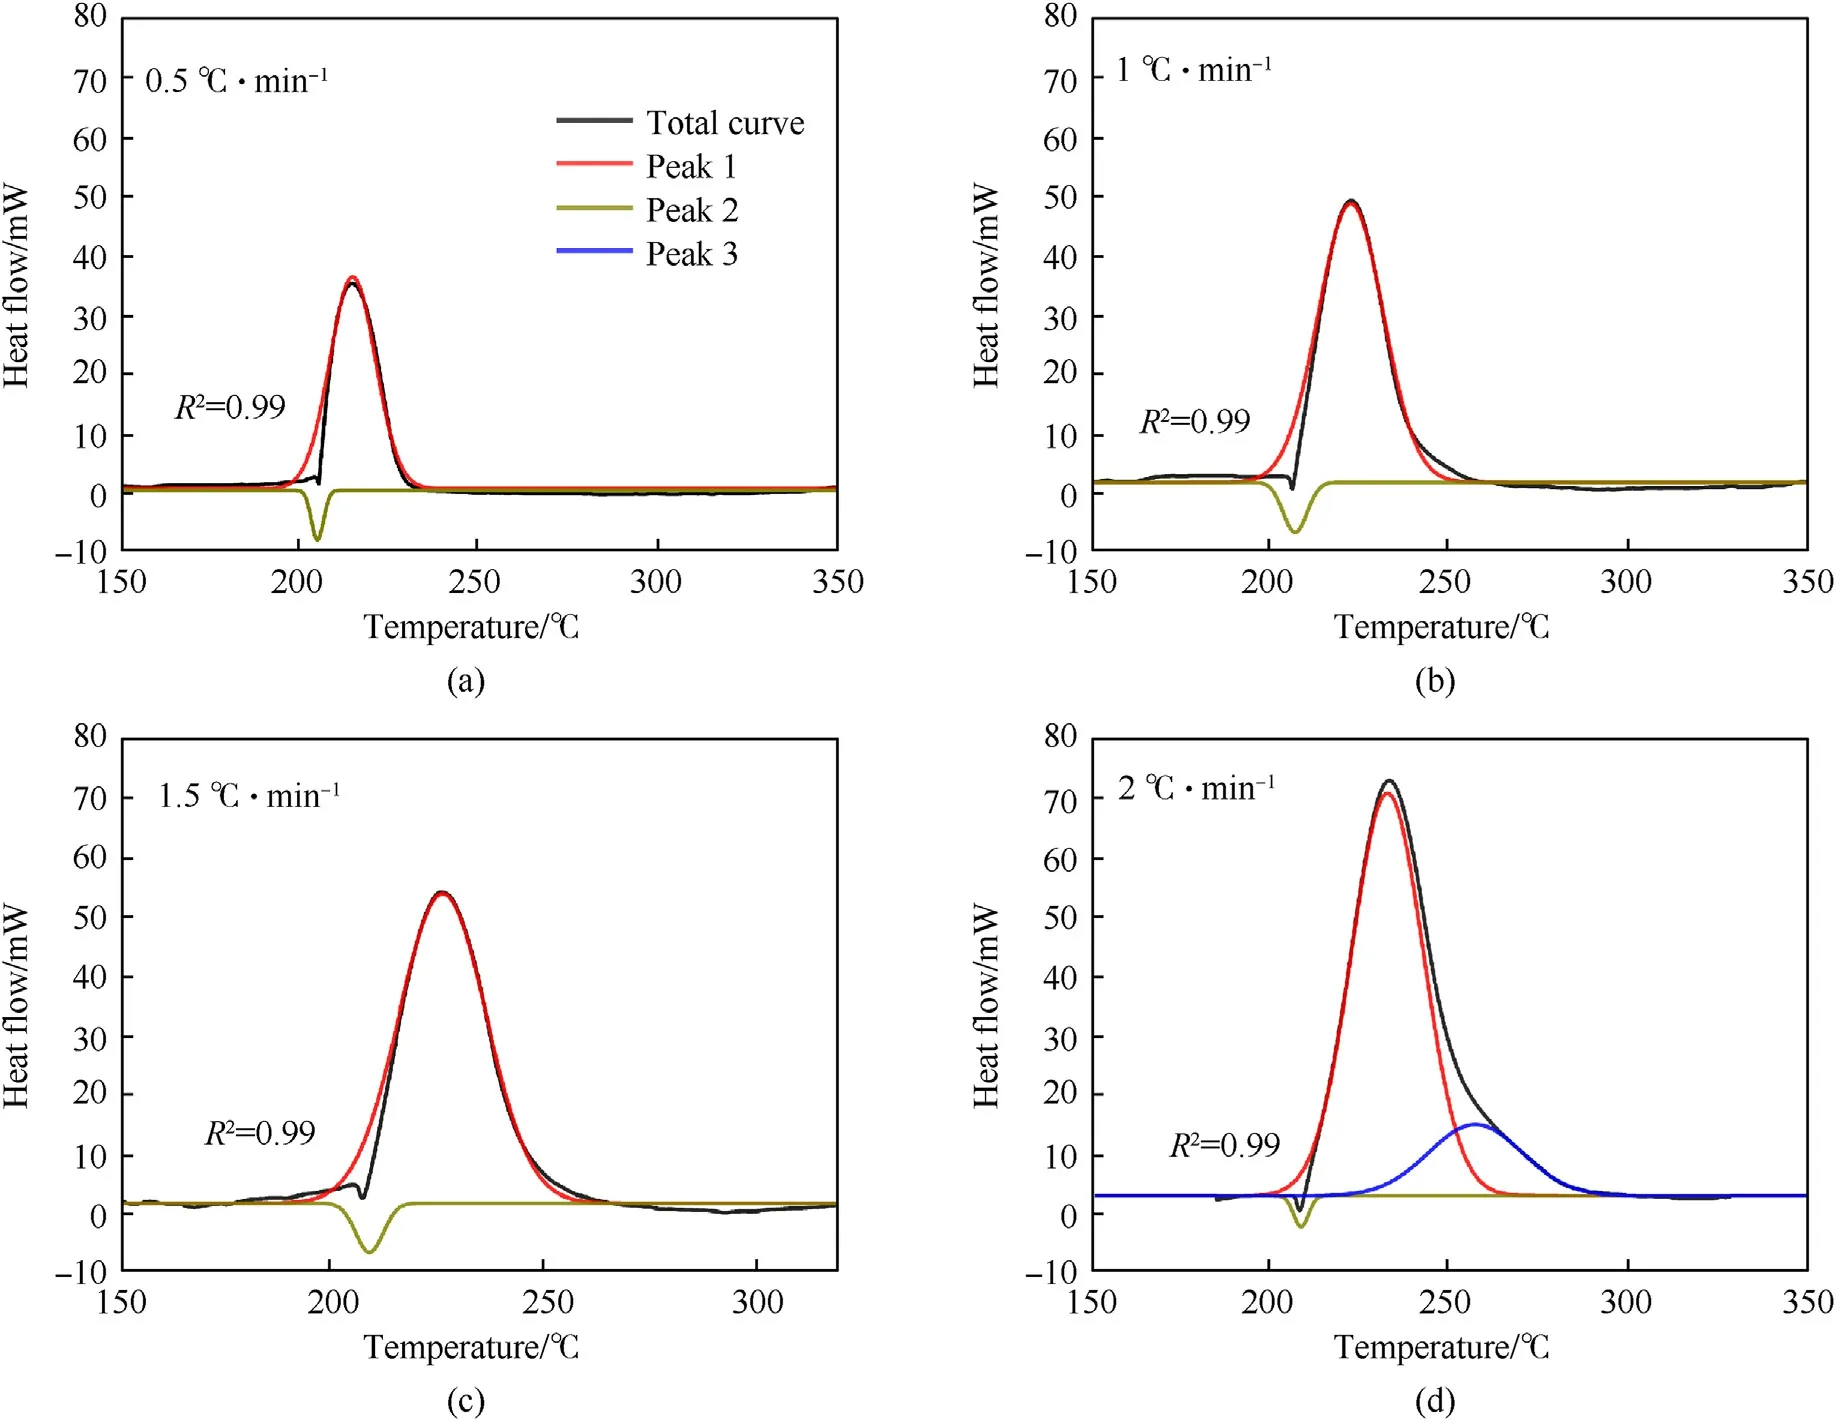
Fig.6.Decoupling peaks of RDX at different heating rates(Black line:raw curve;Red line:first stage exothermic peak; Tawny line:endothermic peak; Blue line:the second stage exothermic peak: (a) 0.5 °C/min; (b) 1.0 °C/min; (c) 1.5 °C/min; (d) 2.0 °C/min.
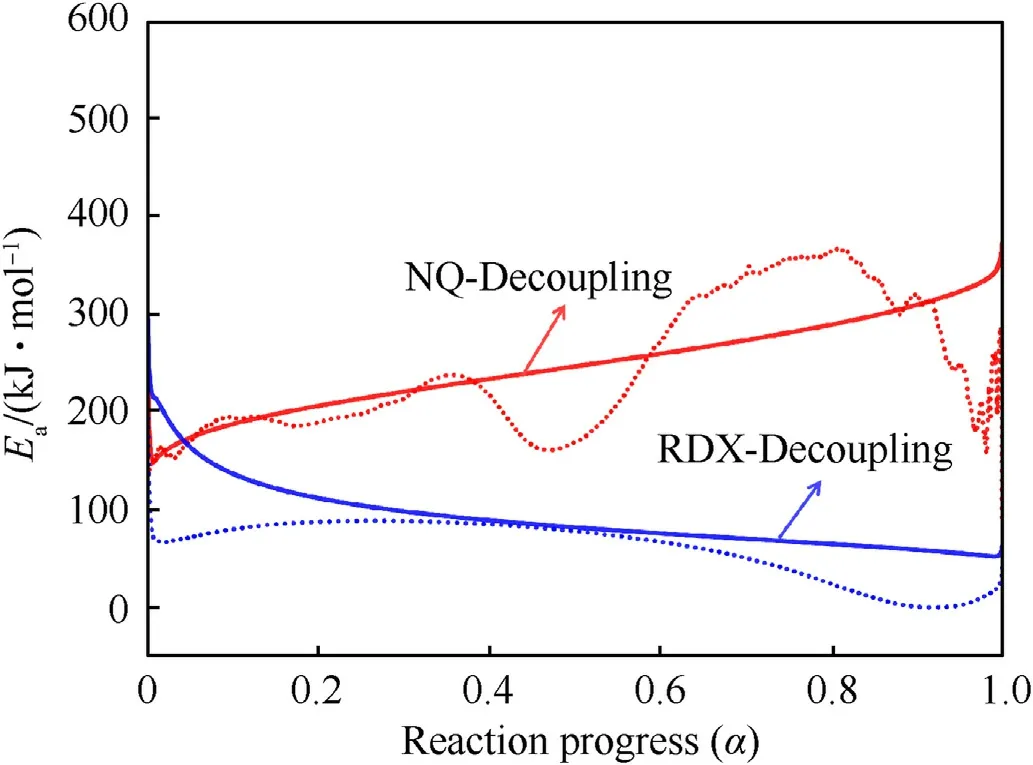
Fig.7.Apparent activation energy derived from the Friedman model at different conversion degrees (Solid line: the activation energy in the decoupling state; Dashed line: the activation energy in the coupling state).The red and blue lines represent the apparent activation energy of NQ and RDX, respectively.
The Friedman model is used to perform kinetic calculations on the exothermic curves of NQ and RDX.The activation energies extracted from the coupling state are compared to those after decoupling under different conversion degrees (Fig.7).Since the apparent activation energies in the initial and final stages of the reaction are easily affected by external noise and baseline selection,the activation energy curve exhibits large fluctuations.To avoid misinterpretation, the apparent activation energy in the reaction process of 0.05-0.95 is analyzed[44].In Fig.7,the activation energy curve of NQ with decoupling is relatively smooth (red solid line),the activation energy falls in the range of 150-350 kJ/mol.As decomposition reaction promotes, the apparent activation energy gradually increases until the end of the reaction.Compared with the decoupling state (red solid line), the reaction of NQ is more complicated in the solid-liquid coupling state.The activation energy exhibits an unexpected drop at the conversion rate of 0.38,the activation energy is 240 kJ/mol, which may be attributed to the reduced activation energy of molten NQ as the overall reaction is faster.When the conversion rate is 0.48, the lowest activation energy is 165 kJ/mol, and the activation energy starts to increase gradually.In the cases of RDX, the apparent activation energies before and after decoupling are close, and both of them gradually decrease as a function of reaction progress.The range of activation energy after decoupling is 55-200 kJ/mol, and the original ones(blue dashed line) are slightly lower than those in the decoupled state (blue solid line).In a coupled state, both the exothermic and endothermic processes occur simultaneously, and the activation energy of the substance may decrease due to the effect of the endothermic process.However,when decoupled,the endothermic process is separated,and the activation energy is not affected by the endothermic process, resulting in an activation energy slightly higher than that in the coupled state.This illustrates that the heating process of a substance with coupling phenomena is a complex system of mutual influence and coupling.To accurately describe the thermal decomposition of the substance, it is necessary to consider decoupling methods to eliminate the influence of endothermic melting on the decomposition of RDX and NQ.
3.4.Time to maximum rate under adiabatic conditions
When energetic materials are stored in large masses,due to the limitation of thermal conductivity, almost all the heat generated inside is to heat the materials themselves.The increase in temperature promotes the thermal decomposition reaction and is very likely to cause thermal runaway [45-47].Hence, it is very important for thermal safety to analyze the reaction process of energetic materials under adiabatic conditions.We use TMRadto evaluate the influence of the coupling effect on the runaway reaction of NQ and RDX under adiabatic conditions.The appropriate alarm time can be set by referring to TMRadin practice, providing enough time to take prevention actions before thermal explosion accidents[48,49].The TMRadcorresponds to the occurrence time of thermal explosion of hazardous material under adiabatic conditions.The detailed calculation process is described in Section 2.
Fig.8 shows the TMRadresults of NQ and RDX.In the calculations of TMRad, the heat release, i.e.ΔHr(Eq.(5)), is extracted from the integration of experimental exothermic curves (see red curves in Fig.6).To evaluate the uncertainties in experiments,the minimum,average and maximum values of heat release are taken from the four pyrolysis.In Fig.8, the error range of TMRadgradually decreases with the increase of the temperature,and the effect of the heat release on it also gradually decreases.RDX and NQ show the same change law;when the initial temperature increases,the time to maximum rate under adiabatic conditions gradually decreases.In the coupled state, the temperature of NQ is 141.0°C, 152.2°C,159.7°C and 167.3°C,and the time to reach the maximum reaction rate is 24 h,8 h,4 h and 2 h,respectively.The temperature of RDX is 169.4°C,176.5°C,181.2°C and 186.0°C,and the time to reach the maximum reaction rate is 24 h,8 h,4 h and 2 h,respectively.If the initial temperature is further increased,the thermal runaway time will be shorter.This means that there may not be enough time to take preventive measures to control the thermal runaway reaction,which may lead to thermal explosion accidents.From the analysis in Fig.8,when the time to reach the maximum reaction rate is the same, the temperature after decoupling is slightly lower than that in the coupled state.For example, when the time is 24 h, the temperature of RDX after decoupling is 160.6°C, which is lower than the temperature in the coupled state of 169.4°C.The temperature of decoupled NQ is 139.8°C, which is slightly lower than the temperature in the coupled state,141°C.Hence,we should take TMRadafter decoupling as an important safety parameter in the thermal safety evaluation.
3.5.Self-accelerating decomposition temperature
Due to the autocatalytic nature of decomposition reactions,serious accidents caused by thermal runaway frequently occur in the industrial production process, causing casualties and property losses.SADT is a safety property that plays an important role in thermal safety assessment for the storage and transportation of hazardous chemicals [50-52].According to the definition of the United Nations (UN), SADT refers to the minimum ambient temperature where the temperature rises of a substance in a specific pack exceeds 6.0°C in a period of seven days [53-56].That is, the lowest ambient temperature corresponding to the uncontrolled internal temperature of the system is the SADT of the system.It evaluates the capability of spontaneous thermal combustion for self-reactive substance under storage conditions.The SADT of a substance is not only related to the nature of the substance itself,but also the thermal conductivity of the package material.In this work, the thermal conductivity of 0.1 W/(m?K) recommended by AKTS software is considered.we use AKTS software to predict SADT based on microcalorimeter experiments.
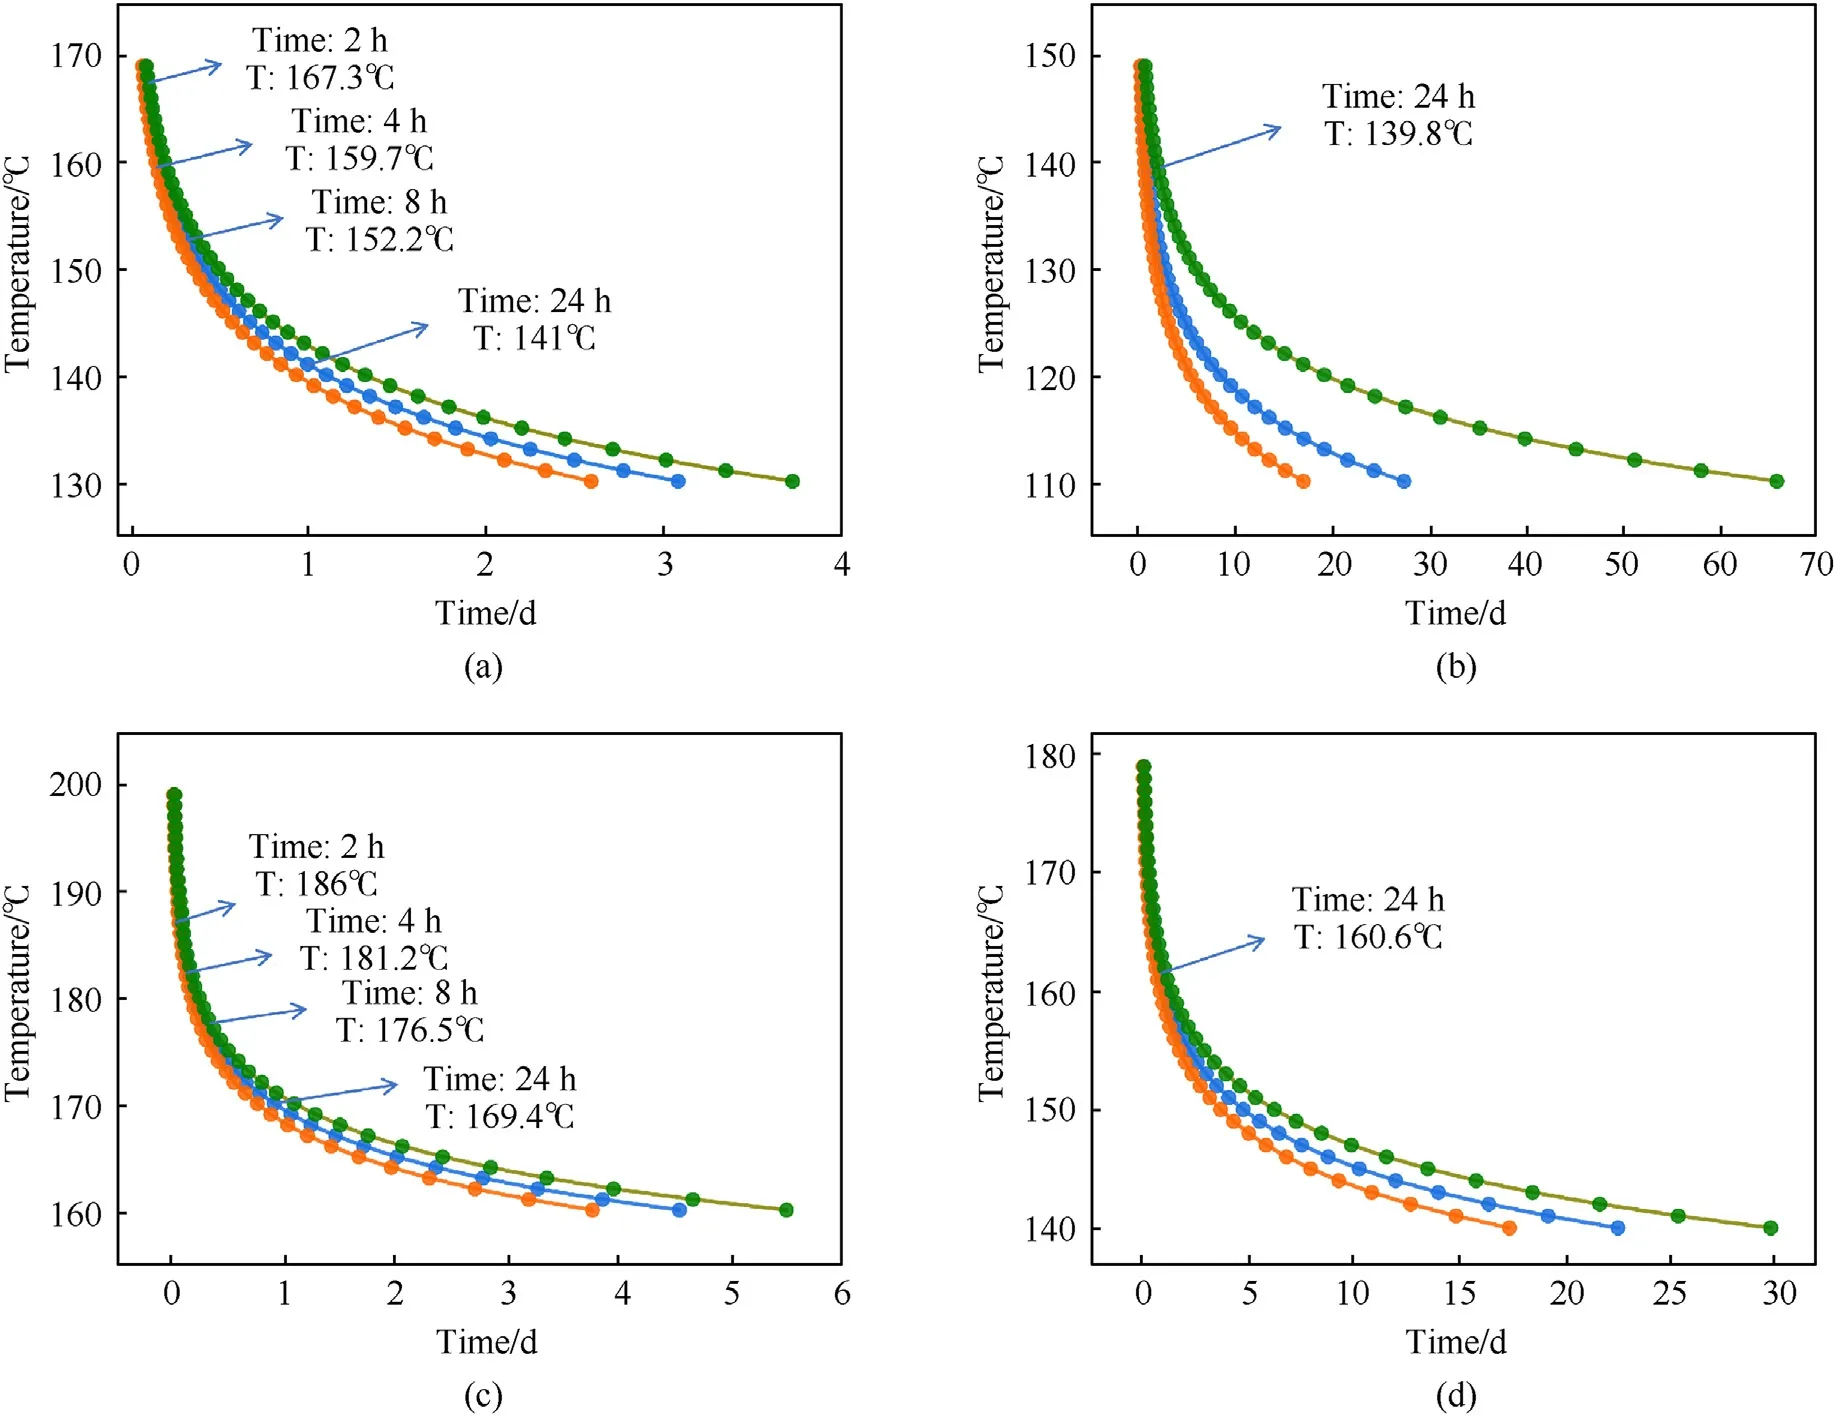
Fig.8.Adiabatic temperature simulations of NQ and RDX at different temperatures: (a) NQ coupled solution; (b) NQ decoupled solution; (c) RDX coupled solution; (d) RDX decoupled solution.Orange,blue,green lines represent the cases considering minimum, average and maximum values of heat release.The heat release values are integrated from the exothermic curves in Fig.6.
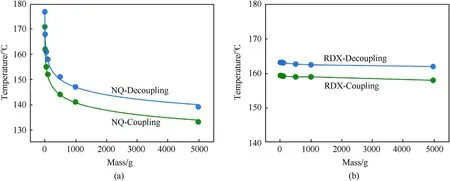
Fig.9.Predicted self-accelerated decomposition temperatures of (a) NQ and (b) RDX.The blue and green lines represent the calculated values in decoupled and coupled states,respectively.

Fig.10.Runaway time of SADT in (a) NQ and (b) RDX.The blue and green lines represent the calculated values in decoupled and coupled states, respectively.
The SADT can be directly determined through a variety of experiments, but it requires considerable experimental cost and is easily affected by experimental conditions.In this work,the SADT of NQ and RDX is obtained by simulation calculations based on microcalorimeter curves and the kinetic parameter.The mass parameters for SADT calculations are set to 1 g,10 g,50 g,100 g,500 g,1 kg and 5 kg.Figs.9(a)and 9(b)represent the SADT of NQ and RDX under different mass conditions, respectively.Figs.9(a) and 9(b)illustrate that SADT gradually decreases as the mass increases.When the mass is large, the heat generated by thermal decomposition of the sample is not easy to diffuse to the surrounding environment, resulting in gradual reduction of SADT.The SADT of NQ is more sensitive to the increase in mass, and the SADT of RDX only exhibits slightly decrease with the increase in mass.Keeping the sample mass constant, the SADT in the decoupled state is higher than that in the coupled state.In the coupled state, the sample undergoes a melting phenomenon,which absorbs some of the heat generated by decomposition,resulting in a relatively lower diffusion of heat to the surrounding environment and a lower SADT.For example,under the condition of a mass of 1 kg,the SADT of NQ in the decoupling state is 147°C,which is 6°C higher than that in the coupling state.The SADT of RDX in the decoupling state is 163°C, which is 4°C higher than that in the coupling state.Figs.10(a) and 10(b) show the runaway time of SADT for NQ and RDX, respectively.According to Figs.10(a) and 10(b), under the same mass conditions,the runaway time in NQ and RDX systems in decoupling state is significantly lower than that in coupling state.For example, the runaway time of 1 kg NQ and RDX is 27.6 h and 16.1 h lower than those in the coupling state, respectively.This indicates that the runaway time of NQ and RDX obtained is shorter and the ambient temperature increases more rapidly in the premise of decoupling state.Hence,the coupling effect is also an important factor affecting the SADT.In the actual storage of energetic materials, it is difficult for the heat generated inside to diffuse to the external environment with increasing mass.The heat accumulation increases the internal temperature and accelerates the reaction.
4.Conclusions
In the present work, we investigate the endothermic and exothermic coupling of two representative hazardous chemical materials, e.g.NQ and RDX, and analyze the influence of the coupling effect on thermal safety assessment by different calorimetric measurements and calculations.The STA and microcalorimeter experiments show that endothermic stage and exothermic stage of NQ and RDX are coupled,and partial decomposition starts in the solid-liquid mixed state.The sample mass and coupling effect are important factors affecting the thermal safety of NQ and RDX.With the increase of mass, the heat accumulation effect in the reaction process increases, leading to the gradual reduction of decomposition temperature.The Tonsetof NQ and RDX after decoupling fall in the range of 159.5-175.9°C and 185.6-203.2°C,respectively.The Tonsetafter decoupling is lower than that of coupling.In the early stage,the endothermic stage makesthe partial decomposition exothermic stage unobservable.It is easy to make an incorrect judgment on whether the material is decomposed,and preventive measures should be taken.
Compared to the coupling state,when the initial temperature is the same under adiabatic conditions, the TMRadunder decoupling condition is lower than that under coupling condition.Under certain mass conditions, the time of thermal runaway inside the sample decreases and the SADT increases.The calculation results after decoupling show that the rescue time will be greatly reduced after the thermal runaway of NQ and RDX reaction.Hence, in the safety evaluation of hazardous chemical materials with coupling effect, the decoupled safety parameter is of more practical reference significance.It provides scientific basis for the safety control and accident prevention of the production, storage and transportation of hazardous chemical materials.
Declaration of competing interest
The authors declare that they have no known competing financial interests or personal relationships that could have appeared to influence the work reported in this paper.
Acknowledgements
This paper is supported by the project of the Open Research Fund Program of Science and Technology on Aerospace Chemical Power Laboratory(Grant No.STACPL320221B04).The authors also acknowledge the support from State Key Laboratory of Explosion Science and Technology (Beijing Institute of Technology).The project number is ZDKT21-01.

- Defence Technology的其它文章
- Ground threat prediction-based path planning of unmanned autonomous helicopter using hybrid enhanced artificial bee colony algorithm
- Layered metastructure containing freely-designed local resonators for wave attenuation
- Predicting impact strength of perforated targets using artificial neural networks trained on FEM-generated datasets
- Construct a 3D microsphere of HMX/B/Al/PTFE to obtain the high energy and combustion reactivity
- Ignition processes and characteristics of charring conductive polymers with a cavity geometry in precombustion chamber for applications in micro/nano satellite hybrid rocket motors
- Recent research in mechanical properties of geopolymer-based ultrahigh-performance concrete: A review