
Overexpression of TRPV1 activates autophagy in human lens epithelial cells under hyperosmotic stress through Ca2+-dependent AMPK/mTOR pathway
2024-03-20 06:33LiuHuiHuangJiaoLyuShengChenTingYiLiangYuQingRaoPingFeiJingLiHaiYingJinPeiQuanZhao
Liu-Hui Huang, Jiao Lyu, Sheng Chen, Ting-Yi Liang, Yu-Qing Rao, Ping Fei, Jing Li,Hai-Ying Jin, Pei-Quan Zhao
1Department of Ophthalmology, Shanghai Xinhua Hospital Affiliated with Shanghai Jiao Tong University School of Medicine, Shanghai 200092, China
2Department of Ophthalmology, Shanghai Tenth People’s Hospital Affiliated with Shanghai Tongji University School of Medicine, Shanghai 200072, China
3Centre for Eye Research Australia, Royal Victorian Eye and Ear Hospital, East Melbourne, Victoria 3002, Australia
4Ophthalmology, Department of Surgery, University of Melbourne, East Melbourne, Victoria 3002, Australia
5Shenzhen Eye Hospital, Shenzhen Key Laboratory of Ophthalmology, Affiliated Shenzhen Eye Hospital of Jinan University, Shenzhen 518040, Guangdong Province, China
6Department of Ophthalmology, Shanghai East Hospital,School of Medicine, Tongji University, Shanghai 200120,China
Abstract
● KEYWORDS: cataract; posterior capsular opacification;lens epithelial cell; hyperosmotic stress; autophagy;apoptosis; transient receptor potential vanilloid 1
INTRODUCTION
Despite advancements in modern intraocular lens design and surgical techniques, posterior capsular opacification(PCO) still occurs in approximately 100% of patients with congenital cataract which is mainly caused by epithelial proliferation[1].Recent studies have explored approaches that exploit changes in osmotic stress to target lens epithelial cells (LECs)—the main culprit of opaqueness in PCO[2-7].Introducing a hyperosmotic environment causes cell shrinkage,leading to apoptosis in LECs thereby removing them from the extracellular matrix.The clearance of LECs then restores clear eyesight for the patients.
In one of our previous studies, we were able to inject distilled water into the capsular bag using an air-fluid dropping technique to establish a hypotonic environment without touching the corneal endothelium.Desirable results were achieved, causing LECs to swell within 3min of incubation.Such an approach circumvents the disadvantages of current mainstream treatments for PCO such as neodymium-yttriumaluminum-garnet laser capsulotomy and surgical posterior capsulotomy, where risks of damaging the intraocular lens,causing intraocular lens tilt, and interfering with the vitreous volume are present.The new method may pave the way toward improved prevention of PCO and capsular fibrosis[8].
The efficacy of treating PCO by subjecting isolated capsular bags to hyperosmotic stress has also been investigated in several studies.LECs treated with hyperosmotic NaCl were found to exhibit a much higher apoptosis rate than LECs treated with distilled water[4].However, the study also reported an incomplete removal of LECs.This caught our interest, and we hypothesized that the remaining LECs may hold answers that will further improve the hyperosmotic treatment approach.Autophagy which is a self-degradation mechanism recycles intracellular components through the lysosomal machinery and has been reported to be stimulated in different cell types under hyperosmotic stress, including corneal cells, podocytes,hamster ovary cells, and nucleus pulposus cells[9-12].It plays a key role in maintaining cellular homeostasis and could be the reason that allows LECs to survive hyperosmotic environments.We thus aimed to thoroughly investigate the mechanisms from an autophagy perspective, which is a direction relatively untouched given that previous studies mainly focused on the protein changes for this topic.We adopted a stricter standard of 600 mOsm for 6h, which studies have proven would lead to significant apoptosis of epithelial cells, leaving only a small number of functional cells[13-14].This would minimize the chances of cells remaining viable by chance, helping us identify significant characteristics and mechanisms that would prevent apoptosis under an extreme hyperosmotic environment.
MATERIALS AND METHODS
ReagentsThe TRPV1 agonist (E)-capsaicin (Abcam,ab141000, UK), the autophagy inhibitor 3-methyladenine(Selleck, S2667, USA), the autophagy agonist rapamycin(Selleck, S1039, USA), the autophagy inhibitor bafilomycin A1 (Baf-A1; Selleck, S1413, USA), and bis-(o-aminophenoxy)ethane-N, N, N’, N’-tetraacetic acid, tetra(acetoxymethyl)ester (BAPTA-AM; Selleck, S7534, USA) were utilized in this research.
Cell Culture and TreatmentThe LECs (SRA0104) were a gift from Prof.Yongxiang Jiang and Prof.Dan Li at Fudan University and were identified by the Shanghai Biowing Applied Biotechnology Co., Ltd.(hina) before our experiment.They were incubated in Dulbecco’s modified Eagle’s medium(HyClone, SH30243.01, USA) supplemented with 10% fetal bovine serum (Gibco, 10099-141, USA) and 1% antibiotic(penicillin/streptomycin; Yeasen, P5131110, China) at 37℃with 5% CO2.Mannitol (Sigma, M4125, USA) and distilled water were used to adjust the osmotic pressure, which was quantified with a vapor pressure osmometer (Wescor, model 5600, USA).
Western BlottingTotal proteins were prepared by lysing LECs in ice-cold radioimmunoprecipitation assay lysis buffer (Beyotime, P0013B, China) in the presence of protease inhibitors (Roche, #0469313200, Switzerland) and phenylmethylsulfonyl fluoride (Beyotime, ST506, China).After ultrasonic pulverization, vortexing and centrifugation were performed to separate cell debris, and the protein concentrations were measured with a bicinchoninic acid protein assay kit (Thermo, #23235, USA).A sodium dodecyl sulfate-polyacrylamide gel electrophoresis (SDS-PAGE)Gel Fast Preparation Kit (EpiZyme, PG110, PG112, PG113,and PG114, China) was used to prepare SDS-PAGE gels at different concentrations (6%, 10%, 12.5%, and 15%) in line with the molecular weight of the target protein.Thirty micrograms of protein were loaded in each well of the SDSPAGE gel, and the proteins were electrophoresed at 80 V for 30min before being transferred to 120 V.After the loading buffer ran to the end of the gel, specific proteins were electrophoretically transferred to a polyvinylidene fluoride membrane at 300 mA for 30min to detect LC3B proteins,and at 250 mA for 90min to detect other proteins.After blocking with 5% nonfat milk at room temperature (RT) for 2h, the membranes were washed with Tris-buffered saline with Tween-20 (TBST) for 5min.Polyvinylidene fluoride membranes containing specific proteins were incubated with primary antibodies for 12 h at 4℃.The primary antibodies were as follows: anti-transient receptor potential vanilloid 1(TRPV1) antibody (Alomone labs, # ACC-030, rabbit), anti-LC3B antibody (CST, #2775, 1:1000, rabbit), anti-LC3B antibody (E5Q2K; CST, #83506, 1:1000, mouse), anti-Beclin 1 antibody (D40C5; CST, #3495, 1:1000, rabbit), antisequestosome-1 (SQSTM1) antibody (Proteintech, #18420-1-AP, 1:1000, rabbit), anti-autophagy-related gene (ATG) 7(D12B11; CST, #8558, 1:1000, rabbit), anti-p70S6K antibody(CST, #9202, 1:1000, rabbit), anti-phospho-p70S6K (Thr389)antibody (CST, #9234, 1:1000, rabbit), anti-mammalian target of rapamycin (mTOR) antibody (CST, #2972, 1:1000,rabbit), anti-phospho-mTOR antibody (Ser2448; CST, #2971,1:1000, rabbit), anti-AMP-activated protein kinase (AMPK) α antibody (CST, #2532, 1:1000, rabbit), anti-phospho-AMPKα(Thr172) antibody (CST, #2535, 1:1000, rabbit), and anti-βactin antibody (CST, #4970, 1:5000, rabbit or CST, #3700,1:5000, mouse).After three washes with TBST for ten minutes each, the membranes were incubated with either peroxidaseconjugated goat anti-mouse or anti-rabbit IgG (H+L; Yeasen,#33201ES60 or #33101ES60, 1:5000, mouse or rabbit)secondary antibodies.After another three washes with TBST for ten minutes each again, luminescence reagent (Millipore,WBKLS0500, USA) was utilized to detect the signal, which was finally analyzed with Image J software (National Institutes of Health, Bethesda, MD, USA) and normalized to the signal of a housekeeping protein.
Cellular Immunofluorescence StainingCells were plated in 24-well plates with prepared cell slides.After stimulation with different hyperosmotic solutions, the cells were washed with cold phosphate-buffered saline (PBS; HyClone, SH30256.01,USA) three times, and later fixed with methanol for 10min at-20℃.The cells were washed with cold PBS three times and blocked with 5% bovine serum albumin for 1h at RT.After draining the bovine serum albumin, the cells were incubated with an anti-LC3B primary antibody (CST, 1:200, rabbit) for 12h at 4℃.The cells were then incubated with the secondary antibody, which is Alexa Fluor 488-conjugated goat antirabbit IgG H&L (Beyotime, A0423, China).Next, the cells were incubated with a 4’,6-diamidino-2-phenylindole (DAPI)staining solution (Beyotime, C1005, China).The cells were visualized and imaged with an Olympus fluorescence microscope.Real-Time Quantitative Polymerase Chain ReactionAfter stimulation with a hyperosmotic gradient at a density of 5×10⁵cells per well, the cells were washed three times with cold PBS.TRIzol reagent (Invitrogen, #15596026, USA) was utilized to extract total RNA from the cells in line with themanufacturer’s guidance.A PrimeScriptTMRT Reagent Kit(Takara, RR036A, Japan) was used to reverse-transcribe the total RNA into cDNA.The primers used to amplify cDNAs are listed in Table 1.The SYBR Green method (Takara,RR420A, Japan) was utilized to perform quantitative reverse transcription-polymerase chain reaction (RT-qPCR).Using the equation fold change=2-ΔΔct, all values were normalized to β-actin expression and evaluated.
Cell Counting Kit-8 AssayPBS was utilized to wash cells after exposure to stress via a hyperosmotic gradient.Then, the cells were incubated with Cell Counting Kit-8 (CCK-8) reagent(Dojindo, CK04-500T, Japan) at 37℃ for 30min.Finally, the absorbance was recorded at 450 nm with a Beckman Coulter DTX 880 instrument.
Wound Closure AssayAfter two parallel lines were marked on inverted 6-well plates, 5×10⁵cells were seeded in each well.When the cells had grown to 80% confluence, they were starved without serum for 6h.A 200-μL pipette tip was utilized to quickly mark the cell monolayers along two parallel lines perpendicular to the original mark.The cells were then subject to an osmotic pressure gradient and imaged with a Leica fluorescence microscope at different time points.The equation used to calculate the proportion of wound healing is as follows:[1-(empty area × h/empty area 0h)]×100.
Measurement of Mitochondrial Membrane PotentialAfter exposure to different hyperosmotic pressures for 6h at 37℃, the culture medium was aspirated and the cells were washed twice with PBS.For the negative control group and the experimental group, 1 mL of 5,5’,6,6’-tetrachloro-1,1’,3,3’-tetraethylbenzimidazolyl-carbocyanine iodide (JC-1)working buffer with the fluorescent probe JC-1 (Beyotime,C2006, China) and 1 mL of medium were mixed in a 6-well plate.Then, the plate was incubated at 37℃ for approximately 20min.Meanwhile, 10 mmol/L carbonyl cyanide m-chlorophenylhydrazone (CCCP) was added at a ratio of 1:1000 for 20min as a positive control.During the incubation period, 4 mL of distilled water was added to every 1 mL of 5× JC-1 staining buffer to prepare 1× JC-1 staining buffer,which was placed in an ice bath.After incubation at 37℃ for 20min, the supernatant was aspirated before the cells were washed twice with an appropriate amount of JC-1 staining buffer to remove the JC-1 staining working buffer.Two milliliters of cell culture medium were added, and the cells were observed and imaged via laser confocal microscopy(Olympus, CKX41, Japan).The degree of mitochondrial depolarization was quantified by calculating the ratio of red/green fluorescence intensity.In the system used, normal mitochondria emitted red light, but unhealthy mitochondria emitted green fluorescence due to a decrease in or loss of Measurement of mitochondrial membrane potential (MMP).The mitochondrial red/green fluorescence intensity was evaluated with Image J 1.52a software to determine the change in the MMP.
Analysis of Apoptosis and Intracellular Ca2+ Flow using Flow CytometryThe Ca2+indicator Fluo-4 acetoxymethylester (Fluo-4 AM, Invitrogen, # F14217, USA)and a fluorescein isothiocyanate (FITC) Annexin V apoptosis detection kit (BD Pharmingen, #556547, USA) were utilized.When LECs had grown to 80% confluence, they were treated with different osmotic pressures.The cells were washed 3 times with precooled PBS, and the resuspended cells were transferred to a centrifuge tube.After centrifugation, the cells were resuspended in identical binding buffer and transferred to a 5-mL flow tube.One control group lacked both FITC and propidium iodide (PI); one had only FITC; one had only PI;and one had a mixture of FITC and PI delivered in sequence.The experimental group received a mixture of FITC and PI in sequence.Then, the samples were incubated with no light for 15min.Next, 200 μL of binding buffer was added to each tube to resuspend the cells.Flow cytometry (BD Biosciences FACSCalibur, San Jose, CA, USA) was performed to identify the fluorescence intensity in each group of cells.The Ca2+indicator Fluo-4 AM was used to measure Ca2+transients.According to the formula 50 μg=9.11 μL×1096.95, 9.11 μL of dimethyl sulfoxide was utilized to dilute the Ca2+indicator Fluo-4 AM, and then 9.11 mL of Hank’s balanced salt solution(HBSS) was utilized to resolve the indicator.After 3 washes with PBS, the cells were incubated with the indicator at 37℃in the dark for 30min.The samples were shaken several times in the middle of the incubation step and mixed thoroughly.HBSS containing the fluorescent probe was removed, and new HBSS was added; the cells were incubated for half an hour.The HBSS was removed, and the cells were washed 3 times with PBS.The cells were resuspended in 300 μL of PBS, and the fluorescence intensity of each group of cells was detectedviaflow cytometry.
Small Interfering RNA TransfectionThe following small interfering RNAs (siRNAs) were obtained from GenePharma:negative control, forward primer, 5’-CAT GTA CGT TGC TAT CCA GGC-3’, reverse primer, 5’-CTC CTT AAT GTC ACG CAC GAT-3’; and ATG7 siRNA, forward primer, 5’-CCA ACA CAC UCG AGU CUU UTT -3’, reverse primer,5’- AAA GAC UCG AGU GUG UUG GTT -3’.In line with the manufacturer’s guidance, mixtures of 8 μL of FuGENE HD transfection reagent (Promega, E2311/2, USA) and 1.5 μg of siRNA were mixed well in 100 μL of serum-free medium for 10min and added to a 6-well plate at 60% confluence.After transfection and treatment, the cells were treated with hyperosmotic pressure and normal pressure.RT-qPCR was performed to compare the expression of the target genes after normalization to β-actin.
pcTRPV1 Plasmid Production and TransfectionThe pcTRPV1 plasmid [shABX5823, pcDNA3.1-Myc-His (+) A]was purchased from Shanghai Sangon Biotech Company and amplified in bacteria grown in Luria-Bertani medium.An EndoFree Maxi Plasmid Kit V2 (Tiangen, DP120, Beijing) was used to extract pcTRPV1.Cells were seeded with antibioticfree medium and cultivated for at least 24h (until just before the cell density reached 80%).pcTRPV1 was mixed with serum-free medium, 2 μg of plasmid and 8 μL of FuGENE HD Transfection Reagent (Promega, E2311/2, USA) in a 100-μL volume.The mixture was incubated for 10min at RT.The mixture was added to 6-well plate, which were again cultured.After 48h, the cells were washed with cold PBS, and collected for RT-qPCR.
Autophagic FluxIn line with the manufacturer’s guidance,we determined the transfection conditionsviapreliminarily testing with a stubRFP-sensGFP-LC3 lentivirus (GeneChem,#GPL2001A, China) and constructed a stable monoclonal strain using the 96-well monoclonal dilution method.Cells infected with the lentivirus were treated with 1) normal pressure, 2) hyperosmotic pressure (600 mOsm), 3) rapamycin(10 μmol/L); 4) hyperosmotic pressure (600 mOsm) with rapamycin.Finally, images of the cells were capturedviaan Olympus FluoView? 1000 confocal microscope (Olympus,America).The red indicators represented autophagolysosomes.Colocalization of green indicators and red indicators (yellow indicators) represented autophagosomes.Autophagolysosome signals increased with increasing autophagosome signals.Autophagy induction resulted in increases in both yellow and red puncta in the rapamycin, 600 mOsm, and 600 mOsm+rapamycin groups in our research.
Scanning Electron Microscopy ObservationAfter exposure to different hyperosmotic pressures, the medium was discarded without rinsing, and electron microscope fixation buffer was quickly added (Servicebio, G1102, China).The cells were scraped gently in one direction and collected into a centrifuge tube.The buffer was discarded, and a new electron microscopy fixative buffer was added for fixation at RT for 2h, after which the cells were transferred to 4℃ for storage.The cells were washed with 0.1 mol/L PBS (pH 7.4) three times for 15min each.Then, tissue blocks were transferred to 1% OsO4in 0.1 mol/L PBS for one and a half hours at RT.Afterward, the cells were washed with PBS three times for 15min each.We used 30%, 50%, 70%, 80%, 90%, 95%, and two changes of 100% ethanol and isoamyl acetate for dehydration for 15min.After drying, the samples were attached to metallic stubs and photographedviaa scanning electron microscope (Hitachi,SU8100, Japan).
Data AnalysisGraphPad 6.0 software was utilized to evaluate the data, which are shown as the means±(SEM).The statistical significance (aP<0.05,bP<0.01,cP<0.001,dP<0.0001, and ns>0.05) of differences in each variable was estimated using one-way ANOVA or pairedt-test.
RESULTS
Hyperosmotic Stress Induces Autophagy-Related Factor Expression in Lens Epithelial CellsTotal cellular mRNA extracted from different groups was analyzed using RT-qPCR to determine whether hyperosmotic stress-induced autophagy in LECs.Figure 1A-1C shows the results of RT-qPCR analysis of ATG5, ATG7 and Beclin 1 mRNA, which revealed increased autophagy levels.Using human β-actin mRNA as a control, the relative mRNA expression of ATG5, ATG7 and Beclin 1 significantly increased by 3.549±0.401 times(P<0.001), 2.156±0.241 times (P<0.0001), and 1.738±0.430 times (P<0.001), respectively, at 600 mOsm.However,compared with the control group, the groups exposed to 300,400, and 500 mOsm showed no significant differences in the expression levels of these autophagy-linked factors(P>0.05).
LC3B, Beclin 1 and SQSTM1 protein levels were detected using Western blotting to confirm the hypothesis that increased autophagy is an adaptative mechanism of LECs exposed to hyperosmotic stress (Figure 1D-1G).Western blot analysis conducted using human β-actin as the internal reference protein (Figure 1H-1K) showed that the LC3B-II to LC3B-I conversion increased by 3.17 times (P<0.0001), 5.24 times(P<0.05), 6.11 times (P<0.0001) and 3.55 times (P<0.01)in the 600 mOsm group compared to the respective control groups.Under 500 mOsm stimulation, the LC3B-II to LC3B-I conversion increased by 2.99 times (P<0.001) and 2.32 times(P<0.05) at 6h and 18h, respectively.A significant difference was not observed between the 300 and 400 mOsm groups(P>0.05).The results of an immunofluorescence assay (Figure 1P)showed the cells in the 600 mOsm group exhibited increased numbers of obvious cytoplasmic green fluorescent puncta indicating LC3B expression, consistent with the Western blotting results.We also analyzed an autophagosome cargo, the SQSTM1 protein, which is degraded if autophagy is activated[15].SQSTM1 protein levels were significantly decreased after 6h and 12h of stimulation with 600 mOsm (P<0.01 andP<0.05; Figure 1L, 1M).No significant differences were noted in the 300, 400, or 500 mOsm groups at 6, 12, 18, or 24h(P>0.05).In addition, a significant difference was not observed between the 600 mOsm group and the control group at 18h or 24h (P>0.05), which was probably due to a response that promoted apoptosis.Beclin 1 is a key regulator maintaining the balance between the prosurvival autophagy pathway and proapoptotic responses[16].Western blotting (Figure 1N)revealed significantly increased Beclin 1 protein expression in the 500 and 600 mOsm groups after hyperosmotic stress for 6h (P<0.0001,P<0.05), but the Beclin 1 level was not significantly altered by 300, 400, or 500 mOsm stimulation(P>0.05).In addition, there was no significant difference after stimulation with 500 or 600 mOsm for 12h or 18h or after stimulation with 300, 400 or 500 mOsm for 24h (P>0.05).However, Beclin 1 protein expression decreased significantly after stimulation with 600 mOsm for 24h (P<0.01), due to the dual involvement of Beclin 1 in regulating both autophagy and apoptosis (Figure 1O).The mechanism by which Beclin 1 participates in apoptosis inhibition is currently unclear, but unregulated autophagy may lead to the activation of apoptosis as an adaptive or anti-injury mechanism[17].Transmission electron microscopy (TEM) was used to detect the formation of autophagosomes and autophagolysosomes and to further evaluate the effect of autophagy (Figure 1Q).The results revealed that the 600 mOsm group displayed increased numbers of autophagosomes and autophagolysosomes in the cytoplasm.Based on these findings, we chose 600 mOsm and 6h as the experimental conditions for all subsequent assays.
Rapamycin Augments Hyperosmotic Stress-Induced Autophagy in Lens Epithelial CellsWe further investigated the role of autophagy by adding an autophagy agonist(rapamycin, 10 μmol/L) and autophagy inhibitor (Baf-A1,0.1 μmol/L) to cells, and a change in autophagy level was observed (Figure 2A-2D).After the addition of rapamycin,the conversion of LC3B-II to LC3B-I substantially increased(P<0.05) in the rapamycin group.In contrast with the 600 mOsm group, the ratio of LC3B-II to LC3B-I protein expression in the 600 mOsm+rapamycin cotreatment group significantly increased (P<0.001), proving that rapamycin increased the conversion of LC3B-II to LC3B-I in LECs under hyperosmotic stress.
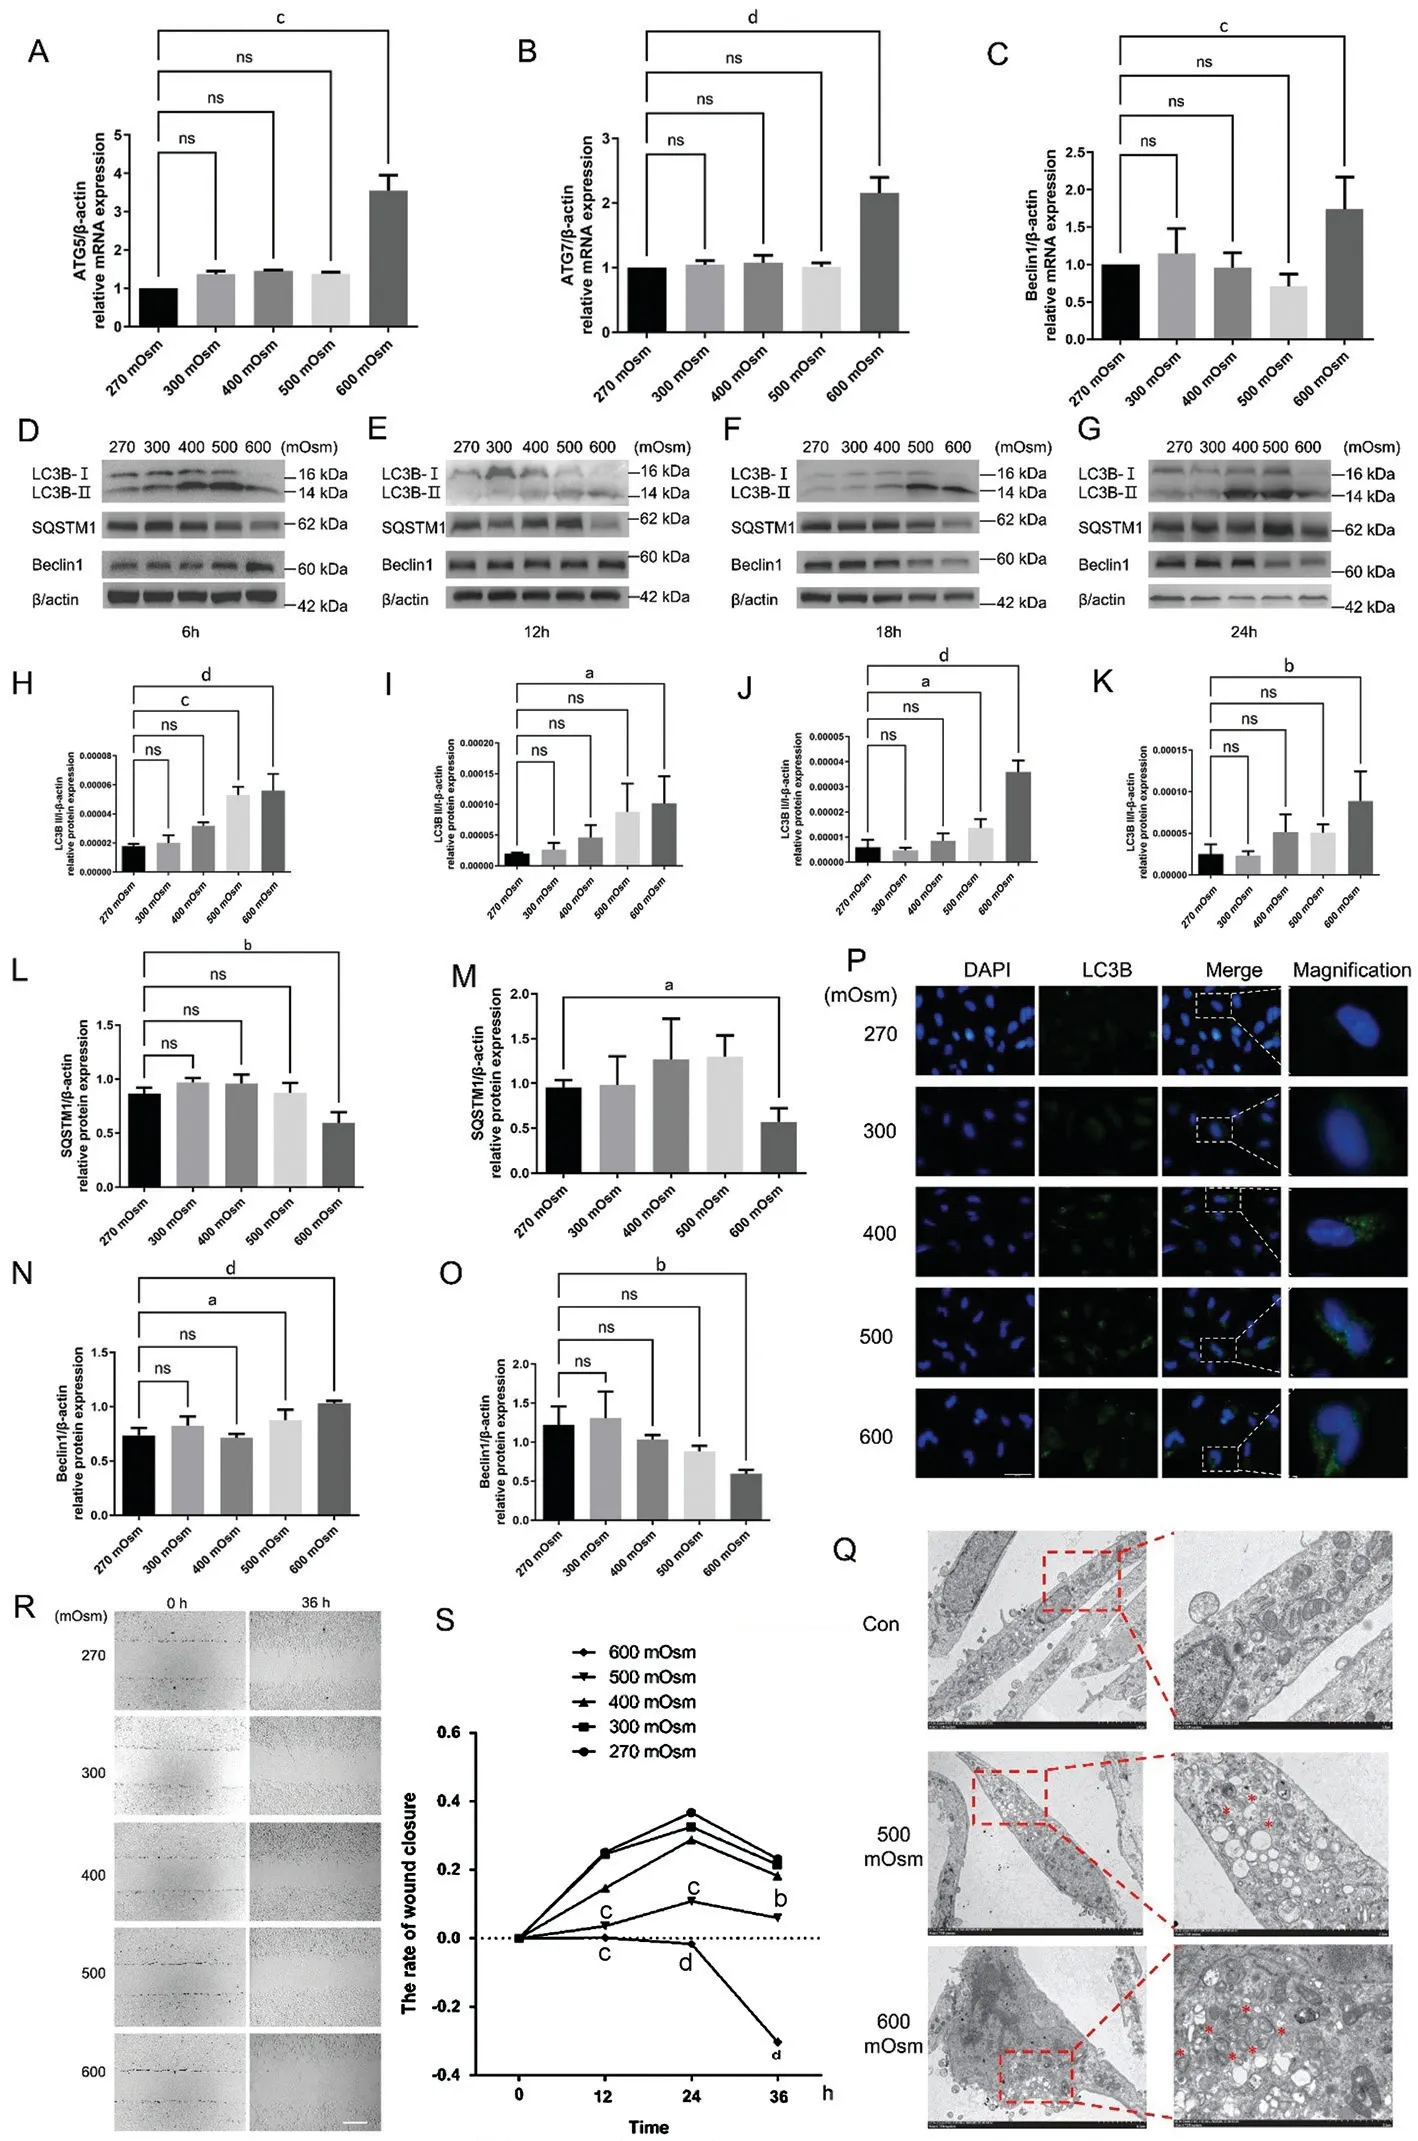
Figure 1 Hyperosmotic stress induced the expression of autophagy-linked factors in LECs and reduced cellular migration A-C: Impact of various hyperosmotic stress levels on the relative mRNA expression of ATG5, ATG7 and Beclin1 at 6h, as detected using RT-qPCR.D-G.LECs were treated with various osmotic pressures (270, 300, 400, 500, and 600 mOsm) for 6h (D), 12h (E), 18h (F) and 24h (G), and the protein levels of LC3B II and I, SQSTM1 and Beclin 1 were assessed using Western blotting.H-K: Quantitative analysis of the conversion of LC3B-II to LC3B-I after 6h (H), 12h (I), 18h (J), and 24h (K).L: Quantitative analysis of SQSTM1 protein expression after 6h using one-way ANOVA.M: Quantitative analysis of differences in SQSTM1 protein expression after 12h between the 270 and 600 mOsm groups using a paired t-test.N: Quantitative analysis of Beclin1 protein expression after 6h.O: Quantitative analysis of Beclin1 protein expression after 24h.P: The effects of various hyperosmotic stresses on LC3B protein expression as observed using immunofluorescence staining at 6h.Blue: Nuclear staining (DAPI); Green:LC3B staining.Scale bar: 200 μm.Q: TEM showed increases in the number and size of autolysosomes (red star) after 500 and 600 mOsm treatment at 6h.Scale bars: 5 μm and 2 μm, respectively.R: The effects of various hyperosmotic stresses on the migration of LECs were detected using a wound closure assay at 6h.Scale bar: 2 mm.S: Quantitative analysis of the data presented in R.aP<0.05, bP<0.01, cP<0.001, and dP<0.0001 indicate significant differences from the control, and ns indicates no significant difference.All experiments were repeated at least three times.LC3: Microtubule-associated protein 1 light chain 3; LEC: Lens epithelial cell; DAPI: 4’,6-diamidino-2-phenylindole; TEM: Transmission electron microscopy; ATG: Autophagy-related gene; SQSTM1: Sequestosome-1; RT-qPCR: Quantitative reverse transcription-polymerase chain reaction;ANOVA: Analysis of variance.

Figure 2 Rapamycin enhanced the expression of autophagy-linked proteins in LECs under hyperosmotic stress A: The conversion of LC3BII to LC3B-I was assessed using Western blotting after cotreatment with rapamycin and 600 mOsm at 6h.B: Quantitative analysis of the data presented in A.C: The conversion of LC3B-II to LC3B-I was assessed using Western blot assay after cotreatment with Baf-A1 and 600 mOsm at 6h.D: Quantitative analysis of the results presented in C.E: Autophagic flux was detected after hyperosmotic stress and rapamycin cotreatment in cells expressing the stubRFP-sensGFP-LC3 lentivirus at 6h.Scale bar: 100 μm.aP<0.05, bP<0.01, and dP<0.0001 indicate significant differences from the control.All experiments were repeated at least three times.LC3: Microtubule-associated protein 1 light chain 3; LEC: Lens epithelial cell; Baf-A1: Bafilomycin A1.
However, Western blotting results (Figure 2C, 2D) did not indicate a significant difference between the control group and Baf-A1 group (P>0.05), indicating that Baf-A1 did not exert a significant effect on the basal autophagy level of LECs.Compared with the 600 mOsm group, the conversion of LC3BII to LC3B-I increased after the addition of Baf-A1 (P<0.05),proving that the inhibitory effect of Baf-A1 stimulation on the LC3B protein was not pronounced.The detection of autophagic flux using an LC3B dual-fluorescence lentivirus transfection experiment (Figure 2E) showed that the number of yellow spots increased sequentially in the rapamycin group,600 mOsm group and rapamycin+600 mOsm cotreatment group in contrast with the control group, suggesting that rapamycin augmented hyperosmotic-induced increases in autophagy.
ATG7-targeting siRNA Attenuates the Expression of Autophagy-Related Factors in LECsATG7, a multifaceted core ATG protein, is critical for the formation of the autophagosome by supporting ATG8 lipidation, linking ATG12 to ATG5 as an E1-like enzyme, and activating LC3-I generation by ATG7 adenylation[18].With human β-actin mRNA as an internal reference, RT-qPCR analysis demonstrated a significant decrease in the relative expression of ATG7 mRNA in the ATG7-targeting siRNA (siATG7) group to 50% of that in the control group (P<0.0001).However, a significant difference was not observed between the negative control siRNA and control groups (P>0.05), indicating that the ATG7 knockdown was successful (Figure 3A).The relative expression of SQSTM1 mRNA in the 600 mOsm+siATG7 cotreatment group was significantly increased (P<0.01),suggesting that the level of autophagy was reduced after ATG7 knockdown (Figure 3B).We further used Western blot analysis to select the siRNA with the highest efficiency of ATG7 knockdown (Figure 3C, 3D).The ratio of the relative expression of LC3B-II to LC3B-I proteins in the 600 mOsm+siATG7 cotreatment group was significantly decreased(P<0.01; Figure 3E, 3F), whereas the relative expression of the SQSTM1 protein in the 600 mOsm+siATG7 cotreatment group was significantly increased (P<0.01; Figure 3G, 3H)compared with that in the 600 mOsm group.Generally, these findings indicate that combining siATG7 and hyperosmotic stress attenuates the expression of autophagy-related factors.Inhibition of autophagy may further reduce the survival of LECs and induce apoptosis, in combination with hyperosmotic stress this can further delay the occurrence of PCO.

Figure 3 An siRNA targeting ATG7 attenuated autophagy in LECs A: Expression of ATG7 mRNA after knockdown via siRNA.B: The effects of various hyperosmotic stresses on the relative expression levels of SQSTM1 mRNA at 6h were detected using RT-qPCR.C: Expression of the ATG7 protein after knockdown via siRNA.D: Quantitative analysis of the data presented in C.E: The conversion of LC3B-II to LC3B-I was assessed using Western blot assay after cotreatment with siATG7 and 600 mOsm at 6h.F: Quantitative analysis of the data presented in E.G: SQSTM1 expression was assessed using Western blotting after cotreatment with siATG7 and 600 mOsm at 6h.H: Quantitative analysis of the results presented in G.aP<0.05, bP<0.01, and dP<0.0001 indicate significant differences from the control; ns indicates no significant difference.All experiments were repeated at least three times.ATG: Autophagy-related gene; siRNA: Small interfering ribonucleic acid; LC3: Microtubuleassociated protein 1 light chain 3; ATG: Autophagy-related gene; SQSTM1: Sequestosome-1; LEC: Lens epithelial cell; RT-qPCR: Quantitative reverse transcription-polymerase chain reaction.
Hyperosmotic Stress Augments the Ca2+-Dependent AMPK/mTOR Signaling PathwayThe proteins AMPK,mTOR and p70S6K protein are closely associated with autophagy and constitute a canonical pathway in which AMPK directly activates ULK1 protein directly and inhibits mTOR, but mTOR controls ULK1 ubiquitylation and mediates p70S6K activity[19].Western blotting showed a significant decrease in the level of the phosphorylated mTOR protein in the 600 mOsm group after 6h (P<0.01), whereas the mTOR phosphorylation status remained unchanged from its control value during exposure to either 400 mOsm or 500 mOsm(P>0.05; Figure 4A, 4B).Similarly, the phosphorylation status of the AMPKα protein was increased only at 6h in the 500 mOsm and 600 mOsm groups (P<0.01 andP<0.0001), while the levels in the 300 mOsm group and 400 mOsm group did not exist statistical difference (P>0.05; Figure 4C, 4D).On the other hand, the phosphorylation status of the p70S6K protein increased in the 400 and 500 mOsm groups after 6h (P<0.05 for both; Figure 4E, 4F).
siRNA Targeting ATG7 Reduces Cell Viability Under Hyperosmotic StressThe results of CCK-8 experiment(Figure 5A) showed that cell survival was significantly reduced in the 400, 500, and 600 mOsm groups at 6h, 12h, 18h, 24h,and 48h (P<0.05 for all).The cell survival rate in the 300 mOsm group at 48h was significantly lower than that in the control group (P<0.05), but the difference was not significant at 6h, 12h, 18h, or 24h (P>0.05).Therefore, with the increase in hyperosmotic stress along a gradient, the viability of the LECs decreased progressively.The results of the CCK-8 experiment showed a significantly reduced survival rate in the siATG7 group (P<0.0001; Figure 5B).The cell survival rate in the 600 mOsm + siATG7 cotreatment group was significantly lower than that in the 600 mOsm group (P<0.0001; Figure 5B).Based on this finding, ATG7 knockdown significantly exacerbated the reduction in cell viability after 600 mOsm stimulation.These findings indicate that autophagy is an osmoprotective response that is conducive to the survival of LECs under hyperosmotic stress.Inhibition of autophagyviaATG7 knockdown attenuated the ability of the LECs to degrade damaged and misfolded proteins via the autophagy pathway and further reduced the survival of LECs under hyperosmotic stress.
Hyperosmotic Stress Exposure Increases Apoptosis and Inhibits Cell MigrationThe results of the flow cytometry experiment (Figure 5C) showed significant increases in the total numbers of early and late apoptotic cells after exposure to hyperosmotic stress at 600 mOsm for 18h (P<0.01).In contrast, the application of 300, 400, and 500 mOsm did not significantly change the numbers of these cells (P>0.05).Apoptosis was induced after 18h of 600 mOsm hyperosmotic stress, as expected, indicating that the dynamic balance of the osmoprotectant involving autophagy and apoptosis was broken.In addition, the turning point for Beclin 1 protein expression in the previous Western blot assay, which first increased and then decreased, was 18h.This finding indicates that autophagy and apoptosis participate in the physiological process of hyperosmotic stress in LECs.This participation is associated with the BH3 domain of Beclin 1, which can bind to BCL-2 family proteins and thus regulate autophagy and apoptosis[20].
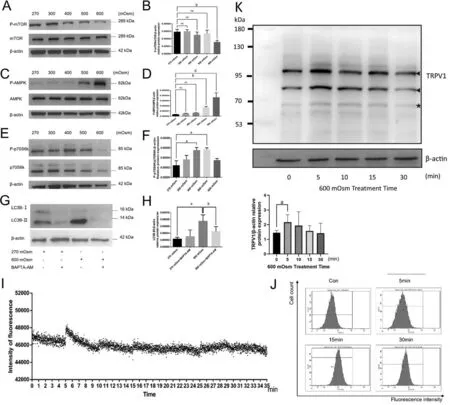
Figure 4 Hyperosmotic stress stimulated the Ca2+-dependent AMPK/mTOR pathway A: The effects of hyperosmotic stress on the levels of phosphorylated mTOR were assessed using Western blotting at 6h.B: Quantitative analysis of the results shown in A.C: The effects of hyperosmotic stress on the levels of phosphorylated AMPK were detected using Western blotting at 6h.D: Quantitative analysis of the data presented in C.E: The effects of hyperosmotic stress on the levels of phosphorylated p70S6k were detected using Western blotting at 6h.F:Quantitative analysis of the data presented in E.G: The effects of BAPTA-AM on the relative conversion of LC3B-II to LC3B-I in LECs treated with hyperosmotic stress were detected using Western blotting at 6h.H: Quantitative analysis of the data presented in G.I-J: The effects of hyperosmotic shock on intracellular Ca2+ levels were detected using a fluorescence microplate reader and flow cytometry.K: The TRPV1 protein expression at 0, 5min, 10min, 15min and 30min after 600 mOsm Treatment.The solid black triangle refers to the first and second band which are qualified the amount of TRPV1.The solid five-pointed star refers to the third band which is considered as degradation.The protein expression of TRPV1 increased mostly after 5min treatment by 600 mOsm.aP<0.05, bP<0.01, dP<0.0001 indicate significant differences from the control; ns indicates no significant difference.All experiments were repeated at least three times.AMPK: AMP-activated protein kinase;mTOR: Mammalian target of rapamycin; BAPTA-AM: Bis-(o-aminophenoxy) ethane-N, N, N’, N’-tetraacetic acid, tetra(acetoxymethyl) ester; LC3:Microtubule-associated protein 1 light chain 3; LEC: Lens epithelial cell; TRPV 1: Transient receptor potential vanilloid 1.
The MMP drives the generation of ATP by mitochondria.When the MMP is high, JC-1 aggregates in the mitochondrial matrix and produces red fluorescence.When MMP is low, JC-1 is monomeric and produces green fluorescence.The ratio of red/green fluorescence represents mitochondrial depolarization,which positively correlated with early apoptosis.We detected early apoptosis by performing an MMP assay to further assess whether apoptosis occurred during autophagy.The red/green fluorescence intensity ratio was significantly reduced after exposure to hyperosmotic stress in the 400, 500, and 600 mOsm groups (P<0.0001,P<0.0001, andP<0.0001),and the decrease in red/green fluorescence intensity was linked with increasing hyperosmotic stress (Figure 5D, 5E).Thus, hyperosmotic stress at 400, 500, and 600 mOsm induced stepwise declines in the MMP and promoted early cellular apoptosis; however, the red/green fluorescence intensity ratio of the 600 mOsm group was more significantly altered than those in the 400 and 500 mOsm groups, and the value in the 300 mOsm group did not significantly change (P>0.05).The difference between the control and rapamycin groups was not significant (P>0.05), suggesting that mTOR inhibition by rapamycin had little effect on the basal MMP (Figure 5F).However, compared with that in the 600 mOsm group, the ratio of red/green fluorescence intensity was significantly greater in the 600 mOsm+rapamycin cotreatment group (P<0.001),indicating that the MMP increased significantly, and that rapamycin (autophagic agonist) is important in inhibiting early apoptosis in cells under hyperosmotic stress (Figure 5G).Therefore, inhibition of hyperosmotic stress-induced mTOR activation by rapamycin suppresses apoptosis.
The scratch assay showed that stimulation with 500 and 600 mOsm for 12h, 24h, and 36h significantly reduced the healed area, indicating that the ability of the LECs to migrate was significantly decreased (P<0.001,P<0.001,P<0.01,P<0.001,P<0.0001, andP<0.0001, respectively).However,a statistical difference in the healed area was not observed between the 300 and 400 mOsm groups after exposure for 12h,24h, or 36h (P>0.05), indicating that hyperosmotic stress of at least 500 mOsm was required to suppress LEC migration(Figure 1R, 1S).
Involvement of Intracellular Ca2+ Levels in Autophagy ActivationA Fluo-4 AM fluorescence assay was performed using a fluorescence microplate reader to assess whether intracellular Ca2+participates in autophagy activation.A significant increase in fluorescence intensity was observed beginning after 5min of 600 mOsm stimulation (Figure 4I).The fluorescence subsequently decreased to the initial fluorescence intensity with fluctuations for up to 35min.Similar experimental results were obtained using flow cytometry to detect Fluo-4 AM fluorescence intensity, which showed that the fluorescence intensity started to increase after 5min of 600 mOsm treatment(Figure 4J).We used BAPTA-AM, an intracellular calcium ion chelator, to determine whether hyperosmotic stress affected autophagy by increasing Ca2+release from intracellular stores.Western blotting experiments showed (Figure 4G, 4H) that the expression of the LC3B protein in the 270 mOsm+BAPTAAM cotreatment group was not altered (P>0.05), indicating that BAPTA-AM had little impact on the basal level of autophagy.However, compared with the 600 mOsm group,a significantly lower expression of the LC3B protein was detected in the 600 mOsm + BAPTA-AM cotreatment group(P<0.01).The abovementioned results suggested that exposure to 600 mOsm hyperosmotic stress induces autophagy solely by mediating increases in Ca2+influx from the external environment.
Hyperosmotic Stress-Induced TRPV1 Activation Upregulates Autophagy-Related FactorsUsing human β-actin mRNA as the internal reference, RT-qPCR analysis showed significantly increased expression of TRPV1 mRNA in the pcTRPV1 group after transfection with a plasmid containing the TRPV1 sequence for overexpression (P<0.0001;Figure 6A), indicating that the TRPV1 plasmid had been successfully transcribed.The mRNA expression of ATG5,ATG7 and Beclin 1 significantly increased in the pcTRPV1 group (P<0.01,P<0.05, andP<0.01; Figure 6B-6D).Thus,TRPV1 overexpression enhanced the expression of autophagylinked factors in LECs under hyperosmotic stress.After the addition of the TRPV1 agonist, the protein expression of LC3B in the capsaicin group was not significantly altered compared with that in the control group (P>0.05; Figure 6E,6F), revealing that capsaicin had little effect on the basal level of autophagy.However, LC3B protein expression was significantly higher in the 600 mOsm+capsaicin cotreatment group than in the 600 mOsm group (P<0.05; Figure 6E, 6F),indicating that TRPV1 activation in cells under hyperosmotic stress stimulated autophagy.
DISCUSSION
This study reports several primary findings.1) LC3B and Beclin 1 are upregulated, and SQSTM1 is downregulated during early hyperosmotic stress in LECs.2) Beclin 1 is upregulated at the early stage of autophagy activation but is downregulated later due to apoptosis aggravation.3) The AMPK/mTOR pathway and intracellular Ca2+signaling are implicated in autophagy activation in cells under hyperosmotic stress.4) Inhibition of ATG7 enhances hyperosmotic stressinduced LEC apoptosis.5) TRPV1 overexpression activates hyperosmotic stress-mediated autophagy (a novel finding).

Figure 6 TRPV1 overexpression induced autophagy A-D: The effects of pcTRPV1 transfection on the relative mRNA expression of the TRPV1, ATG5, ATG7 and Beclin1 in LECs were detected using RTqPCR at 6h.E: The effects of capsaicin on the conversion of LC3B-II to LC3B-I in LECs treated with hyperosmotic stress at 6h, as detected using Western blotting.F: Quantitative analysis of the data presented in E.aP<0.05, bP<0.01, and dP<0.0001 indicate significant differences from the control.All experiments were repeated at least three times.siRNA: Small interfering ribonucleic acid; SQSTM1: Sequestosome-1;CAP: Capsaicin; TRPV1: Transient receptor potential vanilloid 1; RTqPCR: Quantitative reverse transcription-polymerase chain reaction;ATG: Autophagy-related gene; LC3: Microtubule-associated protein 1 light chain 3.
Autophagy, which includes microautophagy, macroautophagy,and chaperone-mediated autophagy, is a conserved eukaryotic cellular recycling mechanism that uses lysosomal selfdigestion to adjust cellular homeostasis[21].Autophagy activation is detected as an increase in Beclin 1 levels, the conversion of microtubule-associated protein 1 light chain 3 (LC3)-II to LC3-I and the degradation of sequestosome-1(SQSTM1)[15,22].ATG 7 is a prerequisite factor for the conjugation systems in class III phosphatidylinositol-3-kinaseindependent autophagosomes[23].Autophagy plays a central role in the loss of internal organelles, which is necessary for maintaining transparency in the lens[24].Inhibition of autophagy provided autophagy-related insights into preventing PCO by attenuating transforming growth factor beta 2-activated epithelial-mesenchymal transition in LECs[25].Thus, an imbalance in autophagy may increase the development of visual axis opacification and accelerate secondary vision damage in patients with cataracts[25].Based on previous articles, we further explored whether autophagy occurs in LECs under hyperosmotic stress using the SRA0104 cell line as a model and confirmed that autophagy is increased in LECs in the early stage of hyperosmotic stress.We found that the increase in autophagic flux in LECs under hyperosmotic stress was similar to the effect of rapamycin stimulation.The osmotic pressure gradient and time required to increase the autophagy level in LECs under hyperosmotic stress were first defined.After Baf-A1 + 600 mOsm cotreatment, LC3B protein accumulation was observed in LECs.Immunofluorescence analysis, autophagic flux, and TEM detected autophagosomes and autophagolysosomes, while ATG7 mRNA knockdown experiment further confirmed the activation of the autophagylysosome system.
Beclin 1 protein levels were not significantly higher than the control levels after 12h or 18h of hyperosmotic stress but were significantly reduced at 24h.What caused the differences in changes in Beclin 1 expression during exposure to hyperosmotic pressure over time? Beclin1, a multifunctional protein, is vital for autophagosome formation and endocytic trafficking[26].In addition, it can cause cell death by obstructing vesicle processing in the later stage of the autophagic cascade[27].According to previous studies, the phosphorylation and ubiquitination of Beclin 1 at a series of residues can finetune responses to multiple regulators of autophagy and help maintain the balance between autophagy and the apoptosis response[16].Therefore, we speculate that early stimulation with hyperosmotic pressure may activate autophagy to enable adaptation to the hyperosmotic pressure; however, with prolonged hyperosmotic pressure stimulation, the balance between autophagy and apoptosis is disrupted, which leads to irreversible cell death.
Mitochondrial dysfunction, which includes a decrease in the MMP, a change in mitochondrial membrane permeability, a decrease in cytokine membrane permeability, and the release of cytochrome C, leads to apoptosis[28].In our study, the MMP was decreased in the 400, 500, and 600 mOsm groups according to the results of a JC-1 fluorescent probe experiment.When the osmotic pressure increased, the decrease in MMP was exacerbated.After exposure to hyperosmotic pressure for 18h,apoptosis was detected using flow cytometry.We detected a significant increase in numbers of early and late apoptotic cells in the 600 mOsm group.Upon rapamycin stimulation,the MMP in the normal pressure group remained unchanged.However, the MMP in the 600 mOsm group treated with rapamycin decreased, but the decrease was less pronounced than that in the 600 mOsm group, revealing rapamycin weekend mitochondrial depolarization.According to previous studies, autophagy maintains the integrity of mitochondria and reduces phagocytosis-induced damage.Therefore, autophagy may slow the decompensation of mitochondrial function to a certain extent, subsequently inhibiting apoptosis.We used ATG7 siRNA to further assess the association between autophagy and apoptosis and found that the expression of SQSTM1 mRNA increased after stimulation with 600 mOsm.Therefore, we conclude that autophagy activation may attenuate apoptosis in cells under hyperosmotic pressure.Autophagic pathways can be classified into mTOR-dependent or mTOR-independent pathways[29].Which pathway was activated to induce autophagy in LECs under hyperosmotic stress? AMPK, which is a metabolic receptor composed of α,β and γ subunits, is important in metabolism[30].If AMPK is stimulated, mTOR is inhibited; thus, autophagy is activated.Through Western blot analysis, we found that hyperosmotic stress caused phosphorylation of the AMPK protein and inhibited phosphorylation of the mTOR protein at 6h,indicating the enhancement of the AMPK/mTOR pathway.Additionally, we identified a crucial role for Ca2+influx in the activation of the autophagolysosome system through the AMPK/mTOR pathway.
As a second messenger, intracellular Ca2+exerts dual effects.An increase in the intracellular Ca2+level is mediated by the release from Ca2+stores or extracellular Ca2+influx[31].Previous studies have revealed that hyperosmotic pressure stimulates mitochondrial dysfunction and subsequently leads to apoptosis.Ca2+homeostasis is a decisive factor in the transparency of the lens.In addition, an increase in Ca2+concentrations is associated with cellular pathophysiology[32-33].Using a real-time fluorescence microplate reader and Fluo-4AM as a marker, we observed increased fluorescence of LECs,proving that Ca2+influx occurred.In addition, 400 mOsm and 500 mOsm promoted phosphorylation of the p70S6k protein, indicating an increase in Ca2+influx.BAPTA-AM is a discriminating calcium-chelating agent, and BAPTA-AM constrained the expression of LC3B, indicating that Ca2+influx is important for the stimulation of the autophagolysosome system.In conclusion, Ca2+influx is crucial in regulating the AMPK/mTOR pathway and the initiation of autophagy.
Like previous studies, our study revealed that migration in cells decreased under increasing hyperosmotic stress.Autophagy inhibition increases the rate of cell death under hyperosmotic stress.Therefore, we propose that inhibiting autophagy in cells under hyperosmotic stress increases apoptosis and reduces migration, thus removing LECs and preventing PCO.However, what is the molecular link between autophagy and hyperosmotic stress?
López-Hernándezet al[34]suggested that osmotic stress probably increases the cellular degradation capacity by inducing nuclear translocation of the transcription factor EB.In different types of wild-type lens cells, the intracellular static pressure gradient varies from 340 mm Hg for central cells to 0 for surface cells.In the lens, the inner fluid flows from the center to the exterior surface due to the transfer enzyme Na+/K+-ATPase in response to osmotic pressure; thus, the osmotic pressure of the surface cells is maintained at zero.Temporary response to hyperosmolarity or capsaicin in the lens is said to be initiated by Na+-K+-2Cl-cotransporters’ stimulation[35],and normal cells can tolerate hyperosmotic pressure by increasing KCl or NaCl concentrations through Na+-K+-2Clcotransporters and Na+-H+and Cl-HCO3 exchangers, thereby remaining unharmed.A regular volume increase mechanism also participates in this effect[35-40].Subsequently, Mandalet al[41]further identified the ERK1/2-dependent pathway to be responsible for TRPV1 activation under hyperosmotic stress.Such results were further supported by Shahidullahet al[35]where a hyperosmotic solution of 350 mOsm was found to activate TRPV1 and increase the level of Ca2+within 10min.Through activation of this dynamic signaling pathway,lens transmission activity is adjusted to guarantee that the optical characteristics of the lens are maintained[42].Does the TRPV1 protein mediate autophagy activation in LECs under hyperosmotic stress?
Transfection with a TRPV1 overexpression plasmid increased the mRNA expression of ATG5, ATG7 and Beclin 1.After treatment of TRPV1 agonist (capsaicin), we found that the conversion of LC3B-II to LC3B-I in the group treated with 600 mOsm + capsaicin was greater than that in the 600 mOsm group.Therefore, TRPV1 may participate in activating autophagy in LECs under hyperosmotic stress.However,furtherin vivoexperiments and clinical trials are needed.
Due to the diversity in cell statuses, tissue types, and methods of autophagy interference, the effect of autophagy on fibrosis in different cell types remains controversial.Ahnet al[43]reported that the TRPV1 protein was degraded by autophagy in response to starvation.However, others have stated that TRPV1 activates autophagy in vascular smooth muscle cells through the AMPK pathway[44].TRPV1 also activates autophagy in thymocytes by modulating the unfolded protein response[45].Although we do not yet know the full answer to this important question, our initial results suggest a possible role for TRPV1 in the activation of autophagy in LECs under hyperosmotic stress.The results of our study further verify that TRPV1 receptors are intricately related to mTOR, AMPK,and protein kinase B, which play influential roles in cellular survival and cellular metabolism.Cataract formation is enhanced by high Ca2+levels[46].Thus, the presence of TRPV1 in LECs suggests that TRPV1 may be involved in regulating the passage of Ca2+from the aqueous humor to the lens fibers.However, the mediating role of hyperosmotic stress induced TRPV1 activation in the control of autophagy during PCO requires further study.In addition, whether a combination of hyperosmotic stress with autophagy inhibition could delay the occurrence of PCO still requires further in vivo studies.Given the viable treatments that could be used to deliver using hyperosmotic solutions with autophagy inhibition, we believe our findings could have potential clinical uses in the future.The air/fluid dropping technique that our team has previously studied is one such example that can avoid damaging corneal endothelial cells[8].There is also room for additional improvement with the advent of hyperosmotic viscoelastic material that is currently being researched, which may be a preferred substitute over hyperosmotic solution.

Figure 7 Diagram showing the mechanism by which overexpression of TRPV1 activates autophagy in lens epithelial cells under hyperosmotic stress through the Ca2+-dependent AMPK/mTOR pathway TRPV1: Transient receptor potential vanilloid 1; AMPK:AMP-activated protein kinase; mTOR: Mammalian target of rapamycin.
In conclusion, we have further confirmed that the promotion of autophagy in LECs through the Ca2+-dependent AMPK/mTOR pathway is a cellular adaptation to hyperosmotic stress.TRPV1 might be essential in the activation of autophagy.Based on our research, hyperosmotic stress activates autophagy in LECs in a pressure-dependent manner.LECs stimulated with hyperosmotic stress exhibited increased apoptosis and decreased cell viability.Autophagy is inhibited by the knockdown of ATG7 expression, which results in the accumulation of SQSTM1 and a decrease in cell viability,indicating the protective effect of autophagy.Our discovery is a milestone in pushing our understanding of how LECs could escape lethal osmotic levels, which may be of interest to professionals investigating approaches of addressing PCO in this field (Figure 7).
ACKNOWLEDGEMENTS
We thank Prof.Yongxiang Jiang and Prof.Dan Li for giving us the lens epithelial cells (SRA0104) to us for this study.We also thank Dong Xiao, Yanchun Xu, Qiqiang Zhang, Xiang Zhang,Fengjie Xia, Maolin Zhu for assistance at the beginning of the experiment.
Authors’ contributions:Huang LH: Experimental design,completion of experiments, data curation, visualization,writing-original draft, writing-review & editing, and validation.Lyu J: Writing-review & editing.Chen S: Writingreview & editing.Liang TY: Writing-review & editing.Rao YQ: Experimental design.Fei P: Writing-review &editing.Li J: Experimental design.Jin HY: Experimental design, conceptualization, validation, writing review,funding acquisition, and overall responsibility.Zhao PQ:Conceptualization, validation, writing review, funding acquisition, and overall responsibility.
Foundations:Supported by the National Natural Science Foundation of China (No.82201199 to Huang LH,No.82171069 to Zhao PQ; No.81770964 to Zhao PQ),Melbourne Research Scholarship (Huang LH), the Shanghai Clinical Research Plan of Shenkang Hospital Development Center (No.SHDC2020CR4081 to Jin HY); the Shanghai Science and Technology Innovation Fund (No.20Y11910900 to Jin HY).
Conflicts of Interest:Huang LH,None;Lyu J,None;Chen S,None;Liang TY,None;Rao YQ,None;Fei P,None;Li J,None;Jin HY,None;Zhao PQ,None.
 International Journal of Ophthalmology2024年3期
- International Journal of Ophthalmology的其它文章
- Meibomian glands segmentation in infrared images with limited annotation
- Artificial intelligence for the detection of glaucoma with SD-OCT images: a systematic review and Meta-analysis
- Dry environment on the expression of lacrimal gland S100A9, Anxa1, and Clu in rats via proteomics
- Semaphorin 7A impairs barrier function in cultured human corneal epithelial cells in a manner dependent on nuclear factor-kappa B
- Novel MIP gene mutation causes autosomal-dominant congenital cataract
- A rare missense PAX6 mutation causes atypical aniridia in a three-generation Chinese family