
Investigation of Microstructure, Microhardness and Thermal Properties of Ag-In Intermetallic Alloys Prepared by Vacuum Arc Meltings
2024-04-10 10:38ELErevikATAESENERnarZTRKEsraAKSSezen
?EL?K Er?evik, ATA ESENER P?nar, ?ZTüRK Esra, AKS?Z Sezen
(1.Nev?ehir Hac? Bekta? Veli University, Department of Physics, 50300, Nev?ehir, Turkey; 2.Erciyes University, Graduate School of Natural and Applied Sciences, 38039, Kayseri, Turkey; 3.Kocaeli University, Department of Physics, 41380, Kocaeli, Turkey; 4.Nev?ehir Hac? Bekta? Veli University, Department of Physics, 50300, Nev?ehir, Turkey)
Abstract: Ag-In intermetallic alloys were produced by using vacuum arc furnace.Differential Scanning Calorimetry (DSC) and Energy Dispersive X-Ray Spectrometry (EDX) were used to determine the thermal properties and chemical composition of the phases respectively.Microhardness values of Ag-In intermetallics were calculated with Vickers hardness measurement method.According to the experimental results, Ag-34 wt%In intermetallic system generated the best results of energy saving and storage compared to other intermetallic systems.Also from the microhardness results, it was observed that intermetallic alloys were harder than pure silver and Ag-26 wt%In system had the highest microhardness value with 143.45 kg/mm2.
Key words: thermal properties; microstructure characterization; microhardness; alloys; material characterization
1 Introduction
An important reason why metallic materials are highly preferred is that their mechanical properties such as strength, hardness,etc, can be controlled.Since few experimental studies have been conducted on the thermophysical properties of intermetallic alloys today,Ag-In intermetallic alloy system was investigated to bring some important data to the literature[1].Especially at low temperatures Indium is an ideal metal for alloys and solders[1].When it is used as a coating material,it creates surfaces that are resistant to atmospheric effects.It also hardens gold and silver coatings.Also,silver is the most important part of the electrical and electronic sector with its stainless structure, brightness,and chemical properties[1].In soldering technology,due to its resistance to high temperatures and superior properties in terms of thermal and electrical conductivity.Recently, silver intermetallic compounds are formed in electronic applications and used as a bonding layer in composite materials.
Some micro electromechanical sensors (MEMS)need high temperature operations.These hightemperature devices and numerous applications in jet engines, nuclear reactors, geothermal wells,automotive electronics, industrial robots, and space electronics require high-temperature connections to support these devices.Conventional methods for fabricating high temperature junctions require high processing temperatures and when cooled down to room temperature thermal expansion mismatch may occur[2].Thermal expansion mismatch and high stresses may occur in the joint after cooling[3,4].For this reason,joints are generally produced by methods like thin film deposition, etching, diffusion,etc.
The aim of this study is to examine Ag-In intermetallic alloy systems produced as joints that produced by different methods.Silver-indium intermetallic systems Ag3In, Ag2In and AgIn2were obtained by electric arc[2,5].The main purpose is to investigate the microhardness of Ag-In intermetallics,as well as the thermal properties and microstructure.Understanding these properties of these intermetallic phases under various conditions, makes it easier to predict the mechanical behavior of a joint[6].
2 Silver-indium phase diagrams
The phase diagram of Ag-In binary phase system and its intermetallic compounds are given in Reference 7.Three of the seven phases seen in the phase diagram are intermetallic.When the phase diagram is examined,it is seen that 22.1 wt% In is dissolved in Ag.The temperature of the eutectic reaction containing 97%In by weight is 144 ℃.As seen in the phase diagram in Reference 7, In and AgIn2intermetallic phases are seen in the region where In is over 68.1% by weight and the temperature is 144 ℃.When the temperature is increased from 144 to 166 ℃, the AgIn2intermetallic compound decomposes into the liquid phase.At the temperature of 166 ℃, AgIn2intermetallic compound transforms to liquid andγphase.Below 187 ℃, there is a narrowα’ phase gap around stoichiometric values of Ag3In.As the temperature gets close to 205 ℃, the mixture turns into liquid withγgrains.Also, previous studies support the presence of Ag2In intermetallic compound in 32.4 wt%-34.9 wt% In stoichiometric values[8,9].In the region with a temperature of 205℃ and composition of 47.4 wt%-92.1 wt% In there is a liquid phase withζ.Above 205 ℃, theζphase with a composition range of 34.4 wt%-47.6 wt% In decomposes into theγphase and liquid by a metathetic reaction.In addition, theβphase occurs in the region where the temperature is above 660 ℃ and 26.2 wt%-31.3 wt% In[3,4].
3 Experimental
3.1 Production of the samples
By using 99.99% pure silver and 99.98% pure indium elements, Ag-26 wt%In, Ag-34 wt%In and Ag-68.1 wt%In alloys were produced by adding In element to Ag element at various rates with a Edmund Bühler Mini Arc Metler MAM-1 type arc furnace which is operated with a tungsten electrode (up to 1 cm in diameter) under reduced argon pressure (700-800 Mbar).The argon atmosphere in the sample chamber is essential to produce high quality samples.The use of high purity argon is also a prerequisite, as most arcmelting metals react acutely with oxygen (high lattice energy of oxides)[10].This arc furnace can reach up to 3 500 ℃ and melt the sample in the range of 5-20 grams.As seen in Fig.1, the samples were produced in the slots in the copper crucible in the vacuum arc melting furnace with dimensions of approximately 8 mm ×3 mm.In order to have homogeneous samples, the melting process is repeatedseveral times by turning the material over each time[11].

Fig.1 A schematic illustration of copper crucible in the vacuum arc melting furnace and the sample
3.2 Microstructure
Before microstructural processes, samples are embedded in transparent thermoplastic resin, to make it easy to use.Grinding and polishing were carried out on a Struers TegraPol-15 automatic polishing machine.Before each polishing step, samples were carefully cleaned with ethanol and dried.After polishing,samples were etched with 20 mL hydrogen chloride,4 gr picric acid, 400 mL ethanol solution for 5-10 s at room temperature[12,13].Microstructure photographs of the intermetallic compounds were determined with an optical microscope and chemical analysis of the phases were analyzed with Energy Dispersive X-Ray Analysis(EDX).
3.3 Thermal properties
Differential Scanning Calorimetry (DSC) analysis method was used to determine the thermal properties of the samples in the temperature range from 0 K to 300 K at a heating rate of 10 K/min under a constant nitrogen flow at atmospheric pressure.Indium was used as the reference material to determine the specific heat exchange.The size of the signal used to calculate the specific heat change is proportional to the heating rate.Therefore, if the heating rate is too high, the temperature gradients in the sample will be large,which can cause further errors in the measurements.So, the heating rate in this study, was determined as 10 K/min.
Specific heat is defined as the transfer of heat energy between a system and its surroundings under constant pressure and is expressed as;
Enthalpy is the heat energy absorbed or released by the system.The variation of enthalpy with temperature is obtained from the variation of specific heat with temperature.Enthalpy can be measured by integrating Eq.(1) with respect to any reference level when defined asH=0 at 298 K.
The enthalpy exchange when solid turns into liquid is called heat fusion.The system absorbs or releases heat without pressure change in the substance.The change in enthalpy with specific heat at constant pressure can be given as:
where ΔCPis specific heat change value, andTMis melting temperature.DSC curves of the samples were obtained by heating them to 300 ℃ at a rate of 10 ℃/min under nitrogen atmosphere.From these DSC curves, enthalpy, specific heat, onset, end, and peak temperatures of intermetallic compounds were determined.
3.4 Microhardness measurements
The microhardness values of the obtained alloys were measured by applying a 25 g load for 10 seconds to the samples with the Vickers hardness measurement method by using Future-Tech FM-700 model device.In order to increase statistical reliability, at least 10 measurements were taken on each section and their averages were calculated and used.
4 Results and discussion
4.1 Microstructures of intermetallic compounds
Fig.2 shows the optical microscope images taken to examine the microstructures of each alloy system and EDX spectrometer graphics used to determine the elemental composition analysis.
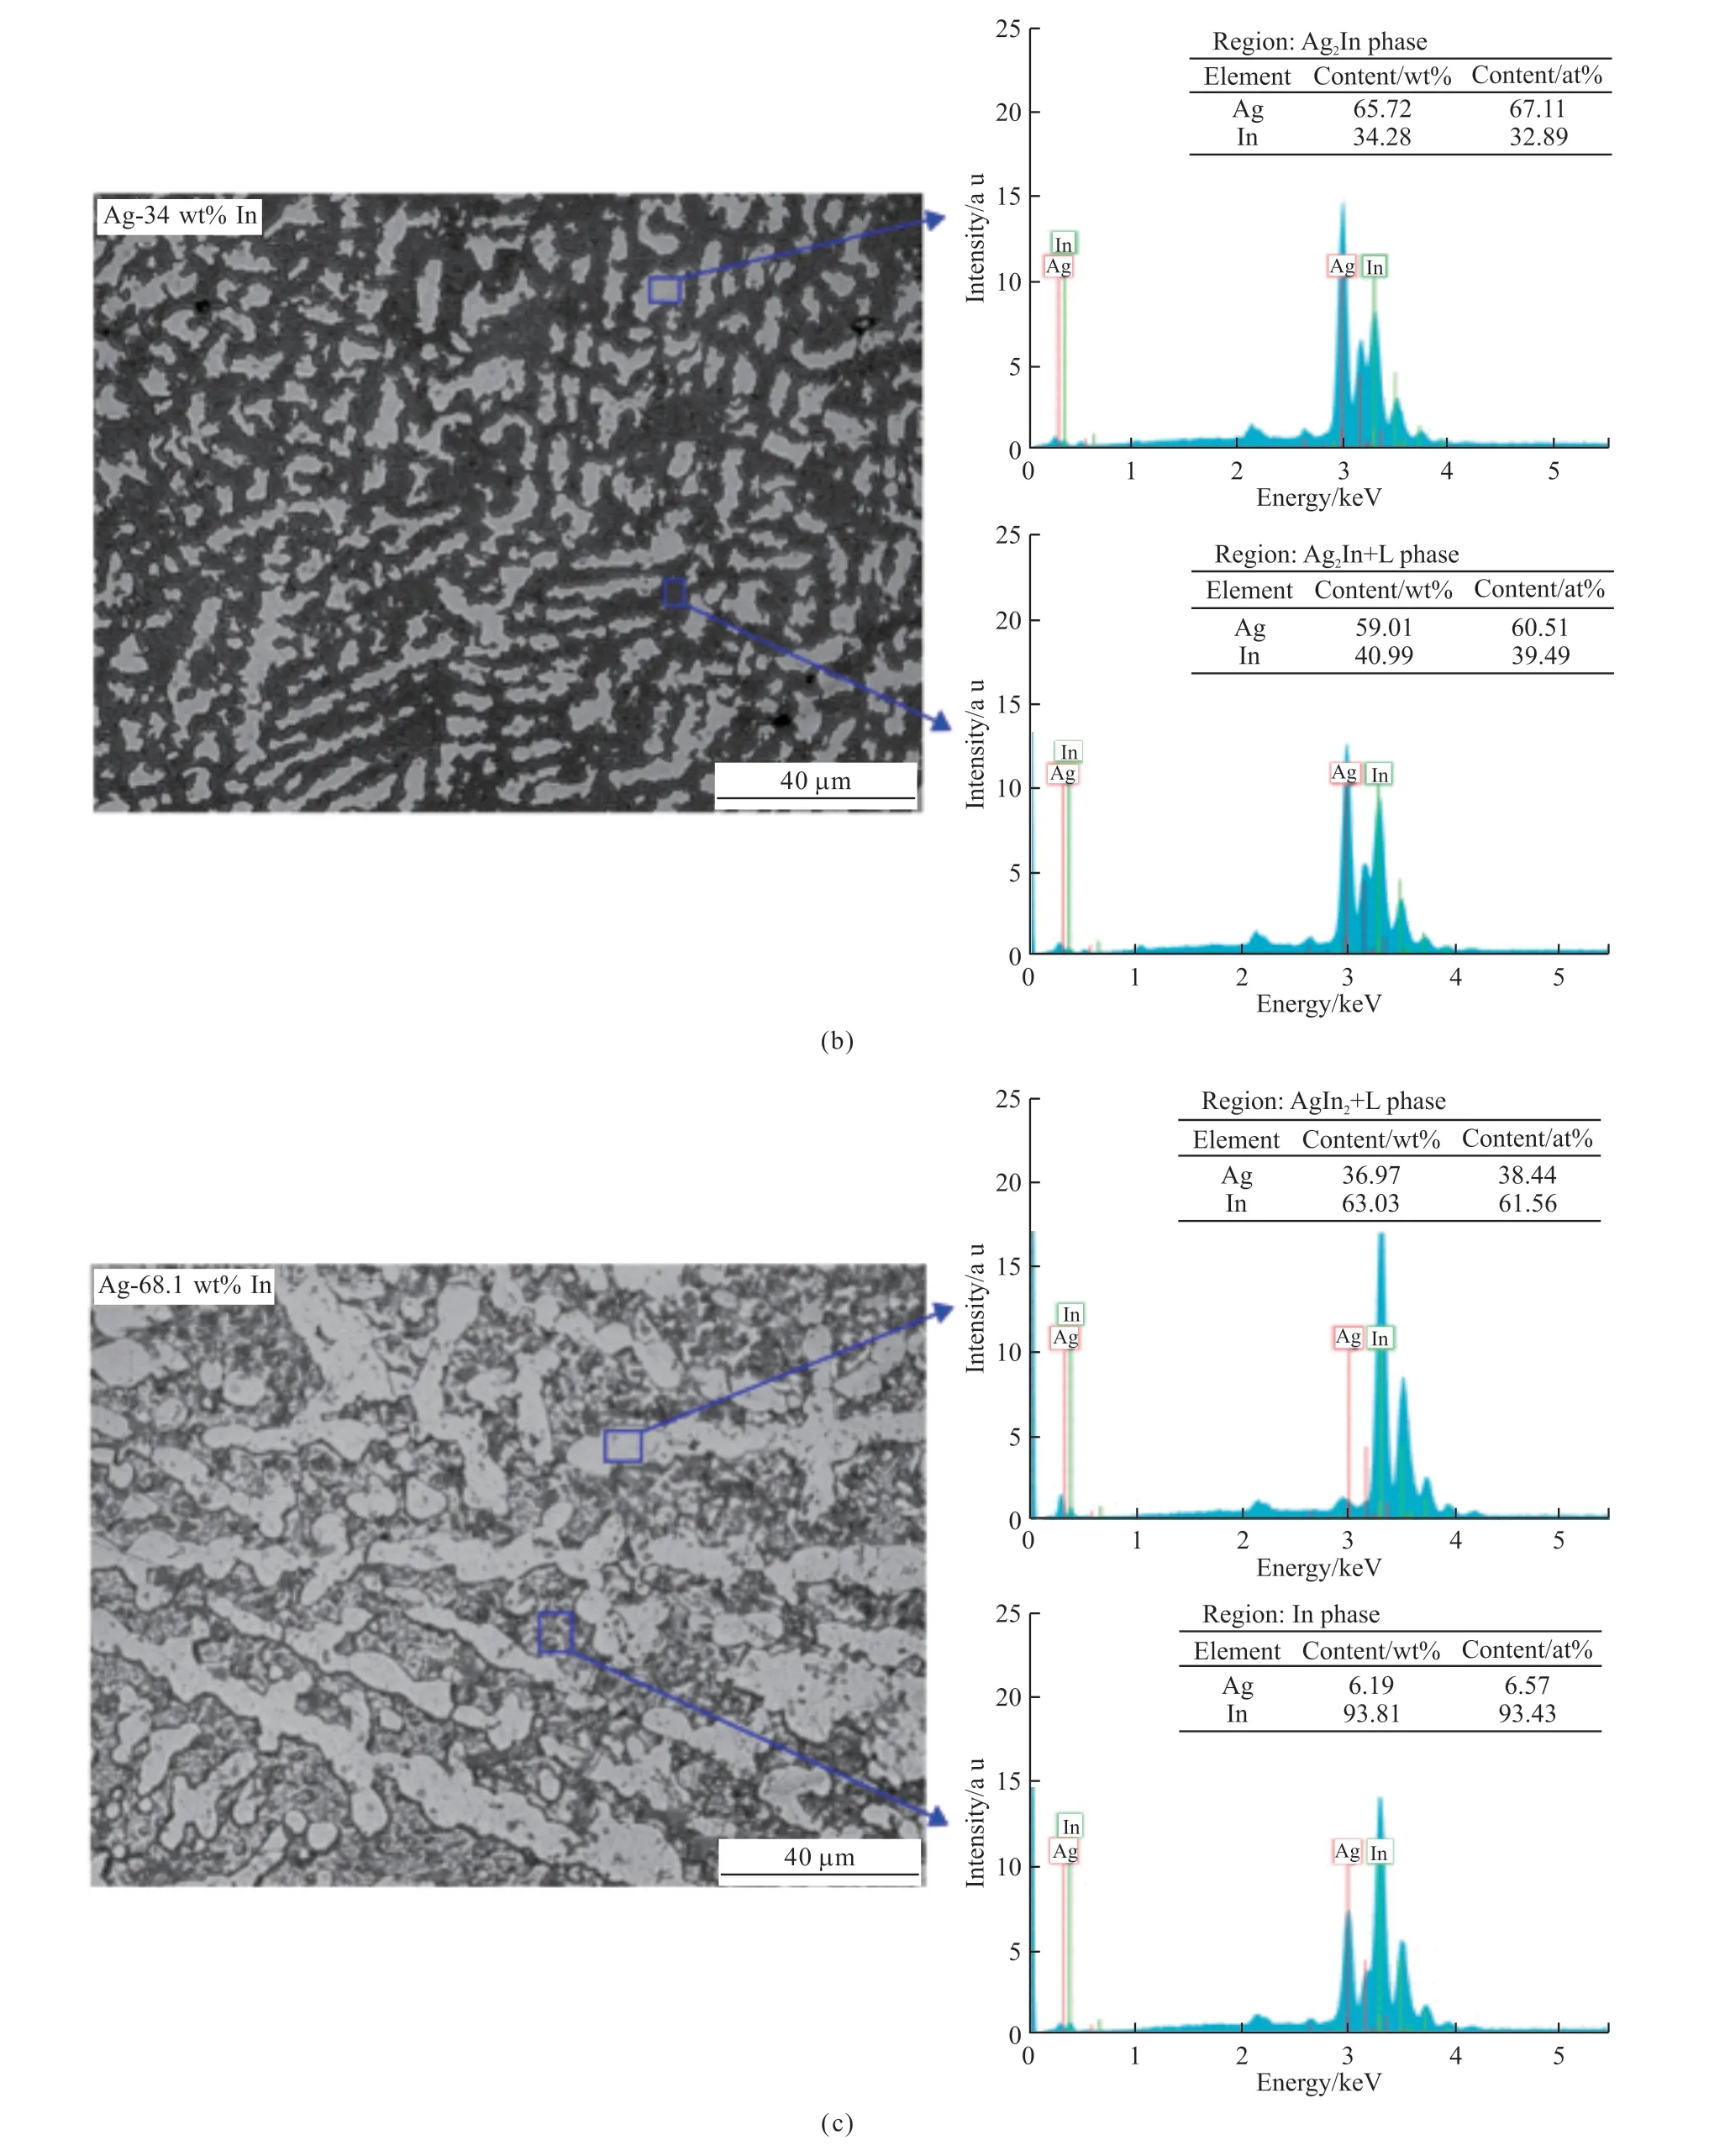
Fig.2 Optic microscope photographs and EDX composition analysis of (a) Ag-26 wt% In; (b) Ag-34 wt% In; (c) Ag-68.1 wt% In alloy systems
Two phases were obtained ((Ag3In+ζ) and(Ag2In+L)) in Ag-26 wt% In alloy system.In the phase diagram, the range where the indium ratio is 32.5 wt%-35 wt% is named as Ag2In intermetallic compound and the part where it is 26 wt% is named as Ag3In intermetallic compound.As seen in Fig.2(a), dark gray phase (Ag3In+ζ) is homogeneously distrubuted over the light gray phase (Ag2In+L).Ag2In intermetallic compound was obtained with the phase (Ag2In+L) in Ag-34 wt% In alloy system.In Ag-68.1 wt% In alloy system, light gray (Ag2In+L) phase and dark colored solid phase rich in indium content were observed.

4.2 Enthalpy and heat exchange of intermetallic compounds
The reaction temperatures of the materials are usually determined from the heating curves.Peaks indicate endothermic reactions that may be associated with heat absorption during melting.Tonset, is the starting point of the endothermic peak, that is theinitial temperature of the reaction whileTendis the final temperature of the endothermic peak.After heating,theTonsetis called the solidification temperature of the alloys andTendpoint is called the liquidus temperature of the alloys[14].The heating curves of Ag-26 wt% In,Ag-34 wt% In and Ag- 68.1 wt% In alloys are shown in Fig.3 and the values obtained from the graphs are given in Table 1.

Table 1 Onset temperature, peak temperature, end temperature, enthalpy and specific heat values for the Ag-In intermetallic compounds

Fig.3 DSC thermogram of intermetallic alloy systems at heating rate of 10 ℃/min
For Ag-26 wt% In intermetallic compound,the initial melting temperature (Tonset) occuring during heating started from 444.74 K and the highest temperature was measured as 457.10 K.When the EDX and DSC analysis results were evaluated together,it was concluded from the phase diagram that this peak would belong to the (Ag2In+L) phase.The initial melting temperature of Ag-34 wt% In intermetallic compound was found as 442.82 K, and the highest temperature was found as 445.22 K.It was stated that the Ag2In phase was found in the region where the indium ratio was between 32.4 wt%-34.9 wt%[8,9].It was determined that the phase with 445.22 K melting peak containes 41 wt% In ratio (Ag2In+L).In addition,the initial melting temperature of Ag-68.1 wt% In intermetallic was found as 444.52 K, and the highest temperature was found as 446.03 K.From DSC results of Ag-In intermetallic compounds, it was seen that the(Ag2In+L) phase showed a melting peak in the range of 445.22- 457.10 K.However, the transition temperature and pasty region width of the alloys decrease with the increase of the indium ratio[15].Here another significant issue is the heat fusion of intermetallic compounds.Ag-34 wt% In alloy system with an enthalpy value of 0.57 J/g, has the optimum energy saving results.The specific heat values calculated from the DSC peaks of the alloys were given in Table 1.According to the results, the intermetallic compound with the lowest energy storage capacity is Ag-34 wt% In alloy system with a value 0.003 3 J/g ℃.
4.3 Microhardness tests of intermetallic compounds
In literature, there is insufficient information in terms of many mechanical properties of Ag-In intermetallic compounds such as elastic modules,Poisson’s ratio, tensile strength, elongation, hardness,thermal conductivity coefficient, and fatigue strength[3].In the present study, microhardness values of the systems were determined, and the results were given in Table 2.Measurements were made at 10 different points of each alloy system under a load of 25 g for 10 s.Ag-26 wt% In, Ag-34 wt% In and Ag-68.1 wt%In intermetallic alloy systems’ microhardness valueswere calculated as 143.45, 108.08 and 32.6 HV respectively and shown in Fig.4.When the hardness of the intermetallic compounds was compared with the microhardness of pure silver with a value of 94.6 kg/mm2[16], it was determined that the compounds had high hardness value.The increase of In content, which has high ductility and low hardness value, significantly lowered the microhardness.However, since intermetallics are generally hard and fragile, alloys exhibit strength enhancing properties.That is, Ag-In intermetallic compounds used as joint connections in electronics are effective in increasing the hardness and strength of the joint.

Table 2 Microhardness values of the Ag-In intermetallic compounds
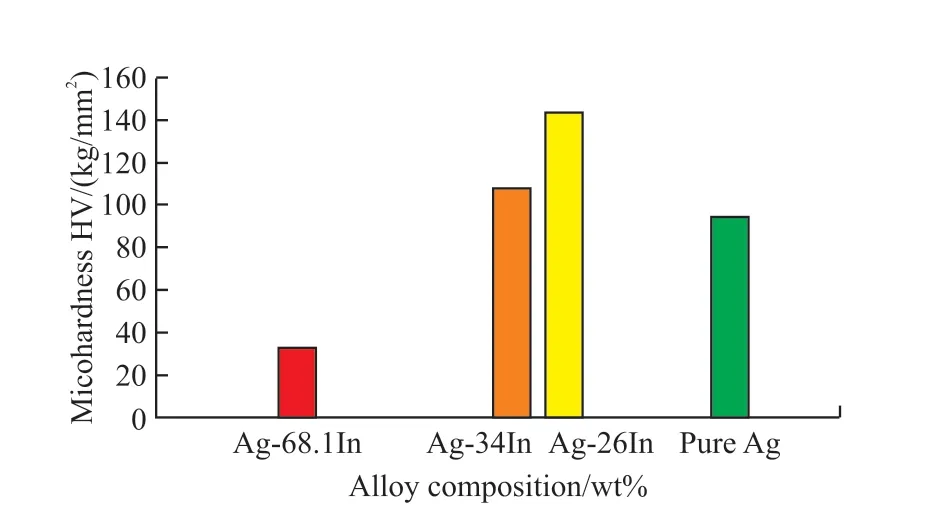
Fig.4 Hardness values for pure Ag and Ag-26 wt% In, Ag-34 wt%In and Ag-68.1 wt% In intermetallic alloys
5 Conclusions
a) The alloy with the optinum properties in term of enthalpy and specific heat was Ag-34 wt% In intermetallic compound.However due to the lowest transition temperature of Ag-68.1 wt% In intermetallic compound, the width of pasty region was the narrowest.
b) The hardness decreased with the increase of In content.The hardness values of the intermetallic compounds were higher compared to pure silver.
Conflict of interest
All authors declare that there are no competing interests.
 Journal of Wuhan University of Technology(Materials Science Edition)2024年1期
- Journal of Wuhan University of Technology(Materials Science Edition)的其它文章
- One-pot Synthesis of Hierarchical Flower-like WS2 Microspheres as Anode Materials for Lithium-ion Batteries
- Controllable Synthesis of Au NRs and Its Flexible SERS Optical Fiber Probe with High Sensitivity
- Effciient Direct Decomposition of NO over La0.8A0.2NiO3(A=K, Ba, Y) Catalysts under Microwave Irradiation
- Appreciable Enhancement of Photocatalytic Performance for N-doped SrMoO4via the Vapor-thermal Method
- Infulence of Current Density on the Photocatalytic Activity of Nd:TiO2Coatings
- The Negative Thermal Expansion Property of NdMnO3 Based on Pores Effect and Phase Transition