
Evolution of Biofilm and Its Effect on Microstructure of Mortar Surfaces in Simulated Seawater
2024-04-10 10:38RONGHuiYUChenglongZHANGYing
RONG Hui, YU Chenglong, ZHANG Ying*
(1.School of Materials Science and Engineering, Tianjin Chengjian University, Tianjin 300384, China; 2.Tianjin Key Laboratory of Building Green Functional Materials, Tianjin Chengjian University, Tianjin 300384, China)
Abstract: To explore the role of biofilm formation on the corrosion of marine concrete structures, we investigated the attachment of biofilm on mortar surfaces in simulated seawater and the influence of biofilm on the microstructure of mortar surfaces.The results show that the evolution of biofilm on mortar surfaces in simulated seawater is closely related to the corrosion suffered by the mortar, and the process of biofilm attachment and shedding is continuous and cyclical.It is found that the specimens in the absence of biofilm attachment are more severely eroded internally by the corrosive medium in simulated seawater than those in the presence of biofilm attachment.For the specimens without biofilm attachment, after 60 days, gypsum forms,and after 120 days, the number of pores in the mortar is reduced.In contrast, for the specimens in the presence of biofilm attachment, gypsum could only be detected after 90 days, and fewer pores are filled.Therefore, the formation of biofilm could delay the invasion of the corrosive medium into the interior of mortar during the evolution of biofilm on mortar surfaces, mitigating the corrosion of mortars in seawater.
Key words: biofilm attachment; mortar; sulfur-oxidizing bacteria; gypsum; simulated seawater;microstructure
1 Introduction
In 1945, Parker[1], for the first time, found that the corrosion of some concretes was caused by the metabolic process of microorganisms in which sulfuric acid was produced, and it could be classified as biochemical corrosion.In 1959, Pomeroy investigated the microbial corrosion of sewage pipeline used for 35 years in the urban area of Los Angeles, California, US,and found that 7.5 km of the pipeline was subjected to microbial corrosion[2].Since then, experts around the world have paid more attention to microbial corrosion.In Germany, 10%-20% of building materials suffered from microbial corrosion damage, and the cost of repairing the damaged sewage system of the city of Hamburg alone amounted to DM 50 million in the 1970s[3].In the United States, until 1994, the economic cost of sewage pipe corrosion was estimated to be around US$ 14 billion per year[4], and until 1996,10.9% of the 1 900 km of concrete sewage pipes had been subjected to microbial corrosion, and their maintenance cost was as high as US$ 400 million per year[5].This shows that microbial corrosion of concrete is a common problem in civil engineering, especially in the sewage treatment system and marine engineering,where it is rich in microorganisms.
Microbial corrosion of concrete (MICC) refers to the corrosion of concrete caused by microorganisms through metabolism.It is a gradual and multi-stage deterioration process in which microorganisms first gather on the concrete surface to form a biofilm with many pores, and then sulfuric acid is produced through the metabolic process of microorganisms[6-8].Compared with chemical sulfuric acid, the biogenerated sulfuric acid makes concretes corrode more severely[9-11],causing surface damage and loosening, slurry loss,aggregate exposure, cracking and reinforcement corrosion, and reducing the service life of concrete structures from the expected 100 years to 30-50 years,and even to 10 years or fewer in extreme cases[12,13].
There are many kinds of microorganisms in nature, and those related to the microbial corrosion of concrete mainly include bacteria, archaea, fungi, and algae, among which the most corrosive microorganisms are bacteria, such as sulfate-reducing bacteria, sulfuroxidizing bacteria, iron-oxidizing bacteria, and nitratereducing bacteria[14].Microorganisms can produce acidic metabolites such as sulfuric acid, which interact with the calcium-rich phase of concrete to produce calcium-containing compounds such as gypsum and ettringite, leading to an increased expansion pressure within the concrete and ultimately causing deterioration[6].It has been found that the characteristics of the microbial cell adhesion and growth and the biofilm formation may be the key influencing factors in the corrosion of concrete by microorganisms[15,16].Biofilms are formed from microorganisms by secreting extracellular polymers (EPS), which are composed of proteins, polysaccharides, lipids, and nucleic acids[17,18].EPS not only enables the biofilm to attach to the material surface through hydrogen bonds, weak ion interactions, hydrophobic force, and van der Waals forces, but also provides a safe barrier for microbial growth inside the biofilm and facilitates the synergistic interactions among microorganisms[19,20].In addition,the microorganisms in the biofilm often affect the attached material directly or indirectly by changing the environmental parameters such as pH, redox potential,salinity, and oxygen concentration to achieve an optimum condition for their survival[19].
In recent years, more and more researchers have paid attention to the influence of biofilm attachment on concrete surfaces on the MICC process as well as the resultant performance of the concretes[21-24].Satohet al[18]found that H2S was oxidized to form corrosive compounds on the mortar surfaces in the upper and middle parts of the manhole.Furthermore,in the biofilm forming around the air-water interface,the amount of the corrosive compounds produced in the upper reticulated flocculent biofilm was reduced in the deeper gel-like biofilm, protecting the surfaces of the central manholes from erosion.Konget al[25]prepared artificially enhanced sewage with a chemical oxygen demand (COD) of 7 000 mg/L and found that the amount of calcium hydroxide (Ca(OH)2) was much higher in the specimens with biofilm attachment than that in the specimens without biofilm attachment, and the mass-loss rate and the porosity of the specimens without biofilm attachment were higher than those with biofilm attachment, showing that the biofilm played a protective role for the mortar in the sewage environment.Concerning the biofilm forming on marine concrete structures, Gaoet al[26]found that the bioactive film was more resistant to chloride penetration than the inactive biofilm and that the biofilm in the lower region exhibited better adhesion to the concrete compared to that in the upper region of the concrete in intertidal zones.It shows that biofilm can also provide some protection for marine concrete structures from harmful substances.
At present, with the fast development of marine engineering around the world, many marine structures are subjected to microbial corrosion, which has caused huge economic losses and safety hazards to bridges,ports and oil platforms,etc.It is estimated that there are more than 10 000 different types of microorganisms in a single seawater sample, and the nutrients and the electron donors and acceptors in seawater can facilitate biofilm attachment on the surfaces of structures[27].If the evolution of biofilm attachment on mortar/concrete surfaces in the marine environment and its influence on the microstructures of the attached surfaces can be studied, the growth pattern of the biofilm and its effect on the hydration products can be well understood,which can provide a basis for future investigation on the microbial corrosion resistance of marine concretes.
In this manuscript, the simulated seawater containing sulfur-oxidizing bacteria (SOB, main species of biofilm-forming bacteria in seawater) was used to study the evolution of biofilm attached to mortar surfaces in the marine environment.The growth of the bacteria population in the biofilm and the composition,macro morphology, and microstructure of the biofilm was characterized to investigate the evolution.The mass change of the specimen and the composition and microstructure of the hydration products of the biofilmattached surfaces were analyzed to understand the influence of the evolution of biofilm on the properties of the mortar.
2 Experimental
2.1 Materials
In this study, ordinary Portland cement (P.O 42.5),river sand with a fineness modulus of 2.8, tap water,and naphthalene-based high-range water-reducing admixture with a water reduction rate of 25% were used.The water/cement (w/c) ratio was 0.33.The mixing proportion of the mortar specimens is shown in Table 1.The formula to prepare the simulated seawater was adopted from Ref.[28] which was proposed after examining the basic composition of seawater in Tanggu, Tianjin, China.The simulated seawater was prepared by dissolving the chemicals shown in Table 2 with tap water.The sulfur-oxidizing bacteria(Thiobacillus thioparus DSM505) obtained from the American type culture collection (ATCC) was adopted.

Table 1 Mixing proportion of mortar specimens/kg

Table 2 Composition of simulated seawater/g
2.2 Methods
2.2.1 Preparation of mortar specimens
The ingredients were mixed by a one-shot method.The cement and the sand were firstly mixed and stirred in an automatic mixer for 30 s, and secondly, the water and the water-reducing admixture were added and stirred for 3 min.Thirdly the fresh mortars were cast into the molds with a size of 40 mm× 40 mm × 160 mm and compacted by vibration.After that, the specimens were covered with plastic films to prevent the evaporation of water.Finally, after 24 h, the specimens were taken out from the molds and cured (20± 2 ℃, relative humidity ≥95%).
The bacterial that has been cultured for 4 days was mixed with the sterilized simulated seawater at the volume ratio of 2% and incubated for 4 days at the speed of 150 rpm at 30 ℃ to obtain a bacterial population of 3×10⁸cells/mL.The test mortar specimens (T) were half-immersed in this simulated seawater with bacteria and settled for 120 days at room temperature.In the control group (C), mortar specimens were half-immersed in the sterilized simulated seawater without bacteria.In previous studies to keep the concentration of bacteria stable atn×108cells/mL(1≤n<10), the simulated seawater was replaced with the fresh simulated seawater every 12 days, and samples were collected on Day 7, 15, 30, 45, 60, 75,90, and 120.The diagram of the test set-up is shown in Fig.1.

Fig.1 Diagram of the test set-up
2.2.2 Counts of bacteria in biofilm
On sample collection days, the specimens were taken out from the simulated seawater, and the biofilms on the surfaces of the mortar specimens were rinsed three times using phosphate buffer to remove necrotic bacteria.Then the specimens were immersed in methanol for 15 min to fix the biofilm and gently rinsed with running water for 2 min.After that, the specimens were immersed in 1‰ crystalline violet staining solution for 15 min, and the dyed specimens were finally immersed in anhydrous ethanol for 15 min to elute the crystalline violet.Finally, the amount of the bacteria in the biofilm was characterized by the concentration of the eluted crystalline violet which was determined by measuring the OD590value (OD590is the optical density at 590 nm).
2.2.3 Analysis of polysaccharides and proteins in biofilm
Biofilm sample from the gas-liquid interface of the mortar was scraped and 2 g of it was added into a Petri dish.The contents of the polysaccharides and the extracellular proteins in the biofilm were determined by the phenol sulfuric acid method[29]and the Coomassie Brilliant Blue staining method[30].
2.2.4 Characterization of morphology and element analysis of biofilm
A biofilm sample was collected from the mortar surface around the gas-liquid interface and fixed in a 2.5% glutaraldehyde solution at 4 ℃ for 2 h.Then it was rinsed three times with 0.2 mol/L phosphate buffer and dehydrated with ethanol solutions with the volume concentrations of 50%, 60%, 70%, 80%, 90%, and 100% in sequence for 15 min for each concentration.The dehydrated sample was dried in an oven at 30℃.Finally, the sample was coated with gold, and the morphology of the biofilm was characterized by a scanning electron microscope (SEM, JSM-7800F,Jeol).The energy-dispersive X-ray spectroscopy (EDS)was used to determine the elemental composition of the biofilm.
2.2.5 Calculation of mortar’s mass change
When the mass of a mortar specimen isM1before being immersed in simulated seawater, andM2after being immersed for a certain time (7, 15, 30, 45, 60,75, 90, and 120 days), the rate of mass change,R, can be defined as the ratio of the mass difference,M2-M1, to the original massM1as shown in Eq.(1).
2.2.6 Analysis of mineral composition and morphology of mortar
X-ray diffractometer (XRD, Ultima-V1, Rigaku)was used for mineral composition analysis with a start angle of 10°, an end angle of 60°, a scan step of 0.02°,and a scan speed of 8 °/min.A digital camera was used to obtain the macroscopic morphology while SEM was used to obtain the microscopic morphology of the mortar surfaces with corrosion products.EDS was employed to determine the elemental composition.2.2.7 Electrochemical analysis
The properties of the biofilm and the changes in porosity of the mortar were studied via an electrochemical method[31-33].The experiments were conducted with an electrochemical workstation(CHI760E, Chenhua).A sample with the dimension of 1 cm × 1 cm × 2 cm was cut from the mortar surface with biofilm attached, and the completeness of the biofilm was maintained.The sample was sandwiched between two electrode plates, and full contact between the sample and the electrodes was ensured.After the test, the biofilm was removed from the surface of the sample, and the same test was conducted at the voltage of 10 mV (AC) and the frequency of 0.1-1 MHz.The electrolyte was sodium sulfate solution with a concentration of 3 500 mg/L.And Zsimpwin software was used to analyze the electrochemical impedance spectroscopy (EIS) data.
3 Results and discussion
3.1 Evolution of biofilm attachment on mortar surfaces
3.1.1 Macroscopic evolution of biofilm
The biofilm forming on mortar surfaces in the test group is highlighted with white lines in Fig.2.It can be seen that scattered biofilm begins to appear on mortar surfaces around the gas-liquid interface in the test group on Day 15.This is due to the aerobic properties of the SOB, which preferentially attach to the gasliquid interface.After Day 30, the biofilm becomes continuous around the gas-liquid interface in the test group, and it spreads downward along the mortar surface into the simulated seawater.Because there are enough nutrients and oxygen in the simulated seawater between Day 15 and Day 30, the adhesion force and the attachment area between the biofilm and the mortar surface increase as the microorganisms continuously secrete EPS.The dissolved oxygen is transferred in porous biofilms during this period, facilitating the microorganisms to reproduce and spread downward along the mortar surface.

Fig.2 Evolution of biofilm attachment on mortar surfaces
After 75 days, the biofilm covers almost the entire semi-submerged zone of the mortar, while the attachment area of the biofilm is smaller on Day 90.From Day 30 to Day 75, the EPS secreted by the microorganisms makes the biofilm continuously grow and become thicker, and it becomes difficult for the nutrients and oxygen in the simulated seawater to reach deep into the biofilm after Day 75[34].As a result, the microorganisms in the deep area of the biofilm cannot secret EPS any longer, the attachment of the biofilm to the mortar surface begins to weaken, and some of the biofilm drops off, resulting in a smaller attachment area on Day 90.
On Day 120, the attachment area of the biofilm on the mortar surface below the gas-liquid interface becomes large again.During the period between Day 90 and Day 120, the nutrients and the dissolved oxygen in the simulated seawater can go into the biofilm again and promote the microorganisms to grow and reproduce, leading to the attachment of new biofilm.In contrast, no visible biofilm appears on the surface of the control specimens between Day 7 and Day 120.
3.1.2 Microbial colonization in biofilm
The amount of the bacteria in the biofilm was evaluated by measuring the OD590values from Day 30.As shown in Fig.3, the OD590value increases rapidly between Day 30 and Day 60, from 1.79 to 3.82.This indicates that the biofilm enters a stage of rapid growth after Day 30.The growth slows down after Day 60, and the OD590value reaches the maximum of 4.02 on Day 75 before it decreases to 2.10 on Day 90.This indicates that the biofilm gradually matures after 60 days and enters a stage of growth stabilization.During the period of Day 75 to Day 90, the total amount of the biofilm dissolved in the ethanol solution is low since most of the biofilm drops off, and as a result, the count of the bacteria in the biofilm is low, which can be regarded as the shedding period of the biofilm.The OD590value rises again after Day 90 and reaches 2.80 on Day 120 as the new biofilm reattaches to the mortar surface and the attachment area increases.The count of the bacteria in the biofilm begins to increase, and the biofilm starts its second round of growth.

Fig.3 OD590 values showing the changes in the count of bacteria in the biofilm
Although the biofilm attached to the mortar surfaces in simulated seawater provides a relatively safe and stable ecological environment for the reproduction of bacteria within the biofilm, it is influenced by the accessibility of nutrients and oxygen and some other factors.Generally, the evolution of biofilm is a dynamic process that changes over time, which includes four main stages: initial attachment, rapid growth, growth stabilization, and shedding.
3.1.3 Mass change of polysaccharides and proteins in biofilm
Fig.4 shows the contents of the polysaccharides and the proteins in the biofilm of the test group.It can be found that the trend of the mass change of the polysaccharides and the proteins are the same.Both the contents of the polysaccharides and the proteins increase from Day 30 to Day 75 with an increase rate of 45.3% and 244.2%, respectively.From Day 30 to Day 75, the initial attachment of the biofilm is completed,and the bacteria in the simulated seawater propagate rapidly while secreting EPS continuously.The biofilm spreads downward from the gas-liquid interface to the zone below the interface, leading to an increase in the content of the polysaccharides and the proteins in the biofilm.From Day 75 to Day 90, the contents of the polysaccharides and the proteins decrease from the peak values of 7.28 and 1.79 mg/g on Day 75 to 6.82 and 1.54 mg/g on Day 90, respectively, after which period, the contents slightly increase again.

Fig.4 Contents of polysaccharides and proteins in the biofilm of the test group
3.1.4 Microscopic morphology and composition of biofilm
Fig.5 shows that the interior of the biofilm attached to the mortar surface is loose and porous,which facilitates the transport of nutrients and oxygen.The presence of closely packed cells of the SOB within the biofilm indicates that the biofilm formation on the mortar surface is due to the action of the SOB(Fig.5(b)).

Fig.5 Morphology of biofilm (a) on mortar surface (Day 30); (b)SOB within the biofilm (SOB: sulfur-oxidizing bacteria)
As shown in Figs.6(a) and 6(d), the element of phosphorus (P) is already present on the mortar surface in the test group, but not on the mortar surface in the control group on Day 30.This is because a large amount of biofilm is already attached to the mortar surface in the test group on Day 30 and the biofilm contains lipids, of which phosphorus is an element component[35].As for the control group, there is little biofilm attached to the surface on Day 30, so the element of phosphorus cannot be detected.This further suggests that the phosphorus that appeared in the test group is within the biofilm but not in the simulated seawater.
As shown in Figs.6(a-c), the content of phosphorus increases from 5.93% on Day 30 to 10.60% on Day 60, which is almost doubled during this period, whereas the content on Day 120 only increases by 2.37% compared with Day 60, indicating a rapid growth of biofilm in the period of Day 30 to Day 60.It can also be seen from Figs.2 and 3 that the bacteria reproduces rapidly in this period, and the biofilm attached to the mortar surface expands to a large area.However, the biofilm does not continuously grow after Day 60.Instead, part of the biofilm drops off after Day 75, and new biofilm grows and reattaches to the surface after Day 90.Thus, the difference in the content of phosphorus is remarkable between Day 30 and Day 60, while it is not that significant between Day 60 and Day 120.Fig.6(f) shows that phosphorus appears on the mortar surface with an element content of 5.27%in the control group on Day 120.This may be due to the contamination of the specimen in the control group as the test setup is not tightly closed and the SOB in the test group might propagate to the specimen in the control group.

Fig.6 EDS analysis of biofilm on mortar surface at Day 30 (a, d), Day 60 (b, e), and Day 120 (c, f); (a-c) Element content within the biofilm on the mortar surface in the test group; (d-f) element content of the mortar surface in the control group
3.1.5 Rate of mass change of mortar
It can be found from Fig.7 that the rate of mass change of the mortar specimen in the test group begins to increase rapidly after Day 15.This trend continues until Day 60.During this period, the biofilm is at the rapid growth stage with a large amount of biofilm attached to mortar surfaces, and the biofilm contains 95%-99% of water[15].Thus, the increase in the mass of mortar is on the one hand, to the generation of corrosion products which fill the internal pores of mortar.On the other hand, it is due to the accumulation of water within the biofilm.The rate of mass change of mortar gradually decreases after Day 60 and it reaches 0.78% on Day 90.This is because a large amount of the biofilm drops off during this period.The rate of mass change increases again after Day 90 and reaches 0.94%on Day 120, during which time new biofilm begins to attach to the mortar surface.

Fig.7 Rate of mass change of mortar specimens
The rate of mass change in the control group tends to increase gradually throughout the test period,although it is much lower than that in the test group at the same age.And the rate of mass change on Day 120 is 0.37%.As shown in Fig.2, biofilm can only be observed on Day 120 in the control group.However,the mass of the specimen continues to increase during the aging period.Thus, it can be deduced that the corrosive medium in the simulated seawater enters the interior of the mortar and continuously generates new hydration products to fill the pores, leading to an increase in the mass of mortar specimens in the control group.
3.2 Microscopic properties of mortar
3.2.1 Internal structure of mortar
To investigate the effect of the biofilm on the permeability of the mortar surface to sulfate ions in the simulated seawater and the internal structure of mortar, tests were conducted on Day 30 and Day 120 which corresponds to the ages that the biofilm grows rapidly and almost finishes its spreading on the surface,respectively.The equivalent circuit model as in Refs.[31-33],RS(Q1(Rct1W1))(Q2(Rct2W2)), were employed,and the software Zsimpwin was used to compare the fitted curves and the experimental curves in the test group with biofilm and the control group without biofilm attached on the mortar surface on Day 30.It can be seen from Fig.8 that for both groups, the fitted curves agree well with the experimental curves,indicating that the equivalent circuit model is suitable for studying the permeation and diffusion of sulfate ions in mortars with and without biofilms.

Fig.8 Zsimpwin fit for mortar specimens at Day 30: (a) Control group, (b) test group (Zr is the real part of the impedance and Zi is the imaginary part of the impedance)
Fig.9 shows the Nyquist curves for mortars with and without biofilms (the biofilm was removed) in the test group on Day 30 and Day 120.As shown in Fig.9,the radii of the curves for the specimens with biofilms are smaller than those without biofilms at the same age, which means the resistance of the mortar with biofilms is smaller.During the test, the sulfate ions in the electrolyte solution, each carrying two negative charges, passes through the biofilm and generates an electric current when the charges move directionally under the electric field.Besides, there is a large amount of water inside the biofilm, which can enhance its electric conductivity and thus reduces the resistance of mortar[31,36-38].The radii of the Nyquist curves on Day 120 are larger than those on Day 30 for both the specimens with and without biofilms.When immersed in the simulated seawater, the corrosive medium enters the interior of the mortar through the biofilm,generating solid products which fills the internal pores.Therefore, it is difficult for the sulfate ions to migrate at the solid-liquid interface, thus resulting in higher resistance on Day 120.

Fig.9 Nyquist curves for mortar specimens of the test group on Day 30 and Day 120 (Y: specimens with biofilm in the test group;Q: specimens after removal of the biofilm in the test group)
Fig.10 shows the Nyquist curves of the mortar specimens after the biofilms were removed in the test group and the control group on Day 30 and Day 120.It can be seen that the Nyquist radius in the control group is greater on Day 120 than that on Day 30.This indicates that the corrosive medium also enters the mortar and fills the interior pores with the reaction products in the control group, resulting in a reduction of the number of pores and thus a larger resistance on Day 120.It can also be observed that although the radii of the Nyquist curves of the specimens in the test group also increase with time, the radii of the Nyquist curves in the control group are larger than those in the test group at the same age, which indicates that more corrosive medium enters the mortar in the control group when immersed in the simulated seawater.With more internal pores being filled, the mortars in the control group have larger impedance than those in the test group.

Fig.10 Nyquist curves of mortar specimens after biofilms were removed in the test group and the control group on Day 30 and Day 120 (D: specimens in the control group)
Generally, the specimens in both the test and the control groups are subjected to the influence of the corrosive medium in the simulated seawater, which results in the generation of pore fillers.This finding is consistent with the assumed cause of the trend in the rate of mass change in Fig.7.Although sulfate ions can enter the mortar specimen through the biofilm attached to the mortar surface, the number of sulfate ions that enter and react inside the mortar is small.Therefore,the biofilm has a hindering effect on the penetration of the sulfate ions in the simulated seawater.
3.2.2 Morphology of hydration products
As shown in Fig.11, plate-like crystals are present in the specimens in both the test and the control groups.And it is found that the EDS result of the plate-like crystals shows the presence of elements S, Ca, and O.Considering together with the XRD results, the platelike crystals could be identified as gypsum.
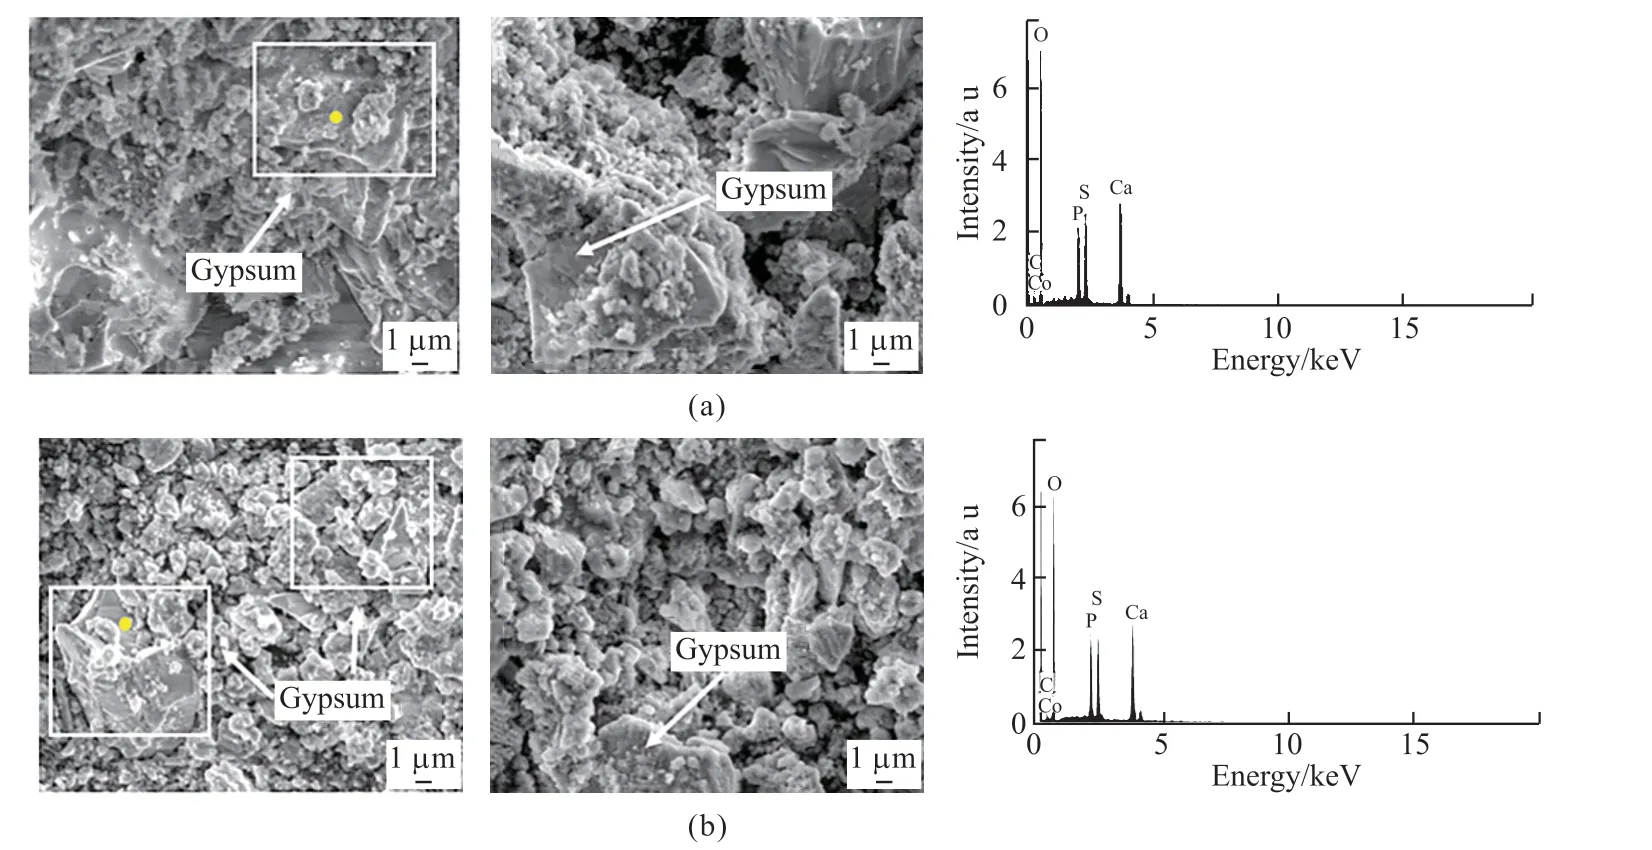
Fig.11 SEM-EDS analysis results of hydration products in mortar: (a) Test group; (b) control group
The formation of gypsum depends on the concentration of sulfate ions[39,40], mainly caused by the chemical sulfate ions in simulated seawater and the sulfate ions converted by SOB within the biofilm through metabolism, which eventually enter the mortar and react with its internal calcium phases such as calcium hydroxide to produce the corrosion product gypsum[41].The expansion coefficient of gypsum is high, and will generally make the specimen expand by 1.2 to 2.2 times, causing expansion stresses within the mortar and leading to the deterioration of mortar properties[9,42].
In summary, the large amount of gypsum generated inside the specimens without biofilm attached to the surface in the simulated seawater poses a potential hazard to the durability of mortar, while the specimens with biofilm have less gypsum inside, which has a mitigating effect on the deterioration of mortar durability.
3.2.3 Composition of hydration products
From Fig.12, it is found that the diffraction peaks of calcium carbonate in the test group are higher than those in the control group, indicating a higher content of calcium carbonate in mortars in the test group.This is the result of the carbonization of the mortar surface due to the consumption of oxygen and the release of carbon dioxide during the evolution of biofilm on the mortar surface in the test group.Regarding the diffraction peaks of the expansive hydration product,gypsum, they are higher in the control group than in the test group.In the control group, the gypsum is detectable as early as Day 60 and the peak is significantly higher on Day 120 compared with Day 60.In the test group, the peak appears on Day 90, much later than in the control group, and it does not become higher with time.Before Day 75, the biofilm gradually matures and becomes denser and denser, playing the role of blocking the sulfate ions in the simulated seawater.When the biofilm starts to drop off after Day 75, the sulfate ions in the simulated seawater enters the mortar more easily and finally produces gypsum as observed on Day 90.

Fig.12 XRD spectrum of mortar specimens in simulated seawater at different ages: (a) Test group; (b) control group
It can be understood from the comparison between Figs.12(a) and 12(b) that the pore fillers generated are gypsum, and this can further explain the increase of resistance on Day 120 for both test and control groups as shown in Fig.10.Compared with the test group,the mortars in the control group are subjected to the corrosive medium in the simulated seawater earlier and more gypsum is generated.This suggests that the biofilm forming on mortar surfaces in the simulated seawater prevents most of the corrosive medium from entering the specimen during the evolution of its attachment, thus delaying the corrosion damage to the mortar.
4 Conclusions
The evolution of biofilm on mortar surfaces has been investigated.The biofilm is formed from the sulfur-oxidizing bacteria with sodium thiosulfate as the substrate.The amount of the bacteria in the biofilm is examined by the OD590value which increases from 1.79 on Day 30 to 4.02 on Day 75 in the simulated seawater when the polysaccharide and protein contents are increasing.Then the OD590value decreases to 2.10 on Day 90, and increases again, while the polysaccharide and protein contents also show the same trend.Combined with the morphological analysis of biofilm attachment on mortar surfaces, four stages of biofilm evolution on mortar surfaces in simulated seawater are identified.They are initial attachment period before Day 30, rapid growth period between Day 30 and Day 60, growth stabilization period between Day 60 and Day 75, and shedding period between Day 75 and Day 90.And the start of a second round of biofilm attachment is after Day 90.
It has been confirmed in this study that the biofilm attached to mortar surfaces could mitigate mortars from corrosion by the sulfate ions in seawater to some degree.The main corrosive product generated within mortar is gypsum which fills the pores, increases the mass of mortar, and causes expansion of the specimen.The dense biofilm on mortar surfaces could reduce the amount of the corrosive sulfate ions that enter the specimen, and effectively mitigate the corrosion damage of mortar in the marine environment.
Conflict of interest
All authors declare that there are no competing interests.
 Journal of Wuhan University of Technology(Materials Science Edition)2024年1期
- Journal of Wuhan University of Technology(Materials Science Edition)的其它文章
- One-pot Synthesis of Hierarchical Flower-like WS2 Microspheres as Anode Materials for Lithium-ion Batteries
- Controllable Synthesis of Au NRs and Its Flexible SERS Optical Fiber Probe with High Sensitivity
- Effciient Direct Decomposition of NO over La0.8A0.2NiO3(A=K, Ba, Y) Catalysts under Microwave Irradiation
- Appreciable Enhancement of Photocatalytic Performance for N-doped SrMoO4via the Vapor-thermal Method
- Infulence of Current Density on the Photocatalytic Activity of Nd:TiO2Coatings
- The Negative Thermal Expansion Property of NdMnO3 Based on Pores Effect and Phase Transition