
Blind parameter estimation of pseudo-random binary code-linear frequency modulation signal based on Duffing oscillator at low SNR*
2021-05-24 02:25KeWang王珂XiaopengYan閆曉鵬ZeLi李澤XinhongHao郝新紅andHonghaiYu于洪海
Chinese Physics B 2021年5期
關鍵詞:王珂
Ke Wang(王珂), Xiaopeng Yan(閆曉鵬), Ze Li(李澤), Xinhong Hao(郝新紅), and Honghai Yu(于洪海)
Science and Technology on Electromechanical Dynamic Control Laboratory,School of Mechatronical Engineering,Beijing Institute of Technology,Beijing 100081,China
Keywords: Duffing oscillator,pseudo-random binary code-linear frequency modulation(PRBC-LFM)signal,blind parameter estimation,low signal-to-noise ratio(SNR)
1. Introduction
Parameter estimation plays a significant role in the signal analysis process of both civilian and military communications,and can be used to intercept information or implement jamming in non-cooperative communication.[1,2]Pseudo-random binary code-linear frequency modulation (PRBC-LFM) signals combine the characteristics of PRBC and LFM,resulting in good measurement accuracy of distance and speed, strong anti-interference performance, and low interception probability. At present,these composite signals are used in a variety of areas such as radar and subminiature detectors.[3]Therefore,it is important to study the parameter estimation algorithm for PRBC-LFM signals in modern electronic intelligence reconnaissance.
Conventional parameter estimation techniques for PRBCLFM signals typically require some prior knowledge. Li et al.[4]used the method of least squares to eliminate the pseudorandom binary code, and then processed the resulting LFM signal by fast linear demodulation. However, this approach requires the pseudo-code width to be known. In other research,[5,6]the time difference of arrival was estimated by a cyclic spectral method, although the code width and carrier frequency were known in advance. Some techniques place high requirements on the signal itself. For instance,Refs. [7,8] proposed a spectrum correlation method, but this only achieves satisfactory parameter estimation performance when the frequency modulation bandwidth is greater than the ratio of the encoding number to the pulse width. Other estimation techniques have high computational complexity. Methods have been proposed in Refs. [9–11] based on the smoothed pseudo Wigner distribution (SPWVD), spectrogram and the generalized time-frequency representation of Zhao,Atlas,and Marks (ZAM-GTFR) respectively, to extract characteristics related to the carrier frequency,coefficient of frequency modulation,and pseudo-code parameter. This time-frequency analysis incurs a heavy computational load. In Ref. [12], the fractional Fourier transform(FRFT)was used to estimate the parameters of the PRBC-LFM signal, resulting in improved noise immunity. However, this approach is relatively slow because FRFT needs to conduct a two-dimensional search.He et al.[13]used the discrete polynomial phase transformation(DPT)and spectrum shift to complete the blind estimation of signals,but the accuracy was negatively affected by the complexity of the procedure. In addition, all of the above studies require the signal-to-noise ratio (SNR) to be above 0 dB for effective performance. Therefore, research on the parameter estimation of PRBC-LFM signals is generally faced with the problems of requiring some prior knowledge, computational complexity,and high SNR requirements.In particular,in complex electromagnetic environments, achieving better parameter estimation performance at low SNRs is an urgent problem.For these reasons, finding out a new blind parameter estimation method with fewer SNR requirements and less computational complexity, as well as without prior knowledge, is of great importance.
Since the 1970s, the Duffing oscillator has enjoyed widespread application in the field of weak signal detection due to its sensitivity to periodic signals and immunity to noise,[14]attracting many scholars studying its basic characteristics and practical application.[15–20]Wang et al.[21]examined the intermittent chaotic state,which enhanced the practicality of weak signal detection in chaotic systems. A method whereby a chaotic oscillator array was used to detect weak signals of unknown frequency was also described.Costa et al.[22]used the Duffing oscillator array composed of five oscillators to enhance the response of each oscillator through the correlation with the reference signal,and presented a time-frequency description of the chirp signal for SNR as low as ?17 dB.This method outperformed the traditional time-frequency analysis.References [23,24] estimated the PRBC signal with a known carrier frequency. However, under non-cooperative conditions,the carrier frequency of the pseudo-code phase modulation signal is usually unknown. These methods cannot generally be applied to PRBC-LFM signals,which have a changing carrier frequency. To date, there has been little research on the parameter estimation of PRBC-LFM signals based on the Duffing oscillator, so this is an interesting avenue for further study.
In this paper, a weak signal detection system is established based on the Duffing oscillator to estimate the phase code and carrier frequency of PRBC-LFM signals. The relationship among the output state of the Duffing oscillator excited by a PRBC-LFM signal, the difference frequency, and the phase code is presented. The amplitude (AP) method,short-time Fourier transform(STFT)method,and power spectrum entropy(PSE)method are used to identify different states of the Duffing oscillator. Then, Duffing oscillator array synchronization is used to estimate the pseudo-random sequence.Finally, carrier frequency parameters such as the modulation period, modulation coefficient, initial frequency, and termination frequency of the PRBC-LFM signal are obtained according to the above relationship and the characteristics of the difference frequency in the detection system. This blind parameter estimation method is simulated under different SNR conditions.
The remainder of this paper is organized as follows. The next section introduces the weak signal detection system based on the Duffing oscillator estimated by the standard sinusoidal signal and PRBC-LFM signal. In Section 3, the associated relational expression is established, Duffing oscillator array synchronization is used to estimate the phase code, and then the carrier frequency is estimated according to the characteristics of the difference frequencies. Section 4 shows the simulation experiment results based on the Duffing oscillator method compared with the SPWVD and FRFT methods. Finally, the conclusions to this study are presented in Section 5.
2. Weak signal detection system based on Duffing oscillator
2.1. Traditional Duffing oscillator system
The traditional Duffing oscillator system is excited by a standard sinusoidal signal,which can be expressed as
where x is the displacement,k is the damping coefficient,and?ax(t)+bx3(t) is the nonlinear restoring force. According to previous researches, the Duffing oscillator system has a good chaotic state when k=0.5,a=b=1.[25,26]Frcos(ωdt)is the periodic driving force signal of the Duffing oscillator.Acos(ω0t+?0) is the to-be-detected signal, and n(t) is the stochastic disturbance, which is Gaussian white noise in this study.
There is a critical threshold Fcin the Duffing oscillator system. When there is no signal to be detected, if Fr≤Fc,the system will be in a chaotic state; if Fr>Fc, the system will be in a large-scale periodic state. Adding the to-bedetected signal when Fr=Fcresults in two situations. First,|Δω|=|ωd?ω0| denotes the difference frequency of the tobe-detected signal and the periodic driving force signal of the Duffing oscillator. If Δω =0,the system will transform from a chaotic state to a large-scale periodic state; if Δω /=0, the system will be converted to an intermittent chaotic state. If|Δω ≤0.03ωd|, the intermittent chaotic state can be maintained regularly and stably. When Δω exceeds this range,the rule governing the intermittent chaotic state may be broken due to the insufficient maintenance time of the equivalent policy force.[21]Figure 1 illustrates the regular intermittent chaotic state of a traditional Duffing oscillator excited by a sinusoidal signal. Here, we set ωd= 2π×100 MHz,Δω =2π×3 MHz,Fr=0.826,A=0.1,and ? =0.
Fig.1. Output time domain waveform of the Duffing oscillator excited by a sinusoidal signal.
2.2. PRBC-LFM signal
The PRBC signal can be expressed as
where A is the amplitude. As shown in Eq.(4),we need to estimate three parameters of the PRBC-LFM signal,namely the initial frequency,modulation coefficient,and phase code.
If we input the PRBC-LFM signal into the Duffing oscillator system,the Duffing oscillator can be written as
where Δω =ωd?(ω0+πkft). As for the sinusoidal signal,we set Fr=Fc, so that when 0 <|Δω|≤0.03ω, the Duffing oscillator excited by the PRBC-LFM signal will be converted to the regular intermittent chaotic state. However, although there is a certain regularity, the intermittent chaotic state of the PRBC-LFM signal is different from the sinusoidal signal,because of the constantly changing phase and frequency. The time domain waveform is shown in Fig.2. Like the sinusoidal signal,we also fix ωd=2π×100 MHz,ω =2π×100 MHz,kf=3/(1×10?7)MHz/s=3×107MHz/s, Fr=0.826, A=0.1,and ?0=0.
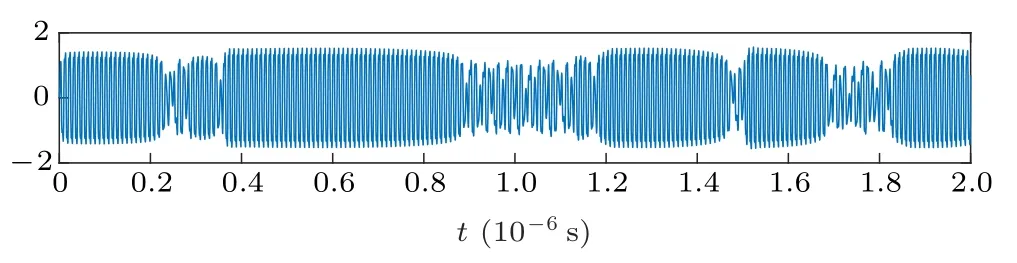
Fig.2. Output time domain waveform of the Duffing oscillator excited by a PRBC-LFM signal.
3. Parameter estimation of PRBC-LFM signal based on duffing oscillator array
3.1. Relationship among functions in duffing oscillator system excited by PRBC-LFM signal
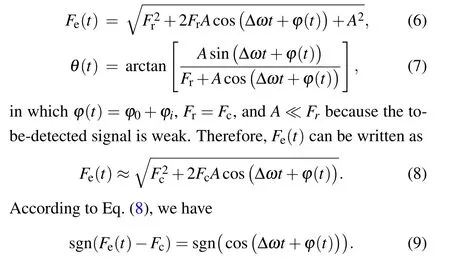
To determine the rule governing the intermittent chaotic state of the Duffing oscillator stimulated by the PRBC-LFM signal, the output signal needs to be further analyzed. As shown in Eq. (5), the equivalent periodic driving force signal can be represented as Fecos(ωdt+θ) after inputting the PRBC-LFM signal,where
In this eqnarray, sgn(number)represents the sign function: if number >0, sgn=1; if number=0, sgn=0; if number <0, sgn = ?1. The relationship among the sign function sgn(cos(Δωt+?(t))), phase code ?i, and time t is presented in Table 1, where t1=(2kπ ?π/2 ??0)/|Δω|, t2=(2kπ+π/2??0)/|Δω|,k=0,1,2,...

Table 1. Relational expression.
Based on Eq.(9)and Table 1,we can see the implied regularity of the intermittent chaotic state of the Duffing oscillator stimulated by the PRBC-LFM signal. The relationship among the output signal of the Duffing oscillator,phase code ?i,and cosine function of the difference frequency cos(Δωt+?0)can be written as

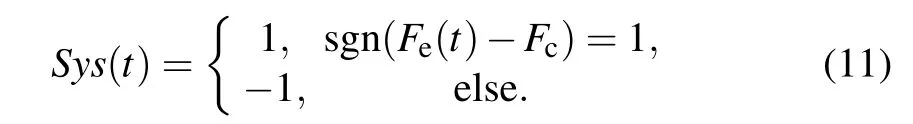
When the system is in the large-scale periodic state,Fe>Fc, so sgn(Fe?Fc)=1. When the system is in the chaotic state, Fe≤Fc, so sgn(Fe?Fc)=?1 or 0. Therefore, we can binarize the output state of the Duffing oscillator, Sys(t), as follows:
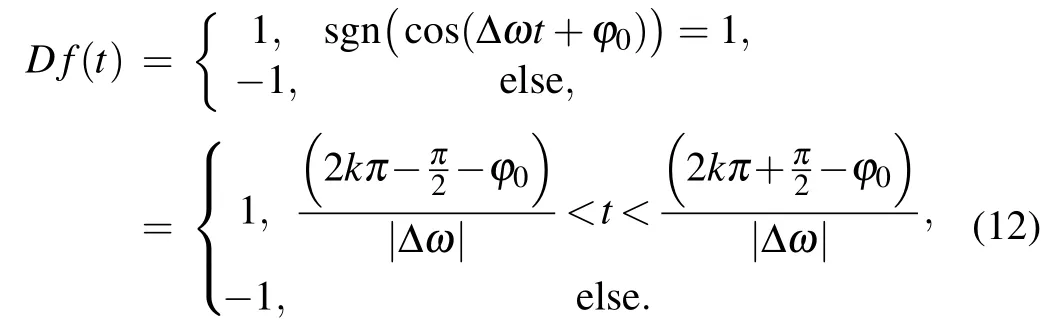
The cosine function of the difference frequency between the PRBC-LFM signal and the periodic driving force signal of the Duffing oscillator is also binarized as Df(t)
We can obtain a pseudo-random sequence Pc(t)by binarizing the phase code of the PRBC-LFM signal:

After receiving the PRBC-LFM signal in the Duffing oscillator system, there is no stable intermittent chaotic period,where the state at a certain time is determined by both the phase code ?iand the difference frequency Δω,that is,
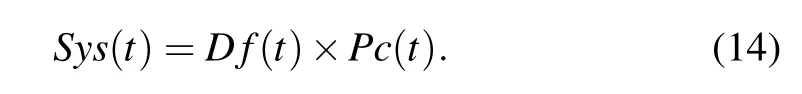
As Sys(t),D f(t),and Pc(t)are binary functions taking values of only 1 and ?1,the equivalent form of Eq.(14)is
Therefore, if any two of the three functions are known, the third one can be obtained using(Eqs.(14)–(16)).
3.2. Pseudo-random sequence estimation
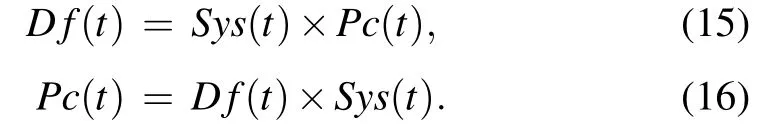
When an array of several Duffing oscillators with different periodic driving force frequencies is excited by the PRBCLFM signal, each oscillator will have a different intermittent chaotic period because of the difference in frequency. However,the oscillators are controlled by the same binary pseudorandom sequence Pc(t), and so the state conversion time of the different Duffing oscillators in the array is always the same. Therefore, the moment when the numerical transformation occurs synchronously in different Duffing oscillators corresponds to the numerical transformation in Pc(t). In this paper, we define this characteristic as the Duffing oscillator array synchronicity, which means Sys(t) of each Duffing oscillator in the array varies with change of Pc(t). Sys(t) can be directly obtained by binarizing the Duffing oscillator output signal. As shown in Fig.3,when Sys(t)in any three of the four Duffing oscillators in the array changes at the same time,it corresponds to a change of Pc(t). The Duffing oscillator array synchronicity can be used to estimate the pseudo-random sequence.
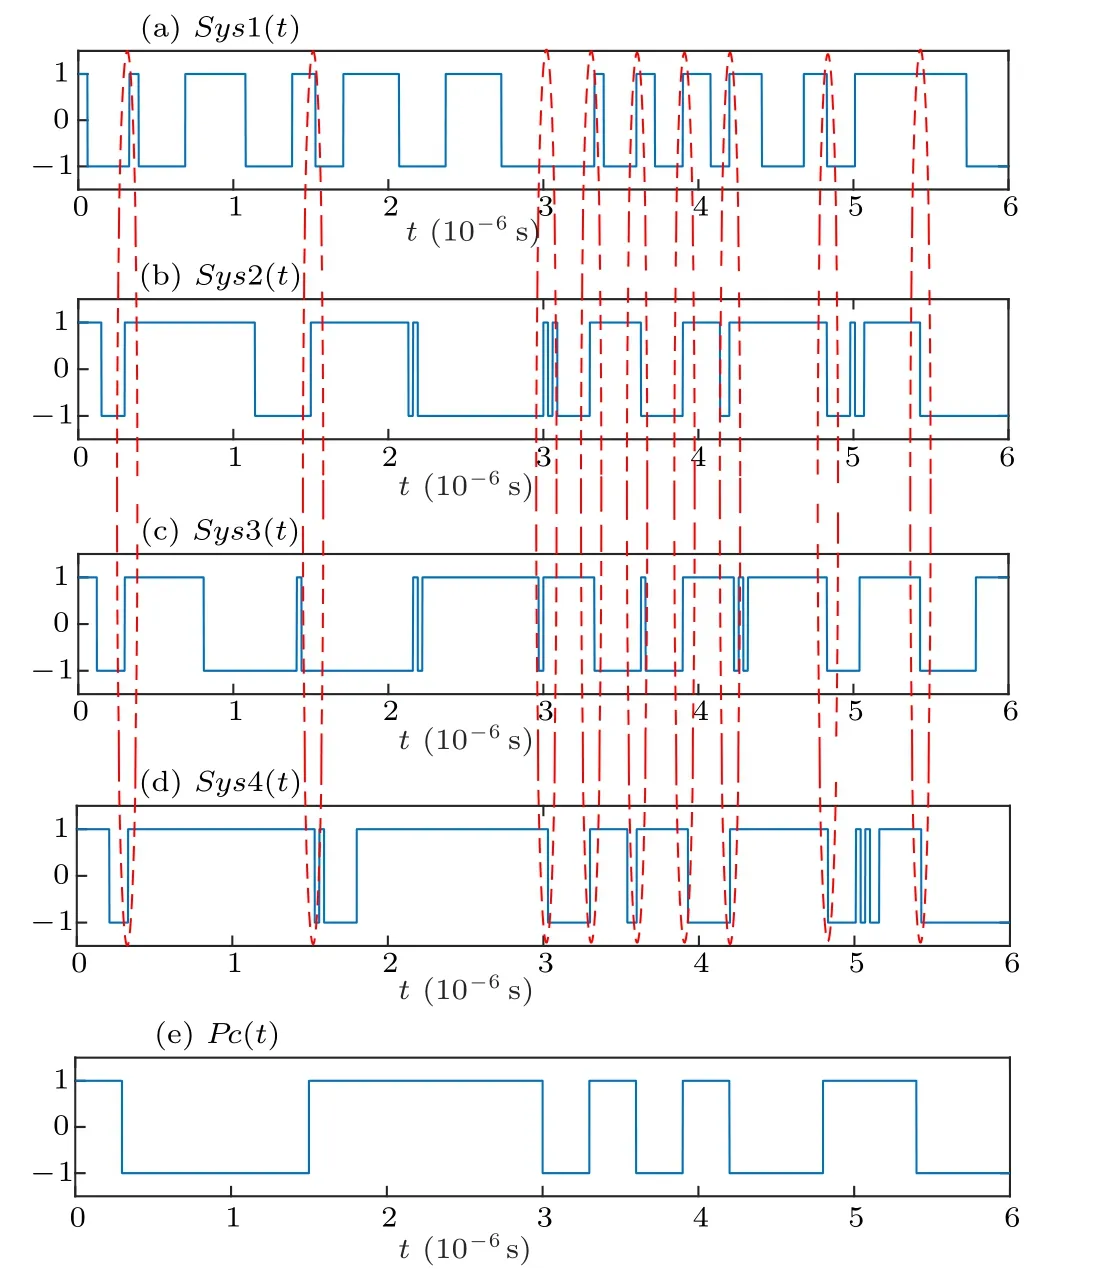
Fig.3. Time domain diagram of Sys(t)of Duffing oscillator array and Pc(t).
To realize the estimation of the pseudo-random sequence Pc(t)using the array synchronicity,the Duffing oscillator must first be binarized. The key to binarization is distinguishing the chaotic state from the periodic state in the intermittent chaotic state. In this paper,three binarization methods are considered:the AP method, STFT method, and PSE method. As shown in Fig.2,the amplitudes of the chaotic and periodic states are somewhat different,so they can be distinguished according to their amplitudes,except when there is a large amount of noise or the amplitude of the signal to be measured is small. In these cases, the amplitude difference between the two states is not obvious,which may easily lead to misjudgment and affect the blind estimation. The frequencies of different states are also different, so the STFT method can be used to perform timefrequency analysis, and thus identify the states. In addition,entropy is a measure of the degree of chaos,so it can be used to distinguish the chaotic state from the periodic state. Thus,the PSE is proposed to binarize the output of Duffing oscillators and obtain Sys(t).After binarizing the Duffing oscillator’s output,we can estimate the pseudo-random sequence based on the Duffing oscillator array synchronicity.
3.3. Carrier frequency estimation
After obtaining the pseudo-random sequence Pc(t) by processing the array of five Duffing oscillators excited by the PRBC-LFM signal in Subsection 3.2, Df(t) was determined based on Eq. (15). Since the carrier frequency of the signal to be measured is constantly changing under the control of the modulation coefficient kf, Df(t) multiplied by Pc(t) and the output Sys(t) of each Duffing oscillator in the array also changes continually. There are four relationships between the frequency of the Duffing oscillator periodic driving force ωdj(j represents the number of oscillators) and the PRBC-LFM signal ω0: (i) ωdj<ω0start, at this time, with the increase of ω0, Δω also increases gradually; (ii) ωdj<ω0end, where Δω decreases as ω increases;(iii)ω0start<ωdj<ω0end,where Δω first decreases, and then increases; and (iv) ωdj=ω0startor ωdj=ω0end,where although Δω increases or decreases gradually, the positive and negative values of the first or last period in the obtained difference frequency diagram vary significantly. Figure 4 illustrates Df(t)in each of these cases.
In Fig. 4, the dotted red lines divide the Duffing oscillators into three periods. The change in the difference frequency in each period is the same,so the time between every pair of dotted red lines is the modulation period TM. In the figure,the red serial numbers represent the starting period and the ending period of each oscillator,and the frequency corresponding to the red serial number i can be written as Δωi. In Fig. 4(a), the time period from serial number 1 to 2 gradually decreases, which means that the frequency gradually increases, as in case(i). The initial frequency measured by oscillator 1 is ω0start1=ωd1+Δω1, and the terminal frequency is ω0end1=ωd1+Δω2. The time difference between 1 and?1 of the serial number 3 in Fig.4(b)is large,after which the time period returns to normal,corresponding to case(iv),and the initial frequency obtained by oscillator 2 is equal to the periodic driving force frequency of oscillator 2. The termination frequency is ω0end2=ωd2+Δω4according to the serial number 4. In Fig.4(c), the time period from serial number 5 to 6 first rises and then declines, satisfying the case of (iii),with an initial frequency measured by oscillator 3 of ω0start3=ωd3?Δω5, and a terminal frequency of ω0end3=ωd3+Δω6.At the same time, in Fig.4(d), the time difference between 1 and ?1 of serial number 8 is very different,again representing case(iv),so ω0end4=ωd4. According to serial number 7,the termination frequency is ω0start4=ωd4?Δω7. In Fig.4(e),the time period from serial number 9 to 10 gradually increases,so it meets the case of(ii),with an initial frequency based on oscillator 1 of ω0start5=ωd5?Δω9,and a terminal frequency of ω0end5=ωd5?Δω10.

Fig.4. Time domain diagram of D f(t).

Fig.5. Flow chart of parameter estimation method.
The average of the initial frequencies ω0startiand the termination frequencies ω0endimeasured by the five Duffing oscillators gives the final ω0startand ω0end. The modulation frequency can then be written as ΔFM=?(ω0start?ω0end)/(2π),giving a modulation coefficient of kf= ΔFM/TM. A larger number of oscillators would result in higher accuracy,but with correspondingly greater computational complexity.
In summary,a flow chart of the proposed blind parameter estimation method for PRBC-LFM signal based on a Duffing oscillator array is shown in Fig.5.
4. Simulation experiment and analysis
4.1. Pseudo-random sequence estimation simulation
We fix the amplitude of the PRBC-LFM signal to be 0.1, the initial frequency to be ω0start= 2π ×100 MHz,the terminal frequency to be ω0end= 2π × 103 MHz,and the pseudo-random sequence over 6×10?6s to be 10000111110101001100. The frequency of the periodic driving force of the Duffing oscillator ωdand the frequency of the PRBC-LFM signal ω0have five possible relationships:ωd =ω0start, ωd<ω0start, ω0start<ωd<ω0end, ωd=ω0end,ωd>ω0end. Therefore,we set up an array of five Duffing oscillators to estimate the pseudo-random sequence,and set their ωdvalues to 2π×99 MHz,2π×100 MHz,2π×101.5 MHz,2π×103 MHz,and 2π×104 MHz,respectively.
Because of the advantages of equal spectrum,simple and convenient in mathematical processing,Gaussian white noise occupies an important position in practical application. Most of the undulating processes in radio equipment can be treated as Gaussian white noise. Many other interfering processes can be also treated as Gaussian white noise as long as their power spectrum is much wider than the passband of the system and their power spectrum density is evenly distributed in and around the passband of the system. Therefore, when detecting weak signals,the detection effect under the background of Gaussian white noise is generally analyzed. To realize signal detection under different SNRs, the variance σ2of the Gaussian noise is adjusted to be 0,0.5,5,15.8114,and 50,respectively, corresponding to the SNR being noiseless, ?20 dB,?30 dB, ?35 dB and ?40 dB. The time domain waveform of Pc(t)is obtained based on Sys(t),using the AP,STFT and PSE methods. The Duffing oscillator array synchronization is shown in Figs.6–10.
Fig.6. Pc(t)without noise.
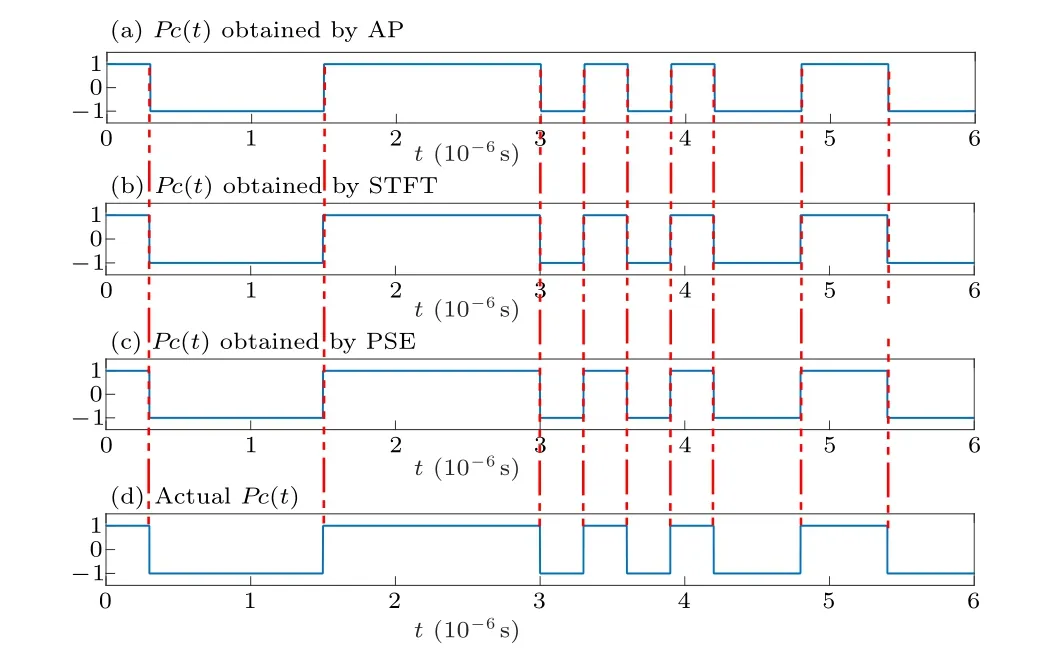
Fig.7. Pc(t)in ?20 dB SNR.

Fig.8. Pc(t)in ?30 dB SNR.

Fig.9. Pc(t)in ?35 dB SNR.
Fig.10. Pc(t)in ?40 dB SNR.
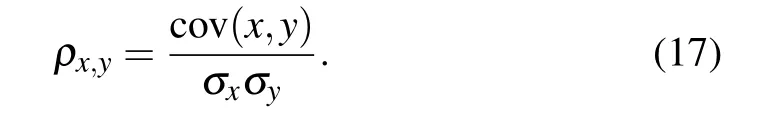
Pearson’s correlation coefficient is used to compare the correlation between the Pc(t) obtained by each method and the actual Pc(t) under different SNRs. The results are presented in Table 2. Pearson’s correlation coefficient is defined as the quotient of the covariance and the standard deviation between two variables,and its formula is[27]
From Figs.6–10 and Table 2,it can be seen that all three methods give good estimation results for pseudo-random sequence estimation under an SNR of ?35 dB. As the SNR decreases, the Pearson’s correlation coefficients of all three methods gradually decrease. The AP method exhibits the worst anti-noise performance,with a correlation coefficient of less than 0.8 at ?35 dB. The binarization method based on PSE gives an estimated pseudo-random sequence that is close to the actual sequence, providing the best anti-noise performance.
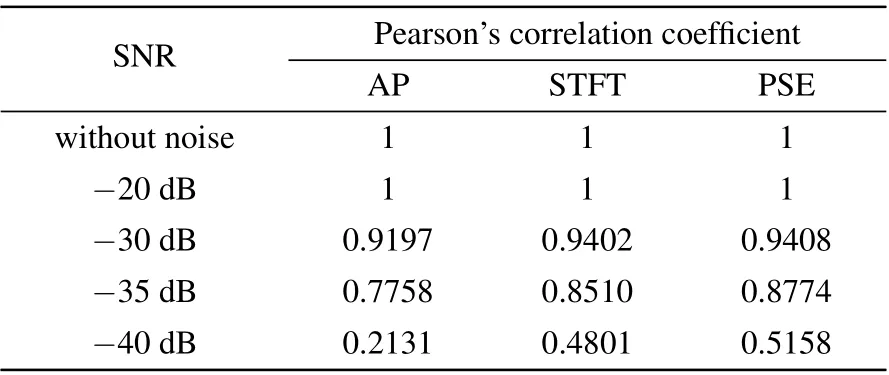
Table 2. Simulation results under different SNR.
Therefore, we use the PSE method to binarize the output of the Duffing oscillator array to get Sys(t). For universality, 100 experiments are conducted under each SNR. We also simulate the SPWVD method in Ref. [9] and FRFT in Ref.[12]method under different SNRs as a contrast;the conditions of these two methods are the same as the Duffing oscillator method.However,the performance of these two methods is poor under ?20 dB;we only compare these three methods at ?20 dB to 5 dB. The normalized root mean squared error(NRMSE)results of pseudo-code width are shown in Fig.11.Here,the NRMSE is defined as[9–12]
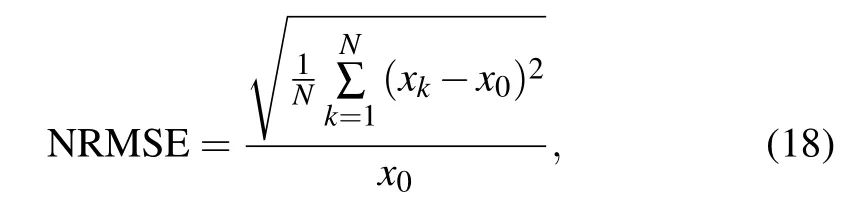
where x is the true value of the parameter,xkis the estimation value of parameter,and N is the estimation time.
As shown in Fig. 11, the Duffing oscillator method proposed in this paper can estimate the pseudo-random code width more accurately under different SNRs than the SPWVD and FRFT methods. Under an SNR of ?20 dB, NRMSEs based on SPWVD and FRFT methods are both more than 1.5,whereas that based on the Duffing oscillator method is only 0.0445.

Fig.11. NRMSE of pseudo-random code width based on three methods.
4.2. Carrier frequency estimation simulation
After obtaining the Pc(t)by array synchronicity, we can determine Df(t) from Eq. (15), and then estimate the carrier frequency based on the above method; 100 experiments are conducted under each SNR.Like the pseudo-code estimation simulation,we also simulate the SPWVD and FRFT methods at ?20 dB to 5 dB as a contrast,which is shown in Fig.12.
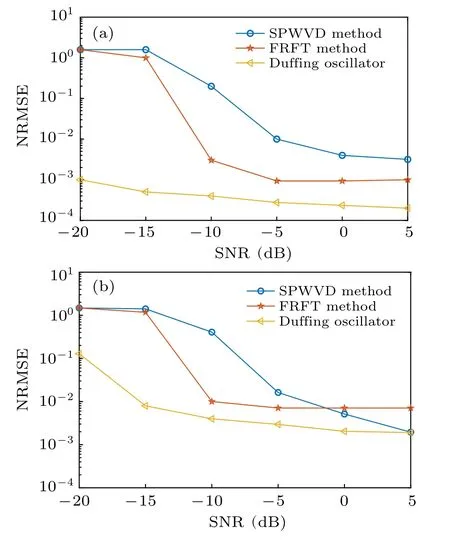
Fig. 12. NRMSE of carrier frequency based on SPWVD, FRFT and Duffing oscillator. (a)Center frequency. (b)Modulation coefficient.
In Fig. 12, the blind estimation accuracy of carrier frequency including the center frequency and modulation coefficient based on the Duffing oscillator in this paper is better than the SPWVD and FRFT methods obviously in different SNRs.In addition, the estimation of center frequency is more accurate and stable,and the estimation results have little difference at ?20 dB to 5 dB.
4.3. Blind parameter estimation results
The simulation results under other SNRs are presented in Table 3. It can be seen that the center frequency estimation is more accurate than the modulation coefficient and pseudorandom code width. The NRMSE in the center frequency is only 0.107 at ?40 dB,whereas those of the other two parameters are relatively large. In short,the blind parameter estimation method based on the Duffing oscillator can achieve highprecision carrier frequency and pseudo-random code estimation under an SNR of ?35 dB.
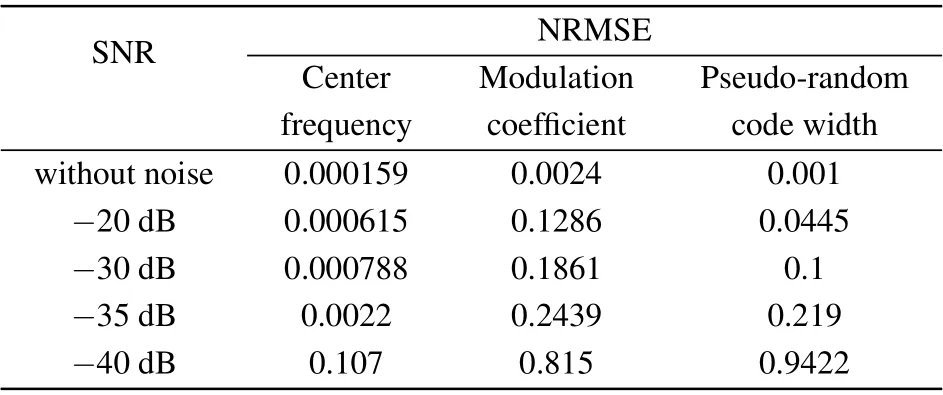
Table 3. Simulation results under different SNR.
In order to verify that this method can solve the problem of computational complexity,the computing time for parameter estimation of PRBC-LFM based on the Duffing oscillator under sampling number P is compared with the SPWVD and FRFT methods. All of the conditions of these three methods are the same. The simulation results are shown in Table 4.With the growth of P,the calculation time of both methods increases. However,the SPWVD method cannot compute more than the P of 3×10⁴, which limits its application and antinoise performance. Besides,the calculation time based on the Duffing oscillator is much less than that of the SPWVD and FRFT methods,especially when the value of P is large,which proves that the method presented in this paper is simpler.
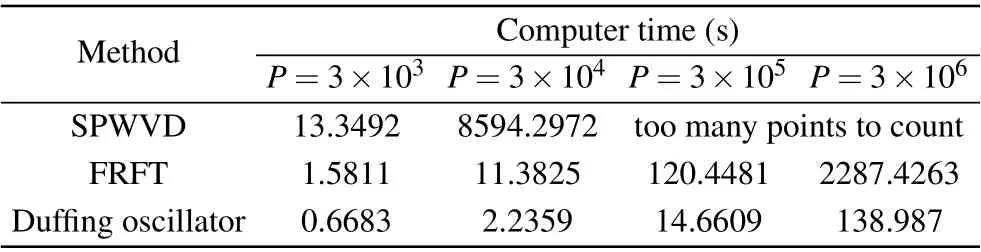
Table 4. Computing time of three methods.
5. Conclusions
In this study, by analyzing the output characteristics of a Duffing oscillator excited by a PRBC-LFM signal,we have derived the relationship among the output of the Duffing oscillator, pseudo-random sequence and cosine function of the difference frequency, which provides a theoretical basis for the blind estimation of PRBC-LFM signals. After binarizing the output of the Duffing oscillator array,we can estimate the pseudo-random sequence based on the Duffing oscillator array synchronicity. According to the obtained pseudo-random sequence and the multiplication relation, we obtained the binary cosine function of the difference frequency, and realized blind estimation of the carrier frequency by analyzing the time-domain diagrams of the difference frequency.Simulation results show that this method can estimate the pseudo-random sequence, carrier frequency, and frequency modulation coefficient with high accuracy, with better simulation results and less computing time than traditional methods like SPWVD and FRFT, and maintain good performance up to an SNR of?35 dB.
However, the estimation result of the carrier frequency is greatly influenced by the pseudo-random sequence,and the key is the binarization by state identification. In future work,we will attempt to find a more effective method that improves the accuracy of binarization.
猜你喜歡
青少年科技博覽(中學版)(2022年4期)2022-05-30
第二課堂(小學版)(2022年5期)2022-05-26
第二課堂(小學版)(2022年4期)2022-04-23
美與時代·城市版(2021年7期)2021-09-15
快樂作文(1.2年級)(2021年8期)2021-09-04
好日子(2019年12期)2019-02-14
作文新天地(初中版)(2017年4期)2017-06-10
——記2016年高考安徽省岳西縣理科第一名王珂
青蘋果(2016年21期)2016-04-11
小學生時代·大嘴英語(2015年7期)2015-11-23
小學生時代·大嘴英語(2014年12期)2015-01-07

- Chinese Physics B的其它文章
- Corrosion behavior of high-level waste container materials Ti and Ti–Pd alloy under long-term gamma irradiation in Beishan groundwater*
- Degradation of β-Ga2O3 Schottky barrier diode under swift heavy ion irradiation*
- Influence of temperature and alloying elements on the threshold displacement energies in concentrated Ni–Fe–Cr alloys*
- Cathodic shift of onset potential on TiO2 nanorod arrays with significantly enhanced visible light photoactivity via nitrogen/cobalt co-implantation*
- Review on ionization and quenching mechanisms of Trichel pulse*
- Thermally induced band hybridization in bilayer-bilayer MoS2/WS2 heterostructure?