
Experimental study of single-translated fieldreversed configuration in KMAX
2022-08-29 00:42HuiLIAO廖暉ChaoqiHU胡超琪YilinLI李宜霖BaomingREN任寶明andXuanSUN孫玄
Plasma Science and Technology 2022年9期
Hui LIAO(廖暉) ,Chaoqi HU(胡超琪),Yilin LI(李宜霖),Baoming REN(任寶明)and Xuan SUN (孫玄)
Department of Plasma Physics and Fusion Engineering, School of Nuclear Science and Technology,University of Science and Technology of China, Hefei 230026, People’s Republic of China
Abstract For collisional merging field-reversed configurations(FRCs),it is desired to have both FRCs tuned to be approximately the same,as well as to optimize each FRC to have high temperature and high translation speed so as to retain most of the equilibrium flux after traveling a distance to the middle plane for merging.The present study reports the experimental study of a single-translated FRC in the KMAX-FRC device with various diagnostics, including a triple probe, a bolometer, several magnetic probe arrays, and a novel 2D internal magnetic probe array. According to the measurements conducted in the present study,a maximum toroidal magnetic field equal to ~1/3 of the external magnetic field inside the FRC separatrix radius is observed,and the typical parameters of a single-translated FRC near the device’s mid-plane are ne~(2-4)×1019 m-3, Te~8 eV,Ti~5 eV, rs ~0.2 m, ls ~0.6 m and ?p(RR) ~0.2 mWb. The 2D magnetic topology measurement revealed,for the first time,the time evolution of the overall internal magnetic fields of a single-translated FRC, and an optimized operation regime is given in the paper.
Keywords: field-reversed configuration, FRC formation, FRC translation, probe measurement(Some figures may appear in colour only in the online journal)
1. Introduction
A field-reversed configuration is a plasmoid enclosed with self-organized magnetic fields that belong to the compact torus [1, 2]. The features of FRCs include high beta, movability and a simple geometry, as well as a natural divertor formed by its open magnetic field lines in the edge,making it an appealing fusion concept, especially for advanced aneutronic fusion reactions, such as D-He3and p-B11. Collisional merging (CM) FRCs formed by two single-translated FRCs have gained increasing attention following a series of experiments conducted in the Inductive Plasma Accelerator(IPA) experiment [3], the C-2 series device (C-2, C-2U and C-2W) of TAE Technologies Inc. [4-6], and the FAT-CM device at Nihon University [7, 8], in which the poloidal flux was amplified and the confinement was improved after merging. The collisional merging process can yield a long-lived FRC, which can benefit the quasi-steady-state operation by neutral beam injection or even the development of FRC-based magnetic inertial fusion[9,10].Naturally,it is crucial to form two identical and well-performed single-translated FRCs prior to the merging process.
One of the key KMAX-FRC research topics is the translation and collision merging process of FRCs.To form a high-quality collisional merging FRC, the two single-translated FRCs must have similar parameters;for instance,similar plasma density and separatrix radius. In this paper, we first introduce the diagnostics employed in the experiments,including a newly installed 2D internal magnetic probe, and then present evidence of the formation of two similar highspeed single-translated FRCs in the confinement chamber.The measurements of the single-translated FRCs presented in this study include electron density,electron temperature,FRC separatrix radius, FRC length, translation speed, internal magnetic field profiles,etc.The experimental results of radial density scanning, Abel inversion of the emission profile, and internal magnetic topology roughly show similar separatrix radii that are usually estimated from an external magnetic probe. The estimated FRC length from the external magnetic probe array is consistent with the result from the internal measurement of the 2D magnetic probe array. Furthermore,the internal magnetic field profiles are investigated by magnetic probes and the poloidal flux is simply estimated with the rigid rotor (RR) model [11]. The 2D magnetic topology measurement reported in this study represents the first measurement to reveal the evolution characteristics of the overall internal magnetic field in the single-translated FRC.

Figure 1.(a)The schematic of KMAX-FRC with stepped θ-pinch coils and diagnostics;(b)the typical profile of the axial magnetic field in the KMAX-FRC experiments with/without the main field formed by the θ-pinch coils.
2. KMAX θ-pinch FRC and diagnostics
2.1. KMAX θ-pinch FRC
The KMAX θ-pinch FRC is an FRC experiment with θ-pinch coils installed inside the central cell of a tandem mirror device named KMAX(Keda Mirror with AXisymmetry)[12,13].As depicted in figure 1(a), KMAX is at present a 10.4 m long axisymmetric tandem mirror device primarily comprising one central cell and two end cells, which are 5.2 m and 2.2 m in length, respectively [14]. The diameters of the central vessel and the mirror throat are 1.2 m and 0.3 m, respectively. The 10 mm thickness of the stainless-steel wall of the central confinement chamber can serve as a magnetic field conserver for the current KMAX θ-pinch FRC experiments (the characteristic FRC lifetime is~100 μs). The quasi-dc magnetic field is generated by 16 axially distributed solenoids, which are powered by ten sets of super-capacitors (48 V and 165 F for each).The typical profile of the axial magnetic field in the KMAX-FRC experiments with/without the main field formed by the θ-pinch coils is illustrated in figure 1(b). The axial magnetic field in the device’s mid-plane is about 100 G and the mirror magnetic field at the tail end of the stepped-pinch coils is about 2000 G. The early engineering design and experimental results of KMAX-FRC have been reported by Lin et al [12, 15], after which a few minor upgrades have been incorporated since the KMAX device was relocated to another campus.
The capacitor-to-electrode transmission line was replaced with new coaxial cables with lower inductance and a higher voltage rating of 40 kV, which improved the pre-ionization because of faster ringing currents as well as the amplitude and rising time of the main compression magnetic field. New rapid electromagnetic valves to make fast, controllable and repeatable pulse gas injection have been developed and employed in the new experiments.When a fast-rising current is produced in the circuit(typical peak current is 2 kA and rise time is ~80 μs), the working gas, hydrogen, can be ejected quickly within 150 μs,and the duration of the gas injection is 1.5 ms. The θ-pinch discharge starts at t=1.8 ms, shortly after the end of the gas injection(gas is injected at t=0 ms).The gas injection is critical for FRC formation. There should be enough neutral gas in the formation section to ionize,yet it has to be minimized outside the source region,or it may affect the translation and performance of the FRC.The negative bias and positive main field of the θ-pinch in this work are typically adjusted to -250 G and 1200 G, respectively. Once formed,the FRC is ejected from the formation section due to the axial magnetic field gradient, and it expands during translation due to the reduced magnetic field and the large diameter of the confinement chamber. At the mid-plane of the device, a typical single-translated FRC has a radius of~0.2 m, a length of~0.6 m, and an electron density of~(2-4)×1019m-3.

Figure 2.(a)CAD drawing of the radial movable 2D magnetic probe array; (b) picture of the triple probe on the device’s mid-plane; (c)schematic diagram of the optical paths of the bolometer; (d) picture of the external magnetic probe; (e) picture of the 1D Bt magnetic probe array.
2.2. Diagnostics
The diagnostics used in the experiment are described below.The positions of the triple probe, the 1D Btmagnetic probe array, the 2D magnetic probe array, the flux loop near the north formation region, the bolometer near the south formation region, and the widely used external magnetic probe array (Bearray) in the FRC experiment for measuring the external axial magnetic field [16], are marked in figure 1(a).Figure 2(a)presents a diagram of the 2D magnetic probe array installed on the R-Z plane to measure the time evolution of the internal magnetic field during the FRC collision merging. It contains a total of 32 spatial data points (4 points in the radial direction and 8 points in the axial direction),and at each data point,two pickup coils are installed orthogonally to measure Bzand Br, respectively. The interval between two adjacent spatial points, in the R or Z direction, is 5 cm. The 2D magnetic probe array is shielded by eight quartz tubes,each with a 12 mm outer diameter.The pickup coils are made of ceramic-core commercial chip inductors (Coilcraft,1812CS-333XGLC) that have been successfully used in several plasma experiments to measure the magnetic field[17-19]. The probe can move in the radial direction with a range of 30 cm, and a limit slot is used to ensure the movement is only on the R-Z plane.The entire probe is designed to be as compact as possible; the pickup coils are directly connected to the eight 19-pin LEMO plugs for external output via 64 pairs of twisted-pair wires made from machine-wound polyimide enameled wire.To minimize the entry of unwanted noise,the output signals are connected to the digitizer card via eight of the shortest shielded network cables.
The movable triple probe is made up of three 0.5 mm diameter cylindrical tungsten wires with a tip of about 1 mm,as shown in figure 2(b).The bias voltage is-50 to-80 V to extract the ion saturation current, which is measured with a Pearson’s current sensor (Pearson’s 2877, voltage/current=1 V/A). The unfiltered bolometer located at Z=-0.25 m is made up of a 16 channel AXUV array (AXUV16ELG), and the amplifier is placed as close as possible. A schematic diagram of the bolometer’s optical paths is shown in figure 2(c), where the outermost chord, which is~26 cm away from the center, is long enough to cover almost the entire plasma region of the single-translated FRC. The external magnetic probe array is installed at r=50 cm and evenly distributed from Z=-0.825 m to Z=0.825 m with a distance of 0.15 m.The probe at each position,as shown in figure 2(d), consists of two pickup coils (Coilcraft, 1812CS-333XGLC)mounted in parallel on a poly tetra fluoroethylene(PTFE)base to ensure operation if either of the two coils fail.Figure 2(e) shows the picture of the 1D Btmagnetic probe,which consists of 15 Btcoils that are placed along the r direction with a higher spatial resolution of 2 cm. It is also movable in the radial direction,where the first coil set(Bt#1)can be placed from r=-10 cm to r=20 cm.
3. Experimental results for single-translated FRC
To optimize the FRC performance at the device’s mid-plane,the gas injection must be tuned as low as possible so that the FRC in the formation region can have a higher initial electron temperature and subsequent faster translation speed to keep most of the initial poloidal flux.
3.1. Density and temperature measurements
The time evolution of the radial density and temperature profiles of the single-translated FRC is depicted in figure 3(a).The result was obtained by scanning the triple probe from r=0 to 30 cm at intervals of 5 cm.The data collected at each point were averaged over four consecutive shots.As shown in figure 3(b),the repeatability of the FRC plasma is acceptable;the hatched area represents the standard deviation in four repeated shots. Figure 3(a) depicts the typical hollow density distribution of an FRC,with the peak density near r~15 cm;it also depicts a relatively flat electron temperature inside the FRC. Figure 3(c) depicts a time slice of the radial electron density and temperature profiles at t=20 μs, as well as typical radial profiles of the FRC mid-plane. The measured electron temperatures inside the separatrix radius(rs~0.2 m)are nearly identical (8 eV) and rapidly decrease outside the separatrix radius(rs~0.2 m).Outside of the FRC,the plasma density profile exhibits the same trend of rapidly decreasing.The solid red line in figure 3(c) represents the density fitting results from the RR model withn=2.5×10¹⁹sech2[0.63(r2152-1)].The largest discrepancy is observed on the axis,which may be caused by the inaccuracy of the simple RR model or perhaps by the cooling of the probe. Although there is no direct measurement of the ion temperature, the ion temperature Ti~5 eV in the singletranslated FRC can be inferred from the radial pressure bala nce condition, i.e.nm(Ti+Te)=2μ0.

Figure 3. Experimental signals of triple probe. (a) Time history of the radial scanning of the single-translated FRC parameters: the averaged electron density and the averaged electron temperature;(b)the averaged electron density measured by triple probe at r=0 cm and r=15 cm;the hatched area indicates standard deviation in four repeated shots; (c) time slice of the radial electron density and temperature profiles at t=20 μs; the RR fit of radial electron density profile is represented by the solid red line. t=0 μs is the peak time of the main field.
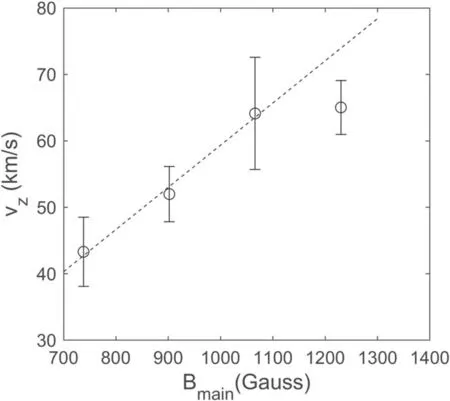
Figure 4.The measured translation speed under different main magnetic field.
3.2. Translation speed
The adiabatic theory of FRC translation states that the kinetic energy of an FRC is converted from the thermal energy of an FRC [20]. The experimental results indicate that the translation of FRC relies on the magnetic field gradient between the source region and the translation region [21]. Usually, in field-reversed theta-pinch (FRTP) formation, increasing the thermal energy of FRC means improving the main field,which simultaneously increases the magnetic field gradient.In our experiment, if the background magnetic field in the translation region remained unchanged, we observed that the FRC translation speeds increased almost linearly with Bmainat first, as shown in figure 4. However, when the main field reaches a ‘threshold’, the FRC translation speed is no longer growing, even though there is only one data point to demonstrate the trend. Furthermore, we discovered that a much higher main field will degrade the FRC quality, as evidenced by the lower excluded flux inferred from the flux loop and Bearray. If the FRC exits the formation section before the main field’s peak time,the remaining energy of the main field is wasted, and thus an increase in the main field does not always result in an increase in speed. In addition, a much higher main field will lead to premature ejection of plasmoid from the formation section,for example,ahead of a complete FRC formation, resulting in the deterioration of the formed FRC.Because the threshold of the main field depends on the background magnetic field,the initial gas pressure and the negative bias field,an increase in the main field above the threshold is avoided without changing other parameters in the present experiment. Further improvement of the main field is needed for the formation of a higher-temperature KMAXFRC in the near future. To avoid the unfavorable situations mentioned above, the background field and bias field may need to be adjusted on the same scale.

Figure 5. The time sequence of the diamagnetism ΔBz of singletranslated FRCs: (a) north FRC and (b) south FRC. The estimated translation speed is indicated by the dashed green line. t=0 μs is the peak time of the main field and the green asterisk indicates the time (t~20 μs) when FRC passes Z=0.

3.3. Separatrix radius and separatrix length


Figure 6.The axial distribution of the excluded flux radius when the single-translated FRC arrives near the device’s mid-plane: (a) north FRC and (b) south FRC. Fitted solid lines indicate the FRC length.

Figure 7.Experimental signals of bolometer in south singletranslated FRC. (a) Abel inversion of the bolometer; the vertical dashed green line indicates t=18 μs; (b) the normalized result of Abel inversion at t=18 μs; the vertical dotted black line indicates r=15 cm.Pr is the total radiation power collected by each chord of the AXUV array. t=0 μs is the peak time of the main field.

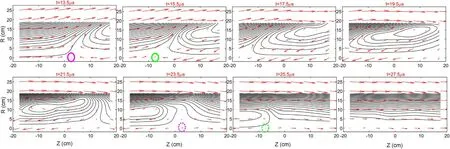
Figure 8.The time evolution of the 2D magnetic field (R-Z plane). The magnitude and direction of the magnetic field are indicated by red arrows. The contours of the poloidal flux ψ (R,Z)are indicated by solid black lines. t=0 μs is the peak time of the main field.


3.4. Internal magnetic field profiles and poloidal flux
The internal magnetic field profiles were investigated by a 2D magnetic probe array and a 1D Btmagnetic probe array. It is noted that no obvious FRC radial shift was observed in the KMAX single-translated FRC. As shown in figure 9, the overlap of signals between AXUV#8 and AXUV#9,as well as the internal magnetic field measurement in the north FRC,validates the assumption of FRC axisymmetry.Therefore,in a typical KMAX-FRC internal-field measurement, the first pickup coil set(Bz#1 or Bt#1)of probes is usually placed at r=0.Figure 10(a)shows the temporal evolution of the Bz(r)profile in a single-translated north FRC, which is extracted from the internal magnetic field measurement of the 2D magnetic probe array at Z=-2.5 cm.When the FRC passes through the probe, the field-reversed structure of the translated FRC is clearly recorded. Figure 10(b) depicts the temporal evolution of the Bt(r) profile in another similar shot, in which a significant toroidal magnetic field is observed inside the FRC separatrix radius. It should be mentioned that the appearance of Btinside a translated FRC has been evidenced in previous experiments [17, 23-27] and related numerical simulations [28, 29]. What is more, in our experimental measurement, an opposite polarity of Btcan be repeatedly measured outside the FRC’s separatrix radius and at the rear of a single-translated FRC, which is assumed to be contributed by the plasma on the open magnetic field line.Figure 10(c) shows time slices of the radial magnetic field profiles at t~20 μs in figures 10(a) and (b), revealing that the maximum value of Btinside the FRC separatrix radius is~1/3 of the external magnetic field Be. The experimental results also indicate that the south FRC in KMAX has a similar Btprofile to the single-translated north FRC but with the opposite helicity.

Figure 9. (a) The difference in signal between AXUV#8 and AXUV#9 in north/south FRC experiment; (b) the radial profile of the axial field measured by the magnetic probe at Z=0.5 m in north FRC experiment.
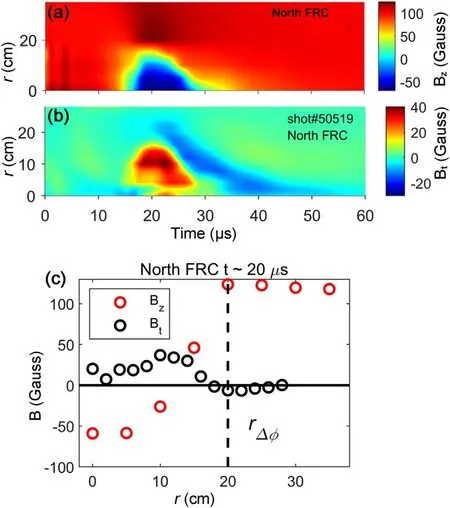
Figure 10.The temporal evolution of (a) Bz(r) profile and (b) Bt(r)profile in the single-translated north FRC;(c)time slices of the radial magnetic field profiles at t~20 μs in (a) and (b).

4. Conclusions
In summary, FRC formation and translation in conical θ-pinch coils are investigated in the KMAX-FRC experiment;it is discovered that the FRC formation time and acceleration time should be optimized to make full use of the capacitor energy. Moreover, a high-temperature, low-density FRC is more advantageous for fast translation, which is consistent with adiabatic translation theory. In addition, two similar single-translated FRCs have been successfully formed in the north and south formation regions and accelerated to a high speed via the magnetic field gradient. The global measurement of a single-translated FRC is performed using various diagnostics. The typical parameters of a well-formed singletranslated FRC near the device’s mid-plane are ne~(2-4)×1019m-3,Te~8 eV,Ti~5 eV,rs~0.2 m,ls~0.6 m and ?p(RR)~0.2 mWb.The internal magnetic field measurements showed a clear field-reversed structure of the Bz(r)profile and a significant toroidal field inside the FRC separatrix radius.The observed toroidal field may have positive effects on the stability and confinement of FRCs in KMAX [30, 31].However, the KMAX-FRC parameters (temperature, magnetic flux, translation speed, etc) are much lower than those reported in previous experiments,which may limit the ability to provide high-accuracy prediction of high-energy FRC dynamics. The parameters obtained in our experiment are much lower than those obtained in the devices such as C-2 and FAT CM, however, the underlying physics associated with magnetic reconnection and shockwave generation should be the same, though direct comparison with their experimental observation should exercise caution.Furthermore,the success of the internal magnetic topology measurement will pave the way for subsequent KMAX CM-FRC experiments to conduct magnetic measurements.
Acknowledgments
This work was supported by the National Key R&D Program of China (No. 2017YFE0301802) and National Natural Science Foundation of China (No. 12175226).
ORCID iDs
Hui LIAO (廖暉) https://orcid.org/0000-0001-5974-7983
 Plasma Science and Technology2022年9期
- Plasma Science and Technology的其它文章
- Degradation of tiamulin by a packed bed dielectric barrier plasma combined with TiO2 catalyst
- Improvement of the spreading effect of atmospheric pressure microplasma jet treatment through shielding-gas-controlled focusing
- Efficient direction-independent fog harvesting using a corona discharge device with a multi-electrode structure
- Experimental study on surface arc plasma actuation-based hypersonic boundary layer transition flow control
- Microchannel cooling technique for dissipating high heat flux on W/Cu flat-type mock-up for EAST divertor
- Implementation and application of PyNE sub-voxel R2S for shutdown dose rate analysis