
Microchannel cooling technique for dissipating high heat flux on W/Cu flat-type mock-up for EAST divertor
2022-08-29 00:43MingxiangLU魯銘翔LeHAN韓樂QiZHAO趙起JunchengQIU邱俊城JianhongZHOU周劍宏DinghuaHU胡定華NanyuMOU牟南瑜andXuemeiCHEN陳雪梅
Plasma Science and Technology 2022年9期
Mingxiang LU (魯銘翔), Le HAN (韓樂), Qi ZHAO (趙起),Juncheng QIU (邱俊城), Jianhong ZHOU (周劍宏), Dinghua HU (胡定華),Nanyu MOU (牟南瑜) and Xuemei CHEN (陳雪梅),*
1 MIIT Key Laboratory of Thermal Control of Electronic Equipment, School of Energy and Power Engineering,Nanjing University of Science and Technology,Nanjing 210094,People’s Republic of China
2 Institute of Plasma Physics, Hefei Institutes of Physical Science, Chinese Academy of Sciences, Hefei 230031, People’s Republic of China
Abstract
Keywords: microchannel, divertor, flat-type, high heat flux test, EAST
1. Introduction
The divertor, which is an important component of tokamaks,is mainly responsible for extracting heat and helium ash [1].The divertor of the Experimental Advanced Superconducting Tokamak (EAST) needs to withstand steady-state high heat flux (HHF) of 10 MW m-2on the strike point of the targets with a poloidal length of about 15 mm, and the maximum flow rate of the divertor is 650 m3h-1[2-5]. Therefore, it is necessary to optimize the thermal design of the divertor so that the structure of the plasma-facing components (PFCs)can withstand HHF without compromising the physical integrity. Generally, ITER-like PFCs utilize tungsten (W) as the plasma-facing material, oxygen-free copper (OFC) as the interlayer, chromium zirconium copper (CuCrZr) as the heat sink material and 316L stainless steel as the supporting structure [6].
The PFCs mainly consist of monoblock type and flat type. The flat-type concept has the advantages of good machinability, light weight and low cost [7, 8]. Cooling tube and hypervapotron structure are two conventional heat sink designs for flat-type PFCs.Zhao et al[9]proved that a mockup with a cooling tube can withstand an absorbed heat flux of 5 MW m-2at an inlet flow rate of ~26 l min-1, and the maximum W surface temperature was about 470 °C. Lian et al [10] demonstrated that the W surface temperature of a mock-up reached nearly 1000 °C with a cooling tube at an absorbed heat flux of 9 MW m-2, an inlet temperature of 25 °C, an inlet pressure of 1 MPa, but at an ultra-high inlet flow rate of ~40.7 l min-1.The hypervapotron structure has a high heat-transfer capability due to the vortex generated in the cavity[11, 12]. Nagaraju et al [13] proved that the allowable incident heat flux of a mock-up with hypervapotron structure increased from 10 to 12 MW m-2when the flow rate increased from 30 to 60 l min-1at an inlet temperature of 40 °C and an inlet pressure of 1 MPa. Mou et al [14]demonstrated that the maximum W surface temperature of a mock-up with optimized hypervapotron structure was 474°C at an absorbed heat flux of 10 MW m-2, inlet temperature of 25 °C, inlet pressure of 1 MPa and inlet flow rate of~46 l min-1. Based on the abovementioned literature, it can be seen that a mock-up needs a large inlet flow rate in order to withstand HHF,or else it will result in a sharp increase in the surface temperature and rapid decrease in the heat-transfer coefficient(HTC),and‘burnout’of the component will occur in the end [15].
To increase the heat-transfer capability at a low inlet flow rate, herein, we propose a strategy to remove the HHF on a W/Cu flat-type unit using a microchannel heat sink. The concept of a microchannel heat sink was first proposed by Tuckerman and Pease in 1981 [16]. Since then, numerous studies have been carried out to improve the heat-transfer performance of microchannels via delicately controlling the surface wettability or geometry structures. Fu et al [17] systematically studied the effect of aspect ratio on the flow boiling heat transfer and critical heat flux (CHF) in a diverging microchannel heat sink. They demonstrated that a microchannel with a large aspect ratio has a higher heattransfer rate and CHF. Yang et al [18] experimentally investigated the flow boiling characteristics in silicon nanowire microchannels, and found that the CHF is 491 W cm-2at a mass flux of 389 kg(m2·s)-1.Yin et al [19]investigated the heat transfer and pressure drop characteristics in open microchannels and found that the open microchannels can withstand heat flux up to 13.6 MW m-2without reaching the CHF at a mass flux of 374 kg (m2·s)-1. Therefore, the open microchannel heat sink has the potential to dissipate HHF loaded on the strike point area when it is integrated into the divertor modules.
In this work, we design and manufacture a high-performance W/Cu flat-type mock-up cooled by an open microchannel heat sink that has excellent heat-transfer performance at low inlet flow rate. The balance of this paper is organized as follows.Section 2 introduces the test pieces,heat exchange experimental platform and experimental procedures. In section 3, the results and discussion of the steady-state HHF test and thermal fatigue test are introduced. Section 4 summarizes the main conclusions of this study.
2. Experimental section
2.1. Test module for steady-state HHF test
First, we designed a test module with open microchannels to evaluate the heat dissipation capacity of the microchannel heat sink. The dimension of the heat sink is limited by the estimated heat flux to be achieved and the heat removal capability of the experimental platform.Thus,the heat sink is manufactured with a geometric shape of 28 mm×28 mm×7 mm (width×length×thickness). In order to obtain the optimal dimensions of the microchannels, the numerical simulation was applied to explore the influence of the geometric parameters (i.e. width, depth, and gap thickness) of the open microchannels on the heat dissipation performance. The microchannels are manufactured on a CuCrZr block using wire-cutting technology. Figure 1(a) shows the open microchannel test section that consists of a heat sink,OFC heating block,and cartridge heaters.Thirty-six cartridge heaters with a maximum heating power of 18000 W are inserted into vertical holes from the bottom of the block to provide heat to the surface.In order to prevent excessive heat loss, a layer of alumina fiberboard with thermal conductivity of 0.174 W(m·K)-1is wrapped around the outside of the heat sink during the test.K-type thermocouples with a diameter of 0.5 mm are used to measure the temperatures in the bulk of the block. Figure 1(b) depicts the location of four sets of thermocouples (j=1-4) placed 6 mm apart, with each set having three thermocouples(i=1-3)spaced by 2 and 3 mm,respectively. The thermocouples (i=2) are located on the heating surface and the thermocouples (i=3) are embedded 1 mm below the bottom of the channels. Figure 1(c) shows the geometric dimensions of the open microchannels. The parallel channels and the 0.3 mm uniform thickness gap beneath them constitute the open microchannels, which have 43 parallel 0.3 mm×1 mm(width×depth)channels with a fin width of 0.3 mm.
2.2. Manufacturing W/Cu flat-type mock-up with microchannel heat sink
A schematic drawing of the W/Cu flat-type mock-up with an open microchannel heat sink is shown in figure 2.The mockup consists of four W/Cu tiles and a CuCrZr microchannel heat sink.The manufacturing process of W/Cu tiles is to cast OFC onto the rear side of W tiles and then employ a hot isostatic pressure(HIP)technique to close the pores.The W/Cu tiles have a width of 44 mm, an axial length of 12 mm,and the thicknesses of W and OFC are 2 and 1 mm, respectively;the interlayer OFC is used to relieve the thermal stress between W and CuCrZr.The CuCrZr microchannel heat sink has a width of 43 mm, an axial length of 56 mm, and a thickness of 7 mm; the microchannels have 67 parallel 0.3 mm×1 mm (width×depth) channels with a fin width of 0.3 mm.

Figure 1.Schematic diagram of the (a) test section, (b) arrangement of thermocouples and (c) geometry of the open microchannels.

Figure 2. Schematic diagram of W/Cu flat-type mock-up with the microchannel heat sink.
2.3. Heat exchange experimental platform for steady-state HHF test
A schematic diagram of the experimental loop for the steadystate HHF test is shown in figure 3.The flow loop includes a filter(10-20 μm),gear pump(GC-M35.PVS.E, IDEX),plate heat exchanger,turbine flow meter(LWGY-10C,FIMETER),the microchannel test section,a shell and tube heat exchanger,reservoir tank and two chillers. The filter prevents any solid contaminants from entering the gear pump and protects the flow meter. The gear pump delivers working fluid(deionized water) to the microchannel test section, and the flow rate is adjusted by controlling the speed of the gear pump.The plate heat exchanger is connected to the chillers (LX-5000, Coolium Instruments) to further accurately control the inlet temperature of the test section. The turbine flow meter measures the volume flow of the working fluid. After being heated in the test section, the working fluid flows into the shell and tube heat exchanger, which is connected to the aircooled box-type industrial chillers(CRX-08ASZ,COARL)to cool down the working fluid. The reservoir tank collects the cooled liquid and provides the working fluid to the gear pump to complete the flow loop.The working fluid is boiled off for 3 h to remove the non-condensable gases before entering the flow loop.
A synchronous data acquisition system composed of a computer, the Keysight Technologies Inc. data acquisition system and the BenchVue DAQ program is utilized to monitor and record the temperature and pressure. The inlet and outlet temperatures of the test section and the heat sink temperature are measured using K-type thermocouples. The inlet and outlet pressures of the test section are measured with pressure transmitters(PX119-100AI,OMEGA).The pressure drop is calculated from the difference between the inlet and outlet pressures. The flow rate is measured using the flow meter.
2.4. Experimental procedure of steady-state HHF test
The experiments are performed by connecting the test module to the experimental loop under various test conditions. The flow rate and inlet temperature of the working fluid are controlled by the gear pump and chillers, respectively. In this study, experiments under different flow rates (4-9 l min-1)are performed at an inlet temperature of 20 °C. Step-by-step increment in flow rate of 1 l min-1and heating power of 1000 W is adopted for each test. The temperature and pressure data are recorded by the DAQ system. After the test module reaches the steady state (characterized by the change in heating block temperature of less than 1 °C over a 5 min period), the temperatures and pressures are recorded at 1 Hz for 2 min and determined via the average value. For safety reasons, the test is terminated when CHF occurs or the temperature of the heating block exceeds 1000 °C.
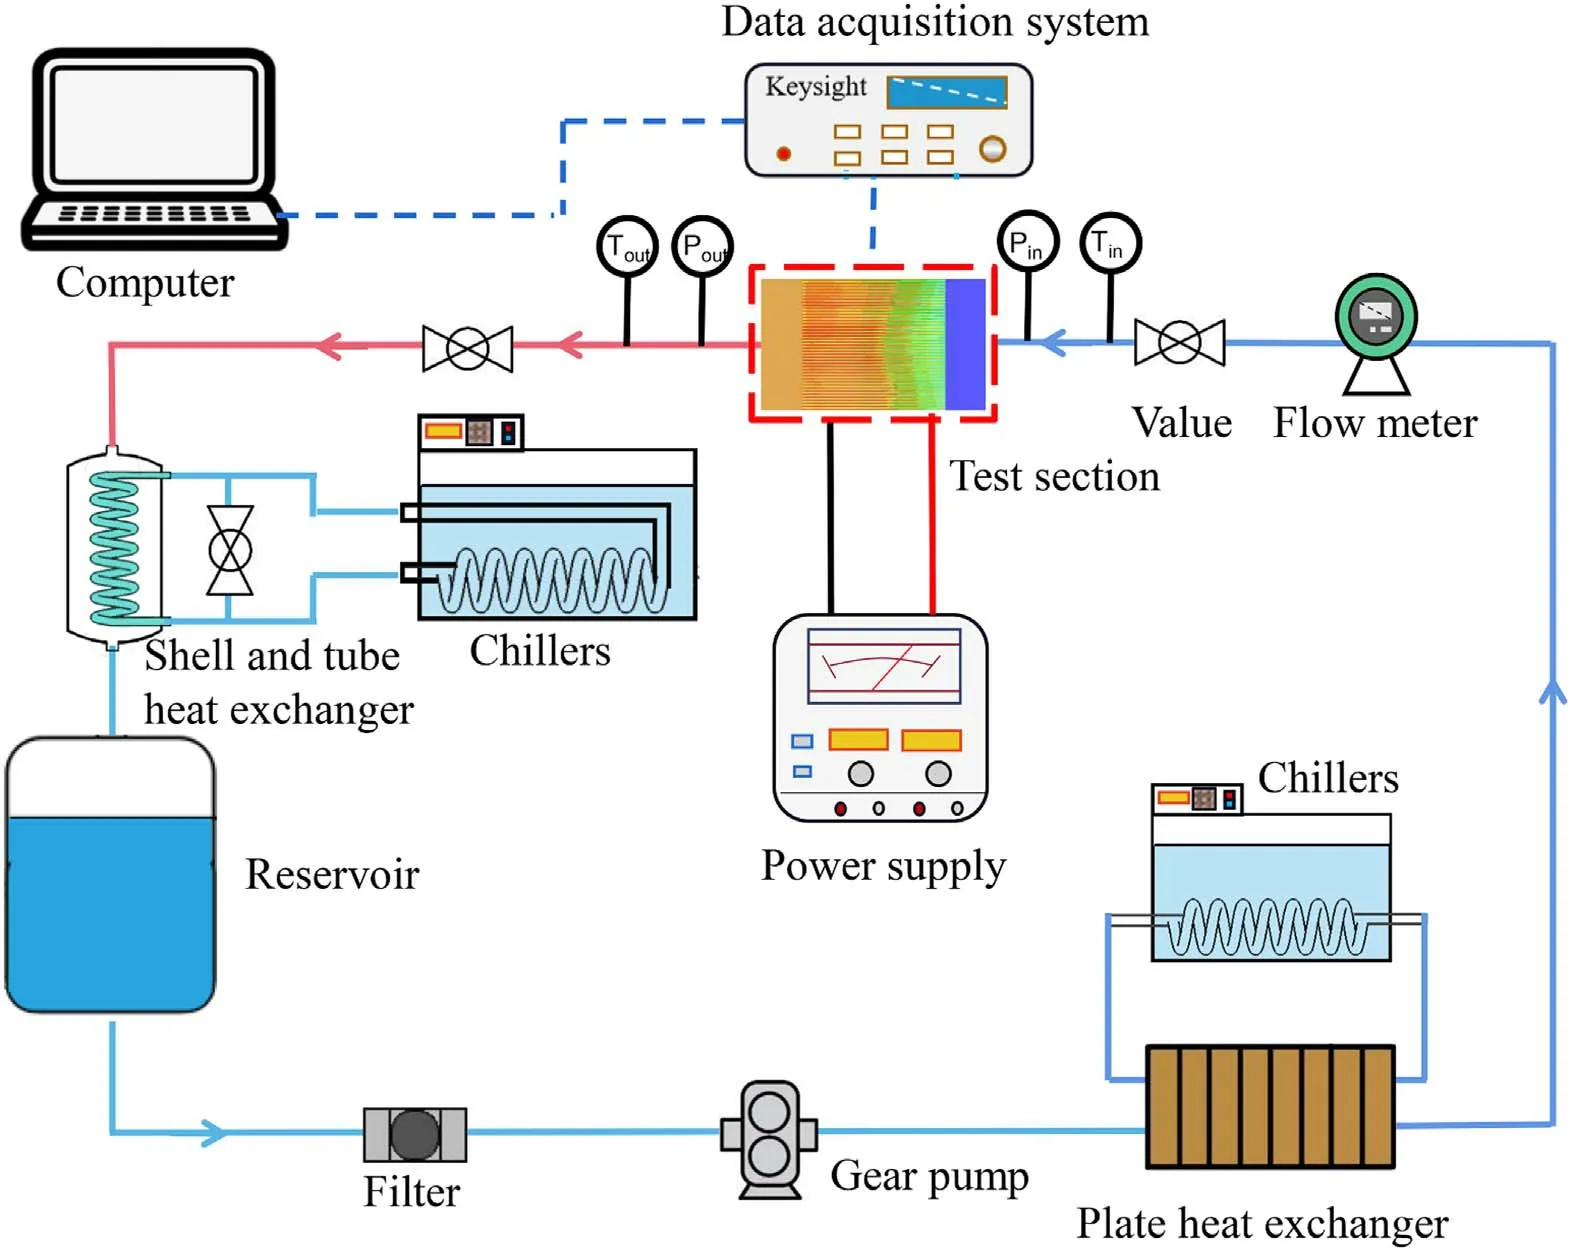
Figure 3. Schematic diagram of the experimental flow loop.
2.5. Experimental procedure of thermal fatigue test
In order to evaluate the thermo-mechanical performance of the W/Cu flat-type mock-up cooled by an open microchannel heat sink under cyclic thermal load,the thermal fatigue test is carried out with an electron beam facility at the University of Science and Technology of China.The image of the mock-up mounted on the sample platform is shown in figure 4. The electron beam facility has a maximum electron power of about 30 kW at an acceleration voltage of 85 kV and a current of 350 mA. The maximum heating area of the electron beam equipment is about 100×100 mm2.The surface temperature of the mock-up is monitored and recorded by a pyrometer(PA20AF1, KELLER). The temperature range of the pyrometer is 250 °C-2000 °C. The location of the temperature measuring point is shown in figure 4. The water temperatures at the inlet and outlet are monitored and recorded by two thermometers (PCT300). The incident heat flux(qin, W m-2) is determined:
where Ueis the acceleration voltage (kV), Ieis the current(mA) and A is the heat-loaded area (m2).
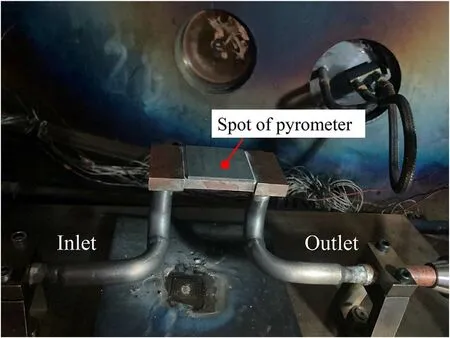
Figure 4.Mock-up mounted on the sample platform.
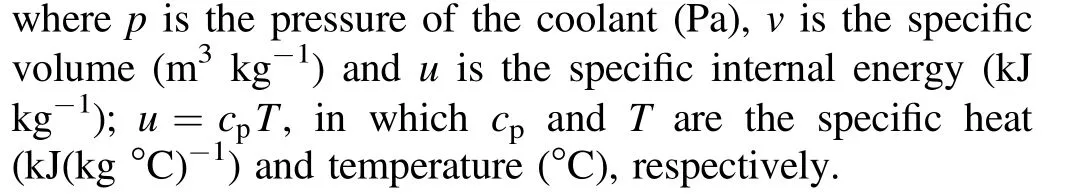
The absorbed heat flux (qabs, W m-2) of the mock-up is evaluated using the specific enthalpy difference of the coolant at the inlet and outlet.
where V is the volumetric flow rate (m3s-1), ρ is the fluid density (kg m-3),hinand houtare the inlet and outlet specific enthalpy of the coolant(kJ kg-1),and the specific enthalpy of the coolant (h, kJ kg-1) is given by:

Deionized water is used as the coolant. The hydraulic conditions are set to an inlet pressure of 842.8±4.2 kPa, an inlet temperature of(30±0.2)°C,and a volume flow rate of 1.6±0.008 m3h-1(26±0.13 l min-1). The number of cycles at 10 MW m-2during the thermal fatigue test is 1000 and the heat-load duration and cooling time in one cycle are set to be 15 s.The number and duration of cycles are referred to the thermal fatigue tests of the mock-ups that were designed for EAST,as reported by Zhao et al[9]and Li et al[20]. The heat-loaded area is 800±40 mm2with an acceleration voltage of 177.1±0.9 kV and a current of 74.6±0.4 mA. The outlet temperature is (34.4±0.2) °C.According to the standard uncertainty analysis method given by Moffat [21], the maximum uncertainties of the incident heat flux and absorbed heat flux are 5.06% and 5.07%,respectively. The incident heat flux is about 16.5±0.8 MW m-2(according to formula 1) and the absorbed heat flux is about 10.1±0.5 MW m-2(according to formula 2). Thus,the heat absorption ratio is about 0.61,which is comparable to the results reported by others [20, 22]. After the test, the interface of OFC/CuCrZr is examined by ultrasonic testing(UT), and the surface morphology is observed using a digital microscope.
3. Results and discussion
3.1. Data reduction and uncertainties
Some heat will inevitably be lost during the steady-state HHF test despite the thermal insulation wrapped around the test section.In the thermal fatigue test,the W surface will reflect a part of the incident electron beam energy because of backscattered electrons. The heat loss rate of the test section is determined according to the energy balance:

where Qinputdenotes the input power(W),which is calculated based on the voltage U(V) and current I(A) applied to the cartridge heaters:

The heating power absorbed by the working fluid (Qabs,W) is determined:
where hinand houtare the inlet and outlet specific enthalpy of the working fluid (kJ kg-1), and M is the mass flow rate(kg s-1), which is given by:
where V is the volumetric flow rate(m3s-1)and ρ is the fluid density (kg m-3).
The absorbed heat flux qabs(W m-2) is given by:
where A is the heat-loaded area(m2),A=W×L,in which W and L are the width and length of the heat sink (m),respectively.
The local heat flux qj(W m-2) is obtained using Fourier’s law of heat conduction:

where k denotes the thermal conductivity of CuCrZr (W (m°C)-1), didenotes the relative distance between the two thermocouples (m) and Ti,jdenotes the thermocouple temperature (°C) (the detailed position is shown in figure 1). The local wall temperature Tw(°C) is given by:

where dwis the distance between the thermocouple position and the top surface of the microchannel (m). The fluid temperature distribution assumes a linear change from the inlet to the outlet, and the local fluid temperature Tj(°C) is given by:
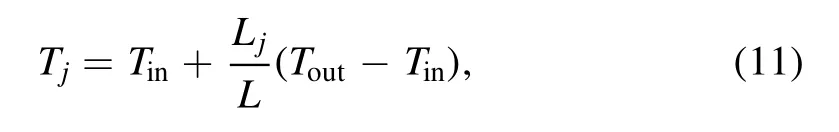
where Ljdenotes the distance of the corresponding thermocouple to the inlet(m)and L is the length of the microchannel(m). Local HTC h(W (m2°C)-1) is given by:
The pressure drop is determined by the difference between the inlet pressure pinand outlet pressure pout(Pa):

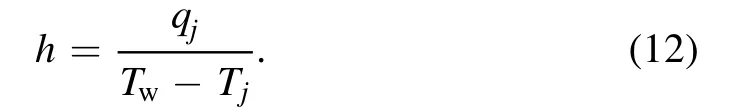
The uncertainties of sensors and correlation parameters are listed in table 1.The uncertainties of other dependent data are determined according to the standard uncertainty analysis method given by Moffat [21].

The maximum uncertainties of the absorbed heat flux during the steady-state HHF test, the absorbed heat flux during the thermal fatigue test and HTC are 4.06%, 5.07%and 3.6%, respectively.
To ensure the accuracy of the pyrometer, the K-type armored thermocouples were used to calibrate the pyrometer using a W temperature calibration module,which refers to the calibration method of Pan et al[23].We make the pyrometer readings consistent with the thermocouples by adjusting theemissivity in the range of 300°C-900°C(in steps of 100°C)and take the average of the seven sets of emissivity.Deviation between the pyrometer and thermocouples was measured at 300°C-900°C(in steps of 100°C)using the final emissivity,and there is a very small deviation (~1%) between the thermocouple and the pyrometer.
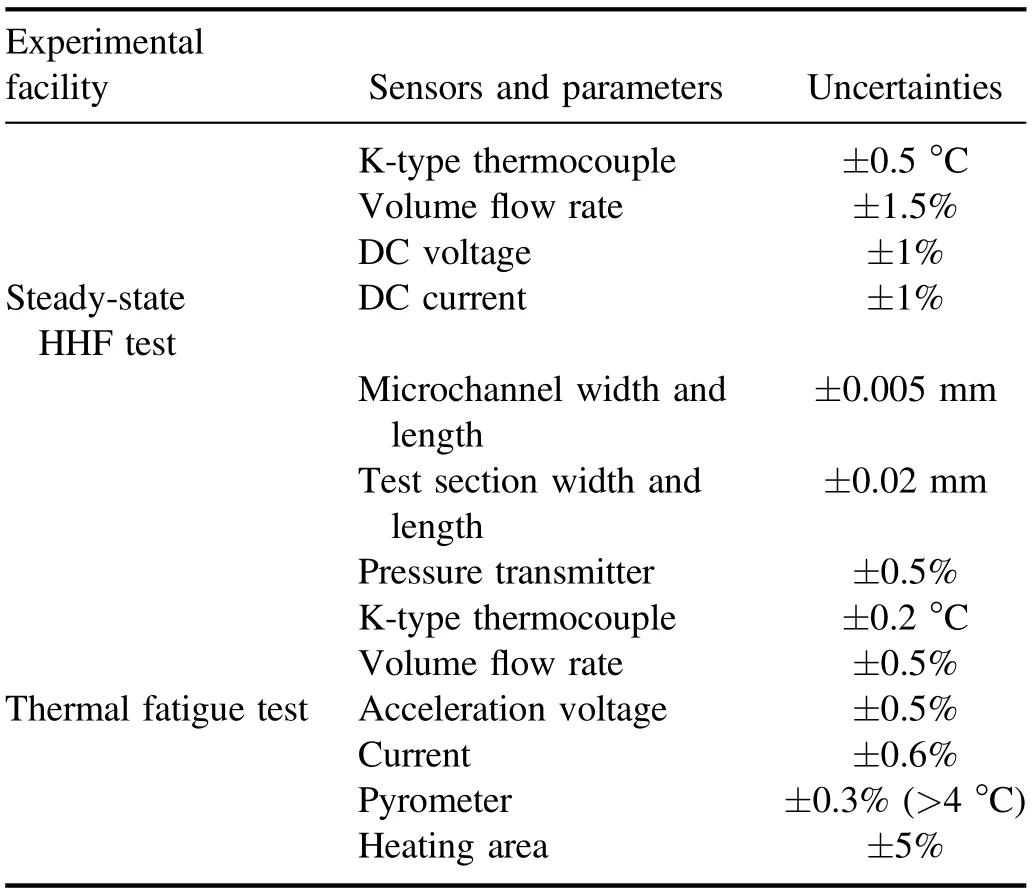
Table 1. Experimental parameter uncertainties.
3.2. Heat transfer and pressure drop performance of open microchannels
The heat dissipation capacity of the microchannel heat sink was evaluated using the steady-state HHF test. First, we investigated the effect of flow rate on heat-transfer performance in the microchannels. The heat flux as a function of wall superheat(j=4)at different flow rates(4-9 l min-1)is shown in figure 5(a). Note that 9 l min-1is the maximum flow rate of the pump, and the tests are terminated due to the increase in wall superheat, and CHF is not reached in the tests. It can be seen from figure 5(a) that the relationship of wall superheat to heat flux is linear, which is a typical characteristic of single-phase heat transfer.The slope of the curve is proportional to the flow rate (the higher the flow rate, the larger the slope of the curve), indicating that the amount of heat flux that can be dissipated increases with the increase in flow rate at a certain wall superheat. As the flow rate increases, the curves gradually get closer, which may be ascribed to the fact that the heat transfer is mainly dominated by forced convection in the single-phase region,and the flow rate has a limited effect on the reduction of the temperature of the heating surface (the position as shown in figure 1(c)).Hence,when increasing the flow rate,the average temperature of the heating surface decreases,and the curves gradually get closer to each other, as shown in figure 5(b).

Figure 5.(a) Heat flux as a function of wall superheat (j=4) at aflow rate of 4-9 l min-1 and(b)average heating surface temperature as a function of heat flux at a flow rate of 4-9 l min-1.
Since the heat dissipation performance at a larger flow rate is better, we then studied the effect of heat flux on the HTC at a flow rate of 9 l min-1.The variation in experimental parameters at different heating powers is shown in table 2.Note that when the absorbed heating power is below 8943.8 W(absorbed heat flux is 11.4 MW m-2),the heat sink works normally without water leakage; once the absorbed heat flux is over 11.4 MW m-2, the temperature of the heating block reached 1000°C. Therefore, the experiment is terminated for safety reasons, not because the CHF is reached in the microchannels and the highest heating surface temperature is 184.3 °C.

Figure 6.(a) Heat flux as a function of wall superheat at 9 l min-1, (b) pressure drop and HTC as a function of heat flux, (c) validation of HTC against numerical results and (d) temperature distribution on the heating surface.

Table 2. The working conditions under different heating powers.
The heat flux as a function of wall superheat (j=4) at a flow rate of 9 l min-1is shown in figure 6(a). The curve has good linearity, as does the characteristic of single-phase flow.The HTC at the farthest downstream location (j=4) and the pressure drop between the inlet and outlet as a function of heat flux are depicted in figure 6(b). The fluctuation of HTC and pressure drop are only 6.3% and 6.9% in the tested heat flux ranges, respectively, further demonstrating that the singlephase regime is dominated by the open microchannels.In order to better understand the temperature uniformity of the heating surface,a computational fluid dynamics(CFD)simulation was carried out with a single-phase case. The boundary conditions were set as an inlet temperature of 20°C,an inlet flow rate of 9 l min-1and a heat flux of 110 kW m-2at the hole wall of the cartridge heaters (i.e. a heat flux of 11.4 MW m-2at the heating surface).The k-epsilon model was adopted to simulate turbulence. To validate the simulation results of CFD, the HTCs at diffident locations along the length of the heat sink block(j=1-4)are shown in figure 6(c).When the heat flux is 11.4 MW m-2, there are slight variations between the experimental HTCs and the numerical simulation results.However,the trend at different locations is consistent with each other. The discrepancy between experimental and numerical results could come from the fact that the thermocouple holes were neglected in the simulation. From the temperature distribution on the heating surface,as shown in figure 6(d),it can be observed that the heating surface has a good temperature uniformity.
3.3. Thermal fatigue performance of W/Cu flat-type mock-up
The steady-state HHF test demonstrates that the heat sink with open microchannels had the capability to remove absorbed heat flux of 10 MW m-2and exhibited good temperature uniformity. Thus, the open microchannel was utilized as the heat sink of W/Cu flat-type mock-up, in order to see if the mock-up can perform better in terms of thermal fatigue resistance and temperature at the heat-loaded surface compared to the state-of-the-art flat-type structures. Before the thermal fatigue test,we carried out a single-phase steadystate thermal analysis of the mock-ups with and without a microchannel heat sink.The schematic diagram of W/Cu flattype mock-up without a microchannel heat sink is shown in figure 7(a). Note that the mock-up without microchannels possesses only a rectangular channel with a length of 39.9 mm and height of 1.3 mm. The boundary conditions are set to an inlet temperature of 30°C,a flow rate of 26 l min-1and a heat flux of 10 MW m-2on the heating area.Figures 7(b)-(g)show the temperature distributions of the W surface,W/Cu interface and OFC/CuCrZr interface of the mock-ups with and without microchannels. The microchannel structure can greatly reduce the maximum temperature of W surface, CuCrZr alloy and OFC interlayer under the same boundary conditions.Compared to the heat sink without microchannels, the microchannel structure can increase the solid-liquid contact area by 208%and thus the average HTC is increased by 13%, further demonstrating that the heat-transfer efficiency of the microchannel heat sink is much higher than that of the heat sink without microchannels.
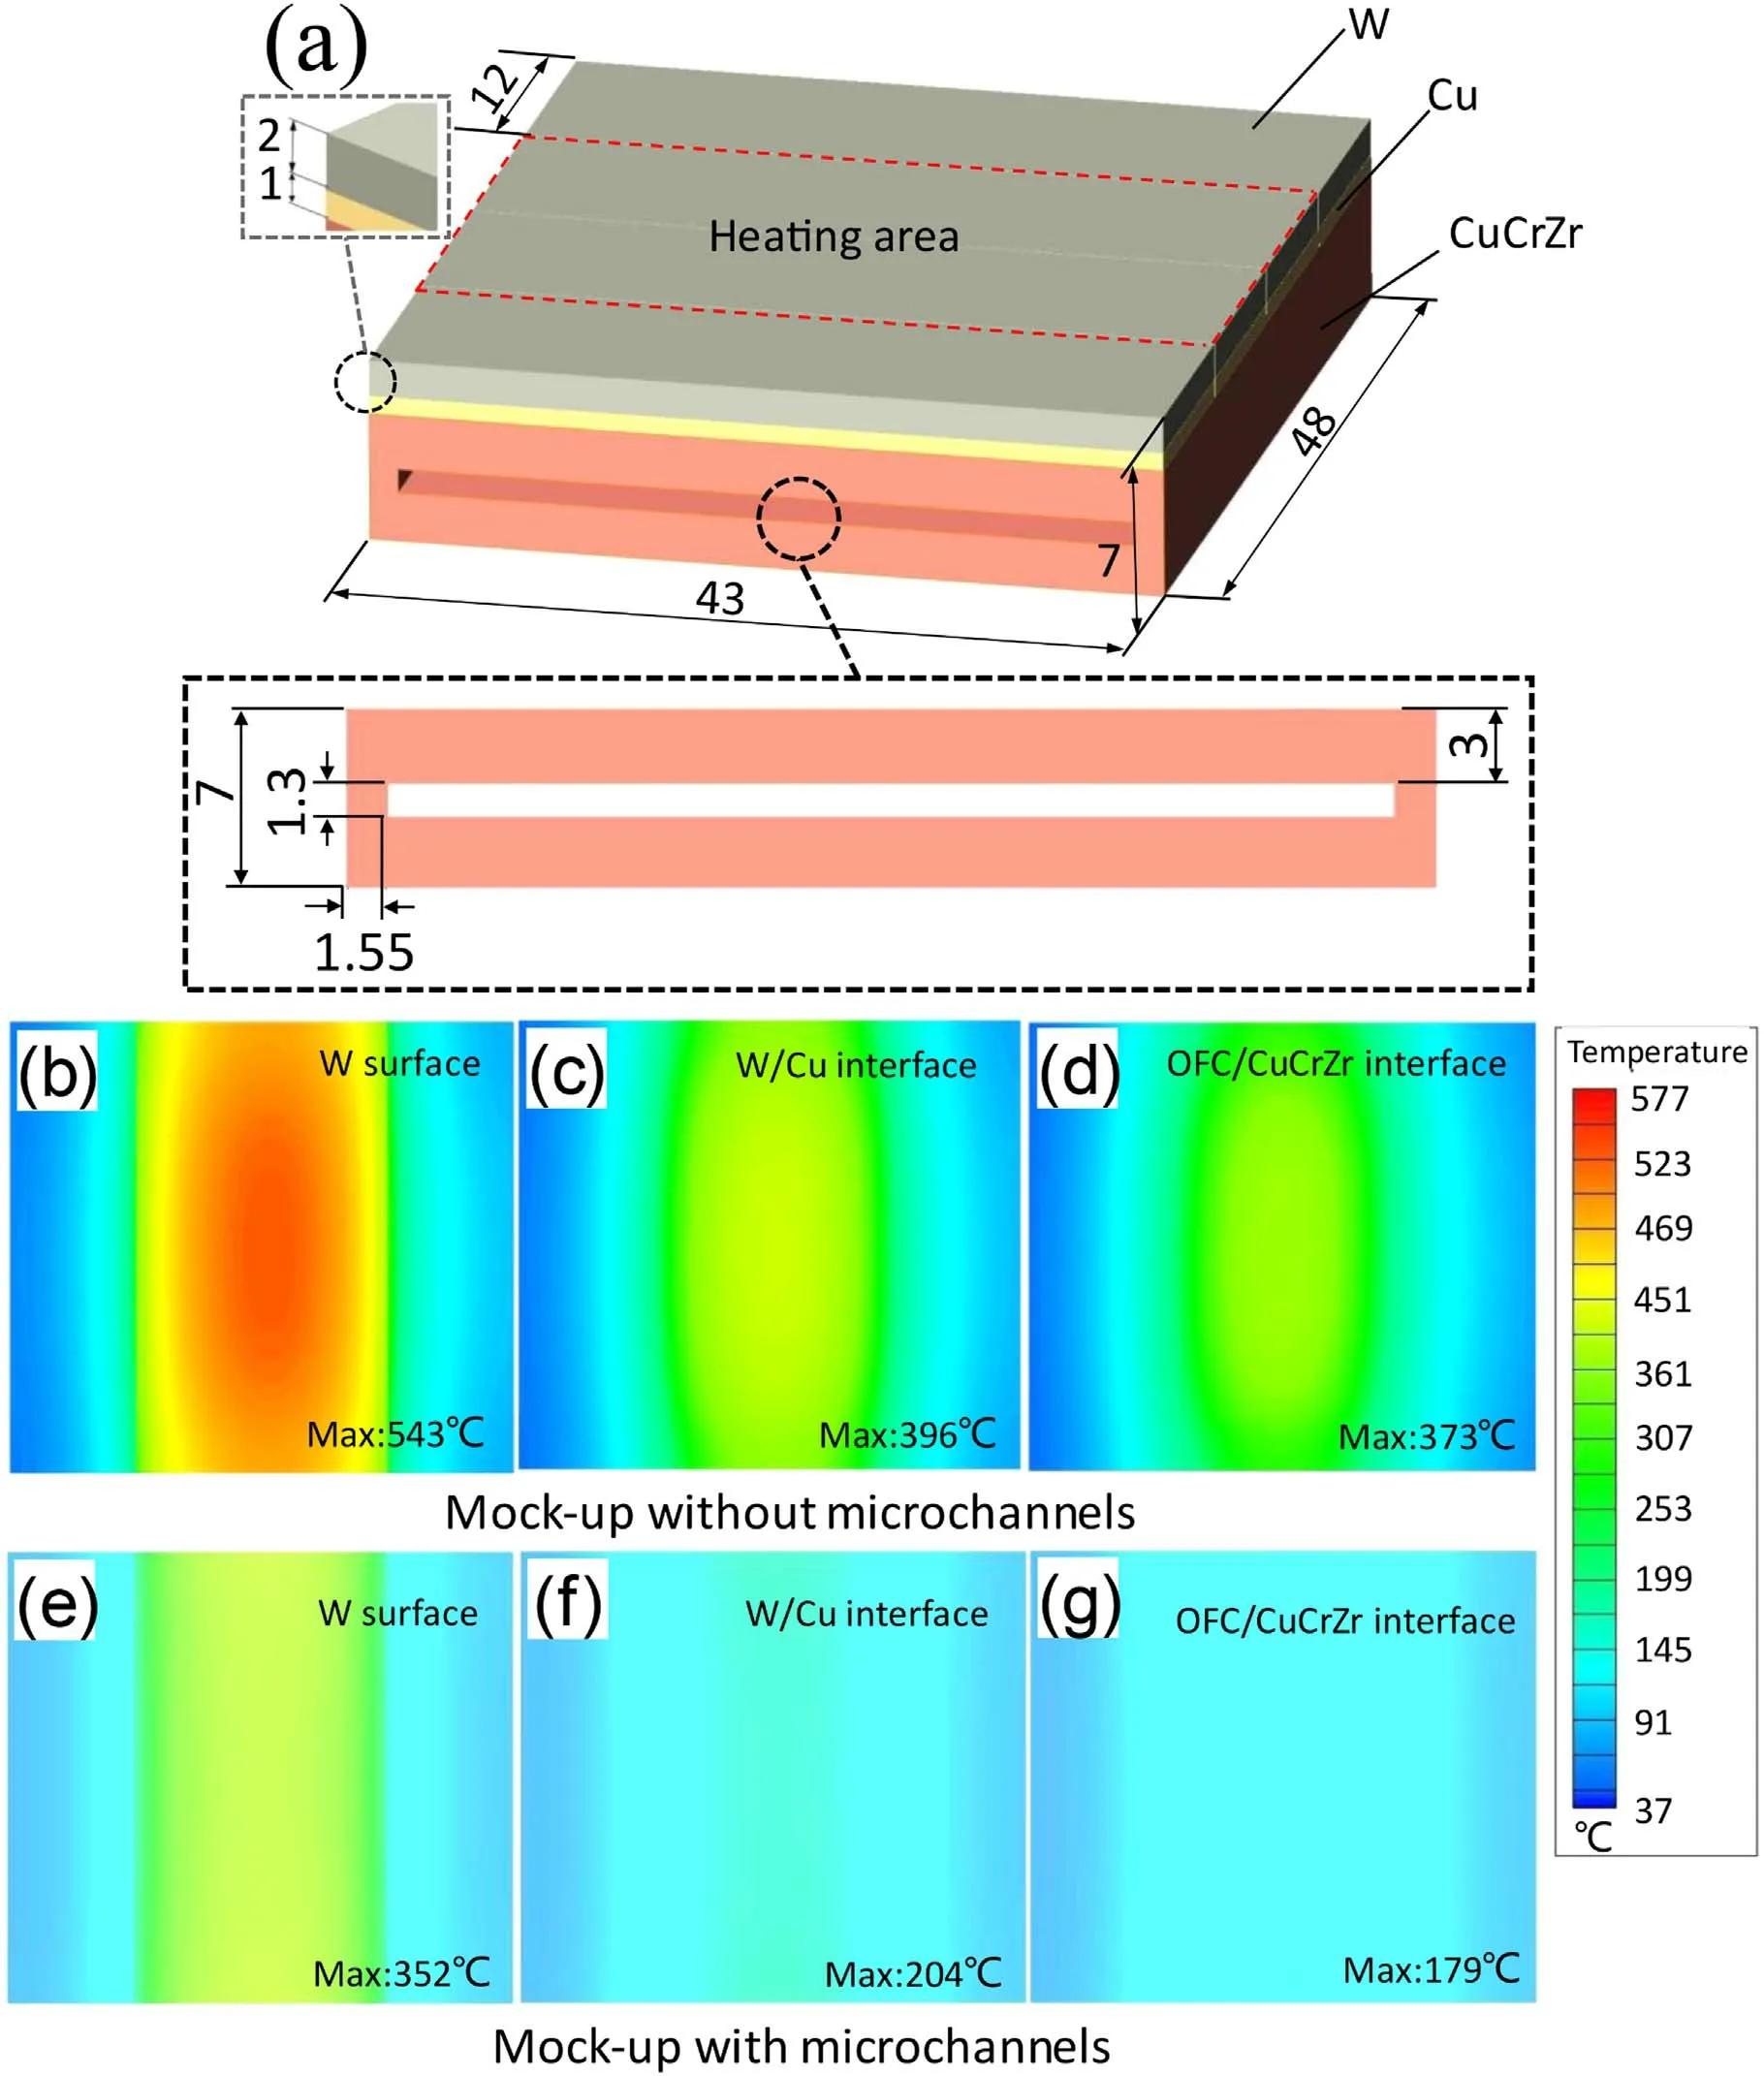
Figure 7.(a)Schematic diagram of W/Cu flat-type mock-up without a microchannel heat sink and(b)-(g)the temperature distributions of the surfaces.
During the thermal fatigue test, we found that the mockup withstood the complete thermal fatigue test of 1000 cycles at 10 MW m-2(heat-load duration of 15 s on and 15 s off)without detachment of any W/Cu tile and appearance of any‘hot spot’. The surface temperature of the mock-up was monitored and recorded by the pyrometer. Figure 8(a) shows the temperature variation at the center of the heated surface under different cycles during thermal fatigue testing.It can be seen that with the increase in the number of cycles, the maximum temperature of the W surface increases gradually.However, the maximum temperature is only 493 °C (lower than the recrystallization temperature of W,1200°C)even at the 1000th cycle[14],as shown in figure 8(b),which is close to the flat-type mock-up with the hypervapotron structure(474°C)under a heat flux of 10 MW m-2.However,the inlet flow rate of the mock-up with a microchannel(26 l min-1)is only 57% of the hypervapotron structure (46 l min-1). Generally,an increase in the flow rate can effectively enhance the heat-transfer performance of a heat sink.In this way,the heattransfer performance of the microchannel heat sink is higher than that of the hypervapotron structure, which has the same W thickness, OFC interlayer thickness and heat sink top distance from the channel thickness at the same flow rate[14].
The surface morphologies of the heat-loaded surface (W surface)before and after the thermal fatigue test are observed through the digital microscope. It can be seen that compared to the surface before the test (figure 9), some microcracks occur along the width of the mock-up on the W surface after the thermal fatigue test (top right panel of figure 10), and slightly larger microcracks appeared along the length of the mock-up at the center of the W surface (top left panel and bottom right panel of figure 10). The formation of these microcracks is ascribed to the thermal stress applied to the surface of the mock-up during the alternating heating and cooling process. The heat sink has a wall thickness of 1.55 mm at both ends(figure 2),and insufficient heat-transfer capacity of this part inevitably leads to greater thermal stress,which is concentrated in the middle of the W/Cu tile. The microcracks have a slight influence on the heat removal capability of the mock-up since the direction of the microcracks is located along the growth direction of W grains.
In order to check the bonding status of the mock-up after the thermal fatigue test, the OFC/CuCrZr interface of the mock-up before and after the test was inspected by UT. As can be seen from the UT result before the test in figure 11(a),the entire heated area is blue,and several red points appear in the edge area due to the effect of the side-wall-echo, which indicates that the bonding interface of OFC/CuCrZr of the heated area is good. After the thermal fatigue test, no defects are detected at the OFC/CuCrZr interface of the heated area in figure 11(b), which demonstrates that the bonding conditions are good after the test.
For the requirements of the EAST divertor,the maximum flow rate and allowable pressure drop are 650 m3h-1and 3 MPa,respectively[2].The PFCs can withstand heat flux of 10 MW m-2in the strike point region[3].The mock-up with a microchannel heat sink meets the requirements of the divertor of EAST for the following reasons:
(1) the maximum flow rate of the upper divertor of EAST is 650 m3h-1. If the current proposed mock-up is used in the vertical target of the divertor,the maximum flow rate inside the microchannel is ~5.2 m3h-1(86.9 l min-1), which is much larger than the flow rate we used in the thermal fatigue test (26 l min-1). This demonstrates that the design of the mock-up with a microchannel heat sink meets the cooling requirement of EAST [2, 3];(2) the maximum heat flux of the strike point on the target is 10 MW m-2for EAST steady-state operation and the poloidal length of the strike point is ~15 mm[3-5].The proposed mock-up has successfully withstood the thermal fatigue test of 1000 cycles at 10 MW m-2with a heat-loaded area of 40 mm×20 mm and the maximum temperature is only 493 °C (lower than the recrystallization temperature of W,1200°C)even at the 1000th cycle [14];(3) the pressure drop of the proposed mock-up in the thermal fatigue test is 0.35 MPa.If the total area of the strike points is composed of the proposed mock-ups,the pressure drop of the strike area is calculated to be ~0.52 MPa,[3].Since one divertor module has two strike areas on the inner and outer targets, and two divertor modules are connected in series in a cooling loop. Thus, the pressure drop of the entire microchannel heat sink is 2.1 MPa,which does not exceed the maximum allowable pressure drop(3 MPa)of the upper divertor of EAST [2].
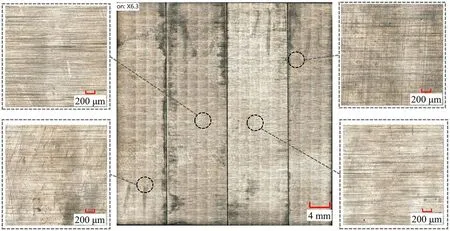
Figure 9. Microscope images of the W surface before the thermal fatigue test.
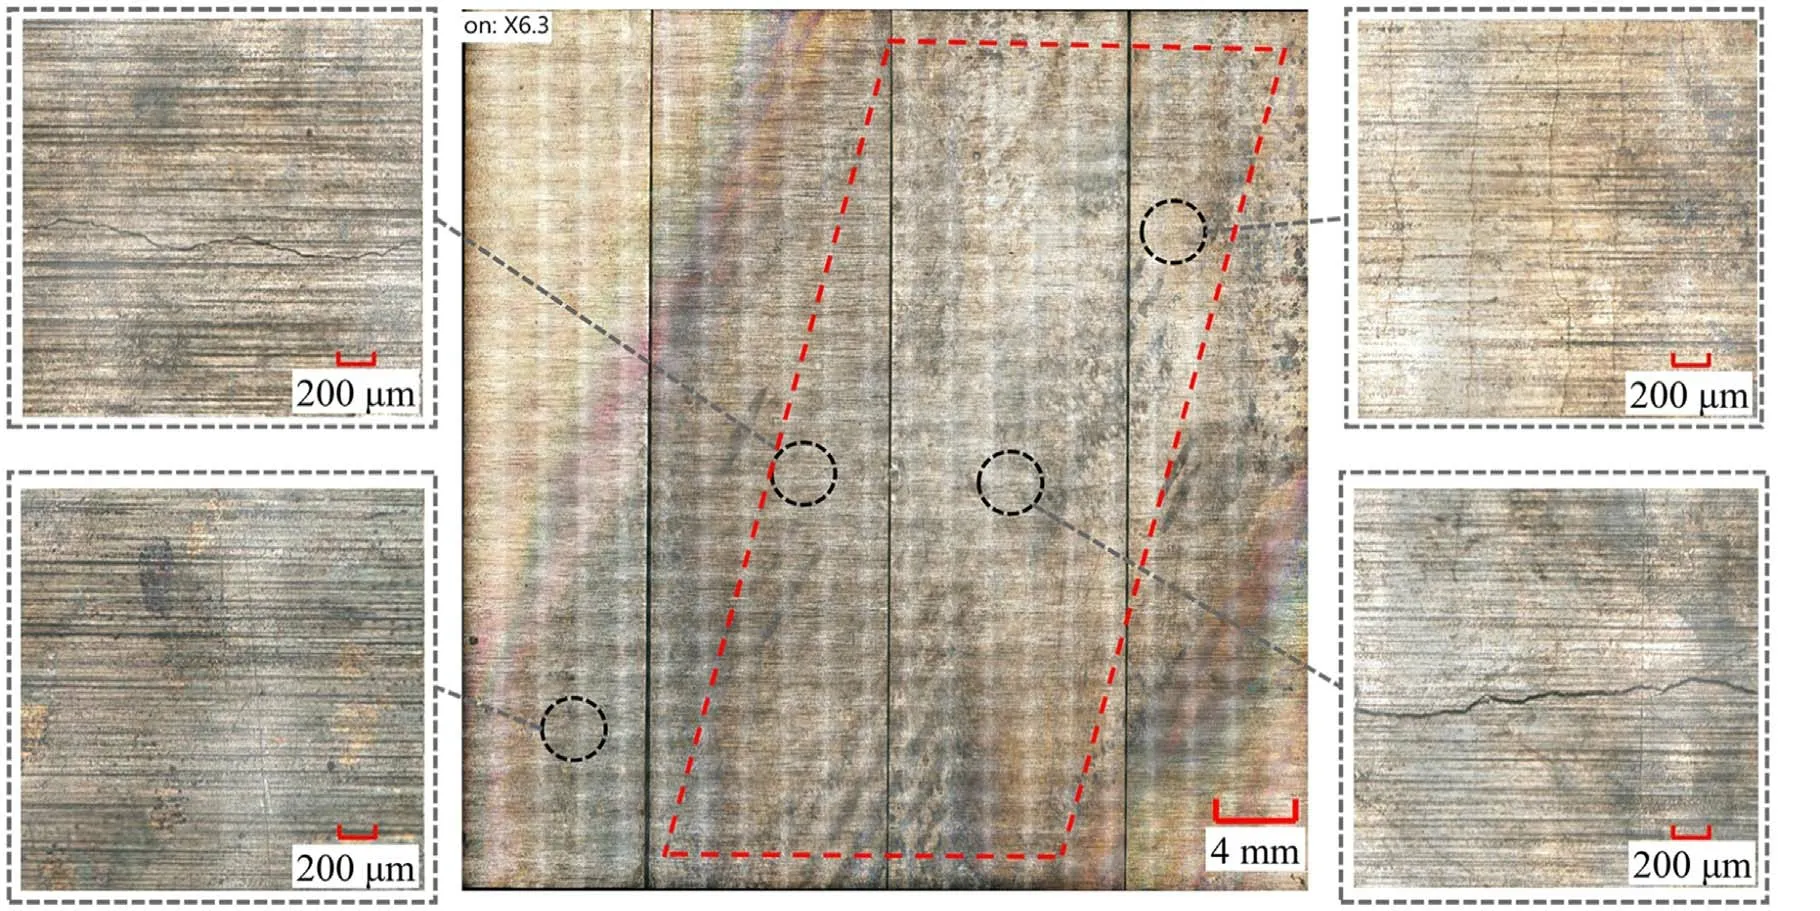
Figure 10.Microscope images of the W surface after the thermal fatigue test.
4. Conclusion
The present study came up with high-performance W/Cu flattype PFCs cooled by an open microchannel heat sink to meet the urgent demand for HHF dissipation with a low inlet flow rate of the divertor. The performance of the mock-up was evaluated via a steady-state HHF test and thermal fatigue test.The heat-transfer capacity of the heat sink is enhanced by an increase in the volume flow rate, and the maximum absorbed heat flux of the microchannel heat sink tested in this work was 11.4 MW m-2(not the CHF) at a low inlet flow rate of 9 l min-1. Under this heat flux, the microchannel heat sink exhibited good temperature uniformity, and the flow pattern in the microchannel was still dominated by single-phase flow.The mock-up successfully withstands the thermal fatigue test of 1000 cycles of 10 MW m-2without detachment of any W/Cu tile and appearance of any ‘hot spot’, and the maximum temperature on the W surface of the mock-up was only 493°C.There was no other damage on the W surface except for some longitudinal microcracks, and the OFC/CuCrZr interface was well bonded after the thermal fatigue test. The W/Cu flattype mock-up cooled by microchannels enables high heat dissipation performance, good temperature uniformity, low inlet flow rate demand and low W surface temperature.This concept of integrating a microchannel heat sink into the mock-up may provide important insight into the future design of the target of the divertor so that it will withstand greater heat load.
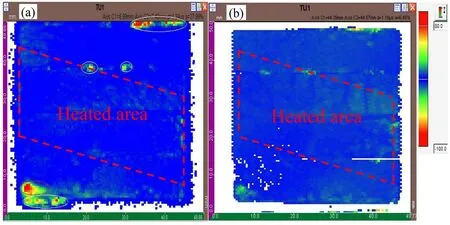
Figure 11. UT results of OFC/CuCrZr interface of mock-up before (a) and after (b) the thermal fatigue test.
Acknowledgments
The authors acknowledge financial support from the National MCF Energy R&D Program (No. 2018YFE0312300), National Natural Science Foundation of China(No.51706100),the Natural Science Foundation of Jiangsu Province (No. BK20180477)and Fundamental Research Funds for the Central Universities(No. 30918011205).
 Plasma Science and Technology2022年9期
- Plasma Science and Technology的其它文章
- Experimental study on surface arc plasma actuation-based hypersonic boundary layer transition flow control
- Development of a compact high-density blue core helicon plasma device under 2000 G magnetic field of ring permanent magnets
- Improvement of the spreading effect of atmospheric pressure microplasma jet treatment through shielding-gas-controlled focusing
- Efficient direction-independent fog harvesting using a corona discharge device with a multi-electrode structure
- Development of the pellet injection system on the J-TEXT tokamak
- Implementation and application of PyNE sub-voxel R2S for shutdown dose rate analysis