
Effect of Using Land Use Data with Building Characteristics on Urban Weather Simulations: A High Temperature Event in Shanghai
2023-01-16 12:06DahuYANGYongweiWANGandCaijunYUE
Dahu YANG, Yongwei WANG*, and Caijun YUE
1 School of Atmospheric Physics, Nanjing University of Information Science & Technology, Nanjing 210044
2 Shanghai Marine Meteorological Center, Shanghai 200030
ABSTRACT
Key words: local climate zone, Weather Research and Forecasting model, characteristics of building parameters,high temperature
1. Introduction
Numerical models are significant in the study of urban climate. Land use data, as the lower boundary condition in numerical modeling, are related to regional atmospheric circulation (Li et al., 2019), urban energy balance,boundary layer structures (Miao et al., 2009), air pollution (Shi et al., 2019), and climatic change (Findell et al.,2017). With the increasing demand for the accuracy and refinement of urban weather forecasts, the roughness and two-dimensional (2D) traditional land use data can no longer meet the needs of fine-scale numerical simulations. The heterogeneity of urban underlying surfaces requires numerical simulation coupled with fine 3D building data. Hence, land use data that resolve accurate urban morphology parameters are important for refined numerical simulations.
By using the concept of the local climate zone (LCZ),which was developed by Stewart and Oke (2012), the urban landscape can be categorized into 17 local-scale zones based on the physical properties of land cover and surface geometry. Each zone is unique to individual urban landscapes and spans a horizontal distance of a few hundred to a few thousand meters, within which the meteorological elements are considered to be uniformly distributed. There are differences in the urban form reflected by different zones. LCZ land use data are not only refined but can also reflect the differences in urban morphology.However, the traditional and coarse land use data used in the numerical model [such as Moderate-resolution Imaging Spectroradiometer (MODIS), United States Geological Survey (USGS), and Coordination of Information on the Environment (CORINE)] match a single classification of urban building parameters. Previous research shows that LCZ land use data used in the Weather Research and Forecasting (WRF) model have a better performance in simulating urban thermal environments and rainfall (Brousse et al., 2016; Mu et al., 2020; Patel et al.,2020; Liang et al., 2021). Mu et al. (2020) found that LCZ land use data have a better performance in simulating urban heat flux than USGS land use data, which may be related to the percentage of impermeable surfaces matched by the USGS having larger values, reducing vegetation transpiration, underestimating latent heat release from the city, and affecting the surface heat flux distribution. Liang et al. (2021) found that both LCZ and MODIS overestimate the value of 2-m temperature at night, but LCZ land use data reflect the urban surface characteristics and more accurately reproduce the spatial variability of surface temperature. Brousse et al. (2016)found that coarse CORINE land use data overestimate the urban area, and LCZ land use data improve the simulation of 2-m temperature during summer and winter seasons. Patel et al. (2020) found that LCZ land use data have a better performance in simulating rainfall accumulation and the severe convection field compared to MODIS, which may be related to the heterogeneity of the urban underlying surface reflected in LCZ land use data.
The above studies focused on discussing thermal meteorological elements and improving the simulation of 2-m temperature and urban heat flux. However, there are no studies about the impacts of urban morphologic parameters on the radiation energy budget and energy balance,and discussion about the influence mechanism of urban canopy parameters on dynamic meteorological elements(such as wind speed and turbulent kinetic energy) is also very lacking. Moreover, LCZ land use data resolve urban morphology using complex classes of building parameters compared to the traditional land use data used in numerical models, which causes an increase in the heterogeneity of urban underlying surfaces. The jaggedness of buildings affects the radiation energy budget and the kinetic energy of the atmosphere. Hence, the morphological differences of buildings and the resulting effects on thermal and dynamic elements are worth studying.Studying the impacts of the heterogeneity of urban morphology on surface meteorological elements requires the use of accurate urban canopy parameters in numerical models. Previous studies have shown that better simulation results can be obtained by using accurate urban morphologic parameters (Salamanca et al., 2011; Ching et al., 2018; Hammerberg et al., 2018; Wong et al.,2019). Zonato et al. (2020) found that a correct definition of urban morphology has been identified as crucial for enhancing model performance. The existing modeling settings of LCZ land use data have greatly improved the reproduction of urban morphology. However, Sun et al. (2021) found that the height of buildings in Chinese megacities is high, which is mismatched with the default parameters used in the WRF model that have an inaccurate description at the city scale, and the building height parameter has a large interval range that is difficult to obtain according to the theory of Stewart and Oke (2012).Hence, accurate building height parameters also play an important role in this study.
To meet the needs of social and economic development, refined numerical weather forecasting will be needed by various industries. However, studies on the refined land use data used in numerical models have rarely been conducted. Shanghai, the largest megacity in China,has the highest urbanization rate and the tallest and most jagged buildings among the provinces in China (Wu et al., 2019). Moreover, extreme heat weather is a typical type of disaster weather in Shanghai. In this study, an extreme heat event in Shanghai, China, was simulated by using a WRF/BEP + BEM (Building Effect Parameterization + Building Energy Model) model. We incorporated LCZ land use data that resolve urban morphology using 10 classes of building parameters based on actual building data derived for Shanghai. Through comparison to a control case based on MODIS land use data, the impacts of the heterogeneity of the urban underlying surface used in the WRF model on near-surface thermal and dynamic meteorological elements during a high-temperature event in Shanghai were revealed. The paper is organized as follows: a detailed description of the LCZ land use data, observation data, modeling setup, and urban canopy parameters is presented in Section 2, followed by the model validation in Section 3, analysis and discussion of the results in Section 4, and conclusions in Section 5.
2. Data and methods
In this study, the data used included (1) LCZ land use data, which were created by the method of Bechtel et al.(2015), through the process of sampling, resampling and classification based on Landsat 8 satellite data at 30-m resolution; (2) building data used in the theory of Sun et al. (2021), which converts the number of floors (source from the Resource and Environmental Science and Data Center, available online at https://www.resdc.cn/) to the building height; (3) hourly 2-m air temperature and 10-m wind field data observed by 55 automated weather stations (AWSs) in Shanghai, which were used for the model validation; and (4) ERA5 reanalysis data (0.25 × 0.25°and 1 h) that were used for the validation of land?sea thermal contrast and the assessment of the sea breeze.
2.1 Creating and evaluating LCZ land use data
In this study, we created LCZ land use data through the WUDAPT (World Urban Database and Access Portal Tools) level 0 method (Bechtel et al., 2015). Specifically,this method involves the following steps:
1) Preparing Landsat 8 satellite data
The region of the urban area was defined, and the Landsat 8 satellite data at 30-m resolution (less than 3%cloud cover) was downloaded.
2) Creating training samples in Google Earth software
According to the theory of Stewart and Oke (2012),polygon samples were boxed for each LCZ land use classification using Google Earth software, with each LCZ land use classification containing approximately 10–100 polygon samples. The training samples were created by the largest homogeneous area in the city as much as possible to ensure that the minimum side length of each sample was greater than 200 m. Moreover, a buffer of 100 m was left between each sample, and as many training samples as possible were taken to fully describe the urban morphology. Finally, the number of samples that we selected was 800.
3) Generating LCZ land use data
The Landsat 8 satellite data at 30-m resolution were resampled to a resolution of 120 m using SAGA GIS software, and the LCZ land use data were resampled by using the random forest classification algorithm implemented in SAGA GIS software. The generated LCZ land use data contained latitude and longitude information and the corresponding land use information with a spatial resolution of 120 m.
4) Evaluating the accuracy of LCZ land use data
The accuracy of the LCZ land use data is evaluated based on the method developed by Cai et al. (2018). This method is mainly based on using Google Earth software to evaluate the accuracy of the LCZ land use data. Specifically, 0.5% of cells in the LCZ land use data are compared with remote sensing images from Google Earth software, and the accuracy (Acc) of the LCZ land use data is calculated in Eq. (1). Finally, we obtained data with 73% accuracy, which is sufficient enough to be input into the WRF model.
whereNtis the number of 0.5% cells matched with the true underlying surface andNLCZis the total number of 0.5% cells in LCZ land use data.
5) Incorporating LCZ land use data into the WRF model
The LCZ land use data were extracted from the generated LCZ land use data and converted into grid format data, and further interpolation was required based on the grid resolution of the WRF model. The interpolation tool was obtained from the official website of WUDAPT(https://www.wudapt.org/), which was used for analyzing each grid corresponding to the LCZ land use classification.
2.2 Urban canopy parameters
In this study, urban canopy parameters were used to match each land-use type. The default land use data(such as the MODIS land use data) used in the WRF model had an inaccurate description at the city scale, and its urban canopy parameters originated from the urban canopy parameters file (URBPARM.TBL) in the WRF model.
LCZ land use data that resolved urban morphology using 10 classes of building parameters were attained by the researchers. In this study, we incorporated building height, street width, and impervious surface ratio for each LCZ land use classification according to the study of Stewart and Oke (2012). However, the building height parameter had a large interval range that was difficult to assess.
Hence, we incorporated the building height based on the theory of Sun et al. (2021), which converts the number of floors (source from the Resource and Environmental Science and Data Center, available online at https://www.resdc.cn/) to the building height. After this step, we obtained data containing latitude and longitude information and the corresponding building height information. This data were further matched with the WRF grid to obtain the building height information available for each LCZ land use classification. Moreover, other building parameters (such as the impervious surface ratio and street width) were selected based on the study of Stewart and Oke (2012). These parameters matched with LCZ land use data are shown in Table 1.

Table 1. Building parameters of different land-use types for the urban area
2.3 Research object and verification data
In this study, a high-temperature event from 0800 BT(Beijing Time) 28 to 0800 BT 31 July 2013 over the megacity of Shanghai was selected. During this period,the Yangtze River Delta region was under the continuous influence of the western Pacific subtropical high,with extreme and persistent high-temperature weather(Wu et al., 2020).
The hourly 2-m air temperature and 10-m wind field observed by 55 AWSs in Shanghai were used to evaluate the performance of the WRF simulations. Strict quality control and checks were conducted, including those regarding time inconsistency and extreme values. The observational data were qualified with a missing measurement rate of 4%. Spatially, the locations where the observations originated were divided according to LCZ land use classification. In the division process, LCZ7,LCZ8, and LCZ10 were missing, which will not be discussed in the later model validation discussion. To facilitate comparisons between the model results and observations, we interpolated the WRF grid cell outputs to the geographical locations of the AWSs based on the nearest distance.
Moreover, in coastal areas under high-temperature events, land warming may result in the appearance of sea breezes. ERA5 reanalysis data (0.25 × 0.25° and 1 h)were used for the validation of land?sea thermal variations and sea breeze assessment.
2.4 Model settings
In this study, LCZ land use data were used in the WRF(V3.9.1) model for a simulation referred to as the LCZ case. Moreover, the 2010 modified IGBP (International Geosphere-Biosphere Program) MODIS LULC (Land Use and Land Cover) (15 arc seconds) data were used for comparison, which is referred to as the MODIS case.Both simulations had the same settings, and the simulations were conducted from 0800 BT 28 to 0800 BT 31 July 2013. As shown in Fig. 1a, the simulations consisted of 3 nested domains centered at the center of Shanghai, which were configured with grid spacings of 9, 3, and 1 km. There were 66 × 70, 103 × 103, and 109× 121 horizontal grids for the three domains, and the innermost domain covered the main area of Shanghai. In the vertical direction, 53 terrain-following sigma levels from the surface up to 50 hPa were used. The model initial and boundary conditions were provided from the ERA5 reanalysis data with horizontal and temporal resolutions of 0.25° and 6 h. In regard to the physics schemes,the longwave and shortwave radiation scheme was the Rapid Radiative Transfer Model for GCMs (RRTMG)scheme (Iacono et al., 2008), the microphysics scheme was the New Thompson scheme (Thompson et al., 2008),the cumulus convective scheme was the Grell–Devenyi scheme (Grell and Dévényi, 2002), the planetary boundary layer scheme was the MYJ scheme (Janji?, 1994), the land surface scheme was the Noah scheme (Chen and Dudhia, 2001), and the urban scheme was the BEP +BEM scheme (Salamanca and Martilli, 2010). The spatial distribution of the land use data is shown in Figs. 1b,c. It can be seen that the urban area was larger in the LCZ case, and the heterogeneity of the LCZ case significantly improved.

Fig. 1. Land-use types for the triple nesting of the WRF simulations and the underlying of d03. (a) d01, d02, and d03 simulation areas and terrain height (m), (b) d03 land-use types of MODIS (the black hollow circle represents the stations), and (c) d03 land-use types of LCZ (the solid black line represents the vertical section position).
Moreover, the air conditioning systems of LCZ1,LCZ2, and LCZ4 were supposed to be turned on during the daytime (0800?1900 BT), while the air conditioning systems of the other LCZ land use classification and the MODIS case were supposed to be turned on all day.Moreover, other settings for the air conditioning systems were referenced by the study of Ribeiro et al. (2021),such as a target temperature of 25°C and a comfort range of 0.5°C.
2.5 Definition of the level of heterogeneity of the LCZ
The traditional geographical data used in the numerical model (such as MODIS, USGS, and CORINE) match a single classification of urban building parameters, and the buildings are not jagged. In contrast, the jaggedness of the buildings reflected in LCZ land use data may affect the radiation budget and atmospheric kinetic energy in urban areas, resulting in impacts on the near-surface thermal and dynamical meteorological elements.
To quantify the above impact, in this study, we defined the concept of the level of heterogeneity of the LCZ land use data and a corresponding calculation method.Briefly, the level of heterogeneity of the LCZ land use data was calculated by using the building height parameters in d03. According to the theory of Stewart and Oke(2012), each zone of LCZ land use data is unique to an urban landscape and spans a horizontal distance of a few hundred to a few thousand meters. Hence, we calculated based on a horizontal range of 3 km × 3 km, 5 km × 5 km, 7 km × 7 km, and 9 km × 9 km in d03, which reflects that each grid in d03 is linked to its surrounding grids, and the jaggedness of the buildings will be reflected in a region comprising several grids.
Taking the horizontal range of 3 km × 3 km as an example, assuming that the building height of a grid ish0and the building height of its surrounding grids ishi(i∈[1,8]), the building height variance was calculated with Eq. (2).

For statistical purposes, we calculated the normalized building height varianceF0by using the method of min–max normalization as shown in Eq. (3), wherefmaxandfminare the maximum and minimum values of the building height variance in d03, respectively. Finally, we determined the level of heterogeneity according to the value ofF0, and the level of heterogeneity is expressed asS, as shown in Table 2.

Table 2. Normalized building height variance and the corresponding levels of heterogeneity

3. Model validation
The simulated 2-m temperature and 10-m wind speed from the two experiments (LCZ and MODIS) were compared with the observation data shown in Fig. 2. In regard to the 10-m wind speed, the simulated hourly 10-m wind speed was consistently higher than that observed,which may be related to the uncertainty of the urban canopy parameters (UCPs) and momentum exchange parameters (MEPs) used in the WRF model (Li et al., 2021).Optimizing the building heights can only improve the simulated 10-m wind speed. It can be seen that the simulated LCZ case had a better performance than the MOD-IS case, and the error was reduced.

Fig. 2. Three-day hour-by-hour comparisons of simulated and observed 10-m wind speed (W10m; m s?1) and 2-m temperature (T2m; °C) from 0800 BT 28 to 0800 BT 31 July 2013. (a, b) LCZ1, (c, d) LCZ2, (e, f) LCZ3, (g, h) LCZ4, (i, j) LCZ5, and (k, l) LCZ6.
For LCZ1, LCZ2, LCZ4, and LCZ5, the model generally captured the diurnal pattern of the 10-m wind speed well for the two experiments. Moreover, the LCZ case performed better, and its RMSE (0.76–1.03 m s?1) was lower than that of the MODIS case (1.24–1.99 m s?1).The wind speed decreased by 1.4, 0.7, 0.9, and 0.6 m s?1in the daytime (0800–1900 BT) and by 0.7, 0.5, 0.6, and 0.2 m s?1at nighttime (from 2000 BT until the next day at 0700 BT). For LCZ3 and LCZ6, it can be seen that there was almost no difference in the simulated values.Table 1 shows that the grids of LCZ1, LCZ2, LCZ4, and LCZ5 accounted for 10%, 21%, 27%, and 17% of the building grids in d03, while LCZ3 and LCZ6 accounted for only 5% and 13%, respectively, and a majority of the better results indicated that the LCZ case performs better.
The above results were obtained because the LCZ case reflects the true building heights in urban morphology.According to Table 1, the building heights in LCZ1,LCZ2, LCZ4, and LCZ5 were mostly between 30 and 60 m, which are significantly higher than those in MODIS,resulting in greater obstruction and dragging effects on the wind. For LCZ3 and LCZ6, the building heights were close to those of MODIS, resulting in no difference in the simulated values. Moreover, the obstruction and dragging effects were stronger during the daytime, which may be related to the higher background wind speed.
In regard to the simulated 2-m temperature, the model generally captured the diurnal pattern of the 2-m temperature well for the two experiments. Moreover, both experiments performed well in the daytime, while the values of the LCZ case were higher than those observed at nighttime, which may be related to the heating effect of building parameters. High-rise buildings produce two effects on radiation processes (trapping and shadowing),warming the air by trapping radiation in the urban canyon. Generally, this trapping effect can be divided into multiple reflections of shortwave radiation in the daytime and multiple reflections of longwave radiation at nighttime. This warming effect is partially offset by the cooling effect of building shadows in the day, while it is more significant at nighttime due to the disappearance of shadowing. Moreover, the energy will be stored due to the decrease in wind speed at night. Furthermore, the net radiation received by the surface will be mainly converted into sensible heat flux and latent heat flux, and the remaining will be stored in buildings to warm the air at night. However, the warming effect at night described above does not result in a significant increase in the 2-m temperature, which instead may be related to the heat release from the larger exothermic surfaces of high-rise buildings, causing more heat compensation from the bottom of the buildings and offsetting part of the warming effect.
4. Results
4.1 Impacts of LCZ land use classification on meteorological elements
The WRF model coupled with LCZ land use data affected the features of the urban underlying surface. The average diurnal variations in surface energy balance components and meteorological factors for different land-use types are shown in Fig. 3. Generally, it can be seen that the radiation budget and energy balance changed immediately, which means that the changes in near-surface temperature and humidity are very important. The wind speed and turbulence kinetic energy are also affected by frictional and dragging effects.
The differences in building heights obviously affected the upward radiation component. According to the building height parameters in Table 1, the LCZ land use classification is divided into two groups: high-rise buildings(LCZ1, LCZ2, LCZ4, and LCZ5) and low-rise buildings(LCZ3, LCZ6, LCZ7, LCZ8, and LCZ10). The upward shortwave radiation component of high-rise buildings is on average 15 W m?2lower than that of low-rise buildings in the daytime (0800–1900 BT) (Fig. 3a), which may be related to the stronger trapping effect of high-rise buildings on the radiation process of upward shortwave radiation. The upward longwave radiation component of high-rise buildings is on average 10 W m?2higher than that of low-rise buildings at nighttime (2000–0700 BT)(Fig. 3b), which may be related to the larger exothermic surfaces of high-rise buildings described in Section 3.For the MODIS case, the building heights and the radiation budget are similar to those of low-rise buildings.
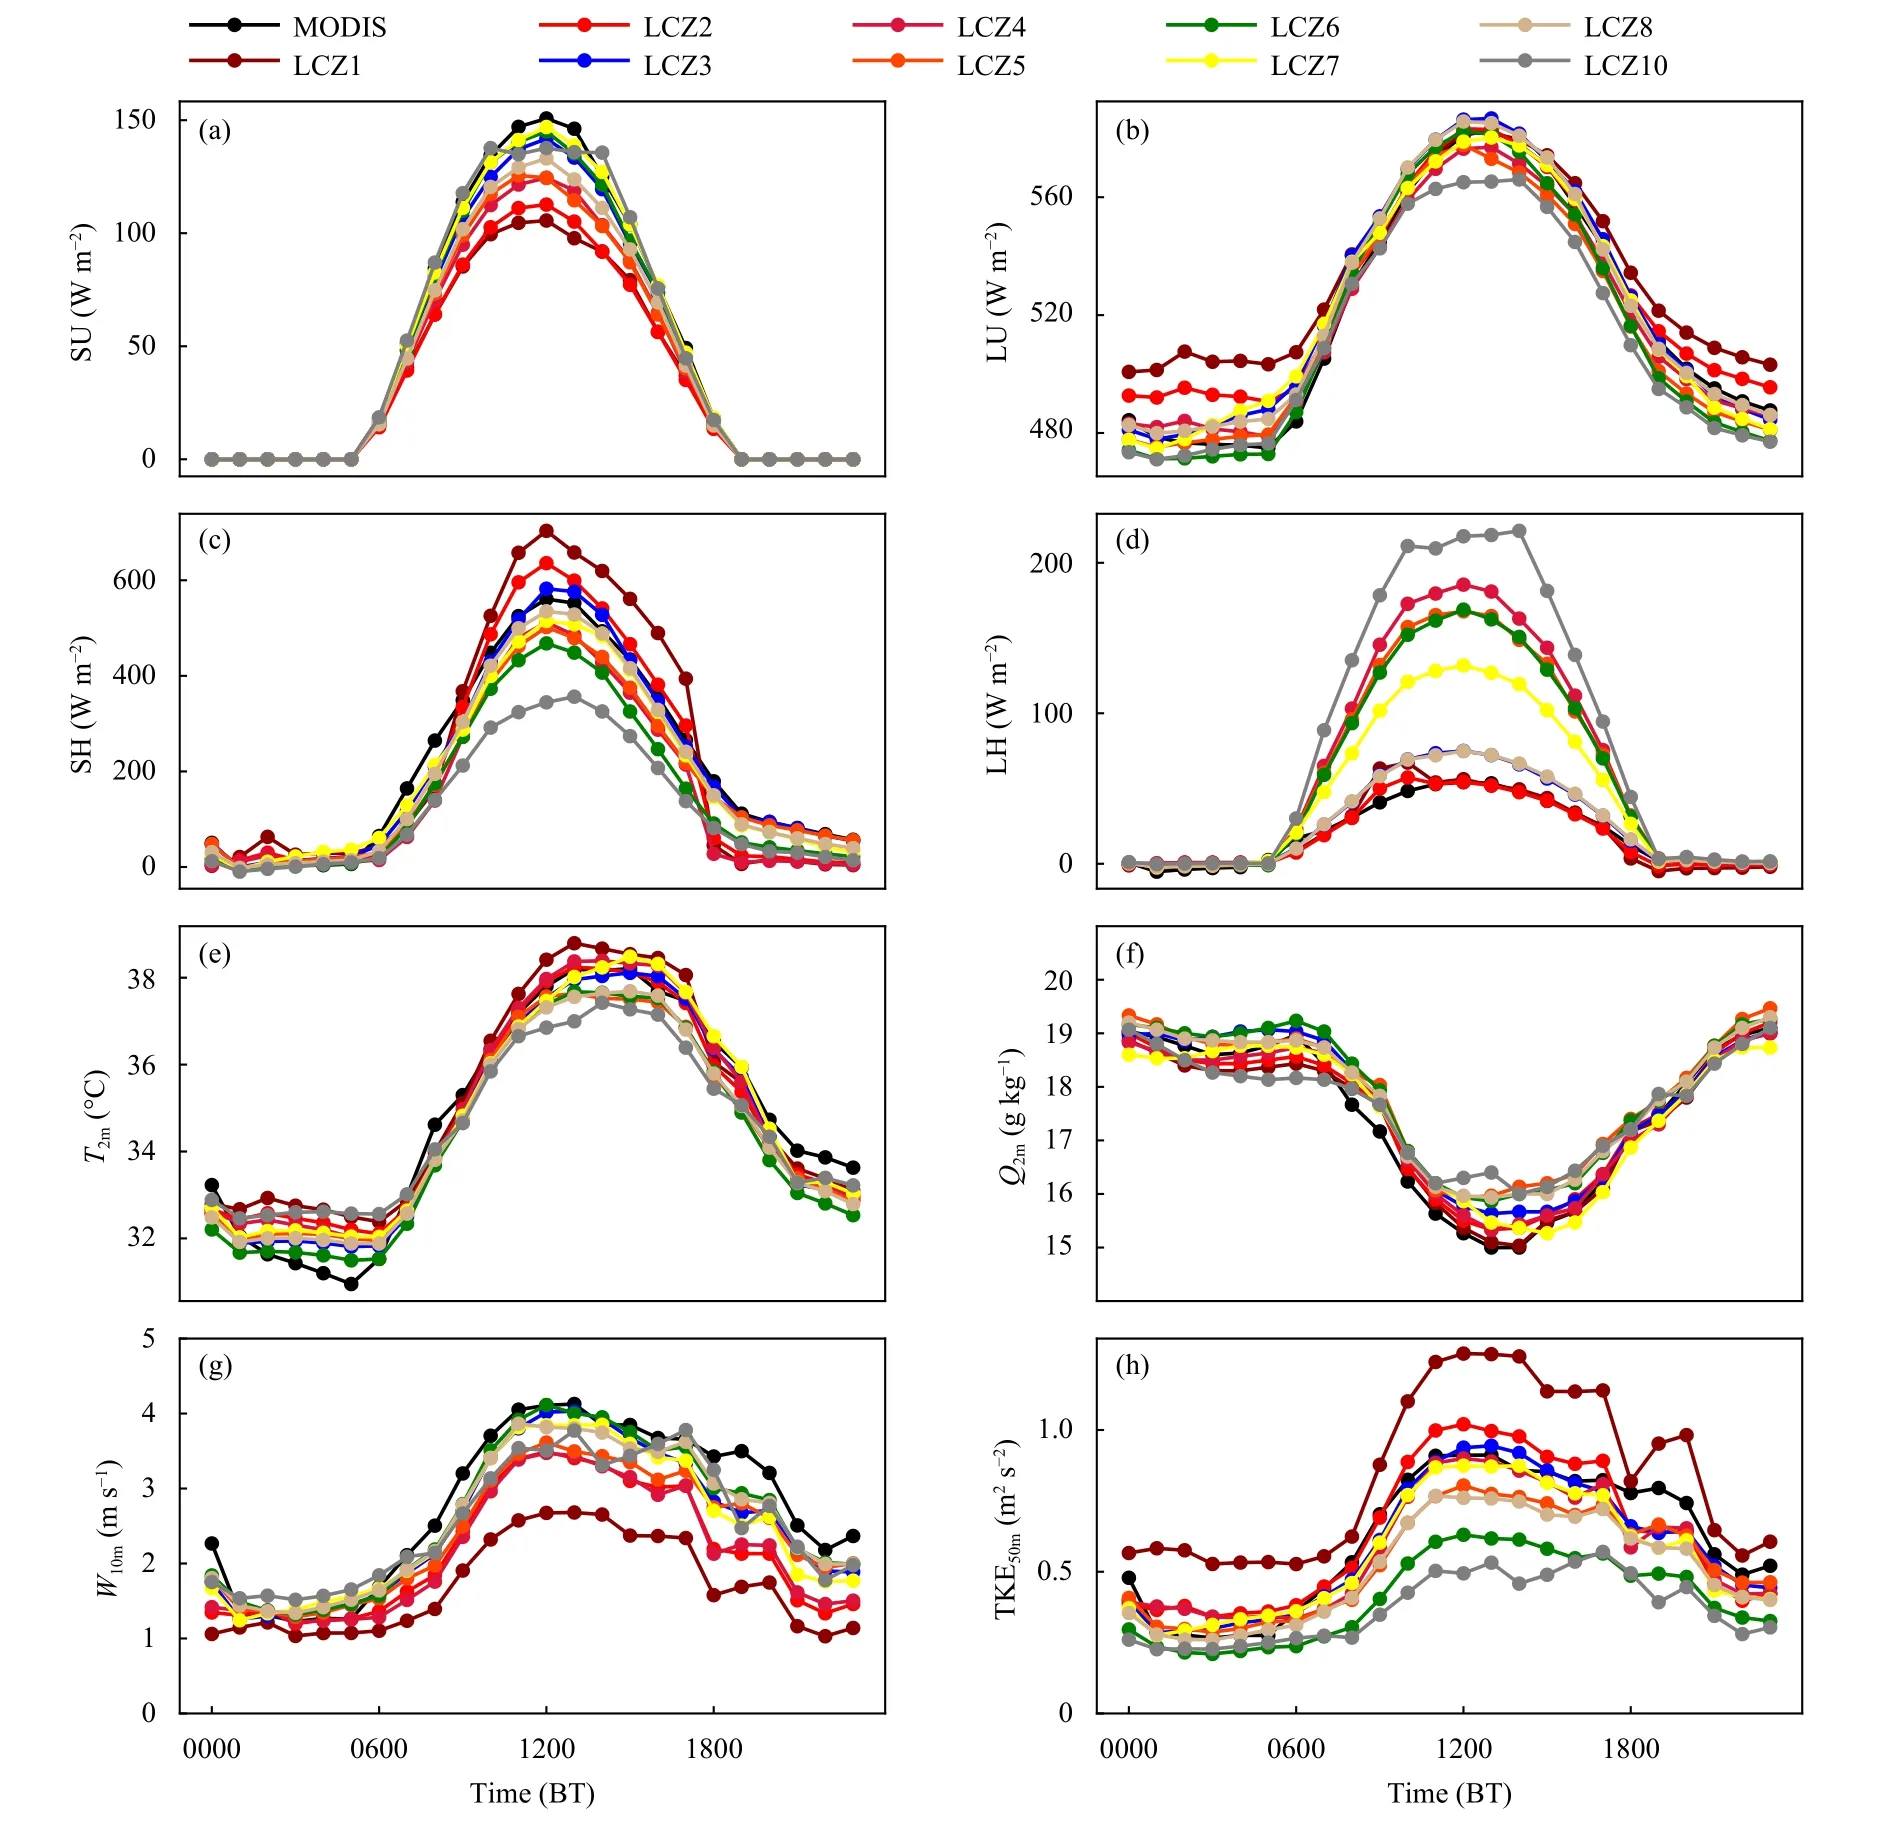
Fig. 3. Average diurnal variations in surface energy balance components and meteorological factors for different land-use types. (a) SU(W m?2), (b) LU (W m?2), (c) SH (W m?2), (d) LH (W m?2), (e) T2m (°C), (f) Q2m (g kg?1), (g) W10m (m s?1), and (h) TKE50m (m2 s?2).
It can also be seen that the differences in the impervious surface ratio obviously affected the sensible and latent heat flux distributions in the daytime. According to the impervious surface ratio parameters in Table 1, the LCZ land use classification is divided into two groups:highly impervious surfaces (LCZ1, LCZ2, and LCZ3)and weakly impervious surfaces (LCZ4, LCZ5, LCZ6,LCZ7, LCZ8, and LCZ10). The sensible heat flux of high-rise buildings is on average 95 W m?2higher than that of lowly impervious surfaces in the daytime(0800–1900 BT) (Figs. 3c, d), while the latent heat flux is on average 67 W m?2lower. This is because the percentage of impermeable surfaces matched by highly impervious surfaces is larger, reducing vegetation transpiration, underestimating latent heat release from the city,and affecting the surface heat flux distributions. For the MODIS case, the impervious surface ratio and the surface heat flux distributions are similar to those of the highly impervious surface.
Further analysis is conducted on the diurnal variations in 2-m temperature and 2-m specific humidity (Figs. 3e,f). The 2-m temperature is increased by 0.8°C at night but only by 0.4°C in the daytime by comparing LCZ1 and LCZ2 with other land-use types, which may be due to the warming effect described in Section 3 being partially offset by the cooling effect of building shadows in the daytime. Moreover, the 2-m specific humidity of lowly impervious surfaces is 0.2–0.4 g kg?1higher than that of other land-use types, which is also due to the higher latent heat flux. For the MODIS case, the building height is 15 m, and the impervious surface ratio is 0.9, causing the 2-m specific humidity to be lower than that of other land-use types, and the 2-m temperature is similar to that of low high-rise buildings.
Furthermore, the differences in building heights are important for determining the 10-m wind speed and 50-m turbulence kinetic energy. The 10-m wind speed of highrise buildings is on average 0.6 m s?1lower than that of low-rise buildings in the daytime (Fig. 3g), while the 50-m turbulence kinetic energy is on average 0.2 m2s?2higher (Fig. 3h), which may be related to the stronger mechanical and thermal turbulence of high-rise buildings due to the thermal and dynamic effects. Also, the obstruction and dragging effects are stronger during the daytime and weakened at nighttime, which may be related to the background wind speed.
Fig. 4. Impact of the heterogeneity level on meteorological factors (a, c, e, g) in the daytime and (b, d, f, h) at nighttime: (a, b) 2-m temperature,(c, d) surface net radiation, (e, f) 10-m wind speed, and (g, h) 50-m TKE. The meteorological factors are the LCZ-based results in reference to the MODIS-based results. The difference values are then averaged for each heterogeneity level, and different colors represent the heterogeneity level based on different spatial resolutions: red (3 km), blue (5 km), green (7 km), and yellow (9 km).
4.2 Impact of the level of heterogeneity on meteorological factors
The jaggedness of the buildings reflected in the LCZ land use data may affect the near-surface meteorological elements. According to Table 2, when theSlevel is 1, the values of the normalized building height variance fall in the range of 0–0.1, which indicates the low heterogeneity of urban areas. AnSlevel of 10 represents that the values of normalized building height variance fall in the range of 0.9–1.0, which indicates the high heterogeneity of urban areas. Because the large number of grids in different locations often has different levels of heterogeneity over d03, the number of grids representing different levels of heterogeneity is also different. To facilitate the analysis, the meteorological elements of all grids based on the same level of heterogeneity are averaged. Figure 4 shows the impact of the heterogeneity level on meteorological factors in the daytime (0800–1900 BT) and at nighttime (2000–0700 BT).
Generally, for the normalized building height variance calculated by different horizontal ranges of urban areas (horizontal range indicates the unit for calculating building height variance, such as 3 km × 3 km for the central grid with 8 surrounding grids and 5 km × 5 km for the central grid with 24 surrounding grids), there are no significant differences in meteorological elements at the same level of heterogeneity. However, with an increasing level of heterogeneity (expressed asS), there are obvious impacts of the jaggedness of the buildings on the near-surface meteorological elements.
Figures 4a and 4b show that the 2-m temperature of the LCZ case is higher than that of the MODIS case, and the deviation gradually increases with increasingS.Moreover, there are no significant differences in the 2-m temperature when the level of heterogeneity is low (Sin the range of 1–6) in the daytime, which may be related to the stronger turbulent mixing during the daytime. WhenSis greater than 7, the difference in the 2-m temperature gradually increases with increasingS. WhenSis 10, the difference in the 2-m temperature is as large as 1.2°C.The above phenomenon is more obvious at nighttime;whenSis 1, the difference in temperature is 0.9°C, and whenSis 10, the difference is as large as 1.5°C. Figures 4c and 4d show that the deviation in the surface net radiation also gradually increases with increasingS. WhenSis 10, the difference is as large as 22.5 W m?2in the daytime and 45.1 W m?2at nighttime. This may be due to the impacts of the jaggedness of the buildings on radiation.According to the discussion in Section 4.1, the enhancement of the trapping effect is also related to the jaggedness of the buildings, enhancing the surface net radiation and reducing the cooling rate at night and warming the air, and it is also partially offset by the cooling effect of building shadows during the day. Hence, the warming effect is more obvious at night.
Moreover, the weakening of the 10-m wind speed and the enhancement of the 50-m turbulent kinetic energy are also affected by the increase inS, especially in the daytime. Figures 4e and 4g show that the differences in the 10-m wind speed and 50-m turbulent kinetic energy are as large as 1.8 m s?1and 0.4 m2s?2whenSis 10, respectively. This may be due to the increases in the urban surface roughness and the windward sections of buildings with an increasing level of heterogeneity, especially during the day when the background wind speed is high and turbulence mixing is strong. Furthermore, the thermal turbulence of buildings is also enhanced in the daytime.In contrast, there is a weaker impact at night, as shown in Figs. 4f, h, which may be related to the weak turbulent mixing and the background wind speed during the nighttime.
4.3 Impact of the LCZ on the circulation of sea breezes
In coastal areas under high-temperature events, the air circulation may be affected by a combination of the background circulation and the sea breeze circulation.The thermal and dynamic meteorological elements are significantly changed by comparing the LCZ case with the MODIS case. Thus, it may cause a change in the sea breeze circulation.
Further analysis was conducted on the impacts of the LCZ land use data on the sea breeze circulation. First, sea breeze assessment was needed for this study because air circulation was a vector superposition of the background circulation and sea breeze circulation. The following criteria were needed: background circulation, land?sea thermal contrast, and cloud cover. According to the study of Papanastasiou and Melas (2009), the 850-hPa wind field can be regarded as the background wind field. Figure 5 shows the 850-hPa wind and 10-m wind fields. The direction of the background wind was southwest (Figs.5a, c), and the wind speed was weak. This indicates that the background circulation was stable during the period of high-temperature events. Moreover, the direction of the 10-m wind was similar to the background wind direction at 0200 BT (Fig. 5b). At 1400 BT, the direction of the 10-m wind changed from southwest to southeast (Fig.5d), and the wind speed was higher than before.
The above results may be related to the development of the sea breeze in the afternoon. To make further assessments, the land?sea thermal contrast and cloud cover were analyzed.
Figure 6 shows the average diurnal variations in land?sea thermal contrast and total cloud cover. The 2-m land temperature was 3.2–7.8°C higher than the 2-m sea temperature in the daytime (0800?1900) and 0.8–3.1°C higher at nighttime (2000–0700 BT) (Fig. 6a). Especially from 1200 to 1600 BT, the difference was 7°C and more. This indicated that the land?sea thermal contrast was strong and persistent in the afternoon. Moreover, the model generally captured the diurnal pattern of the land?sea thermal contrast well for the two experiments,while the LCZ case had a better performance than the MODIS case. Figure 6b shows that the total cloud cover is less than 0.3 in the afternoon, which provides favorable conditions for the formation and development of sea breezes.
In summary, the sea breeze circulation significantly developed in the afternoon. Further analysis was conducted on the impacts of the LCZ land use data on the development of the sea breeze circulation.
Figure 7a shows that the cooling of 3°C caused by the shadowing effect of the high-rise buildings, which was accompanied by a significant decrease in wind speed caused by the obstruction and dragging effects of the high-rise buildings in the city center (Fig. 7b), resulted in the weakening of sea breezes, restricting their impact to a smaller portion (10 km along the wind direction) of inland area compared to that in the MODIS case. As shown in Fig. 8, by the time the sea breeze circulation of the LCZ case advanced to the east of 121.7°E (Fig. 8a), the MODIS had advanced deeper into the urban area near 121.6°E (Fig. 8b).

Fig. 5. (a, c) 850-hPa wind and (b, d) 10-m wind fields at (a, b) 0200 and (c, d) 1400 BT 29 July 2013.

Fig. 6. Average diurnal variations in land?sea thermal contrast and total cloud cover. (a) 2-m temperature difference between land and sea, and(b) total cloud cover.

Fig. 7. Differences in the 2-m temperature field and 10-m wind speed field between LCZ and MODIS at 1400 BT 29 July 2013. (a) 2-m temperature and (b) 10-m wind speed.

Fig. 8. Vertical cross-sections along the line (shown in Fig. 1c) of air temperature (shadings; °C) superimposed on wind (vectors; m s?1) for(a) the LCZ and (b) MODIS cases at 1400 BT 29 July 2013. Urban and ocean areas are denoted in plots. The blue triangle represents the junction of land and ocean.
5. Conclusions and discussion
This study examines the impacts of LCZ land use data on the simulation of the high-temperature event over the megacity of Shanghai from 0800 BT 28 to 0800 BT 31 July 2013. The simulation was compared to a control case based on MODIS land use data. The main conclusions are summarized below.
(1) LCZ land use data perform better than MODIS land use data for simulating 10-m wind speed. The increase in building height causes the wind speed to decrease by 0.6–1.4 m s?1in the daytime and by 0.2–0.7 m s?1at nighttime.
(2) There are significant differences in meteorological elements between different land-use types. The upward shortwave radiation component of high-rise buildings is on average 15 W m?2lower than that of low-rise buildings in the daytime, which may be related to the stronger trapping effect of high-rise buildings on the radiation process of upward shortwave radiation. The upward longwave radiation component of high-rise buildings is on average 10 W m?2higher than that of low-rise buildings at night, which may be related to the larger exothermic surfaces of high-rise buildings. The sensible heat flux of high-rise buildings is on average 95 W m?2higher than that of low impervious surfaces in the daytime,while the latent heat flux is on average 67 W m?2lower.This is because the percentage of impermeable surfaces matched by highly impervious surfaces is larger, reducing vegetation transpiration, underestimating latent heat release from the city, and affecting the surface heat flux distribution. The 2-m temperature increases by 0.8°C at night but only by 0.4°C during the daytime when comparing LCZ1 and 2 with other land-use types, which may be due to the warming effect being partially offset by the cooling effect of building shadows during the day.Moreover, the 2-m specific humidity of low impervious surfaces is 0.2–0.4 g kg?1higher than that of other landuse types, which is also due to the higher latent heat flux.The 10-m wind speed of high-rise buildings is on average 0.6 m s?1lower than that of low-rise buildings in the daytime, while the 50-m turbulence kinetic energy is on average 0.2 m2s–2higher, which may be related to the stronger mechanical and thermal turbulence of high-rise buildings due to the thermal and dynamic effects. Furthermore, the obstruction and dragging effects are stronger during the daytime and weaken at nighttime,which may be related to the background wind speed.
(3) The jaggedness of the buildings reflected in the LCZ land use data may lead to an increase in the 2-m temperature and surface net radiation, a decrease in the 10-m wind speed, and the enhancement of turbulent mixing. When the level of heterogeneity reaches 10, it can increase the 50-m turbulent kinetic energy by 0.4 m2s?2,decrease the 10-m wind speed by 1.8 m s?1in the daytime, increase the surface net radiation by 45.1 W m?2,and increase the 2-m temperature by 1.5°C at nighttime.This is because urban morphology is changed by the jaggedness of buildings, enhancing the trapping effect and urban surface roughness. This is especially true during the daytime when the background wind speed is high and turbulence mixing is strong, and there is a strong trapping effect during the nighttime.
(4) The LCZ modifies the atmospheric circulation between land and ocean. The shadowing effect reduces the difference in air temperature between land and ocean and weakens the sea breeze. Moreover, high-rise buildings obstruct sea breezes, restricting their impact to a smaller portion (10 km along the wind direction) of inland areas compared to that in MODIS at 1400 BT.
This study attaches great importance to weather forecasting in the field of high-temperature weather. LCZ land use data that resolve urban morphology using complex building parameters make great contributions to the enhancement of the heterogeneity of the urban underlying surface, resulting in changes in the 10-m wind speed,50-m turbulent kinetic energy, radiation budget, 2-m temperature and local atmospheric circulation. However,both the UCPs and MEPs are important to the WRF model; only adjusting the UCPs is not enough, and the optimization of MEPs is also the goal of our future research. Moreover, the model validation in this study is not well developed due to a lack of relative humidity and sea buoy observational data. We hope to obtain higher quality observational data to support future research.
Acknowledgments.We thank the Computing Center of Nanjing University of Information Science and Technology for its computing support and help.
 Journal of Meteorological Research2022年6期
- Journal of Meteorological Research的其它文章
- Record Flood-Producing Rainstorms of July 2021 and August 1975 in Henan of China:Comparative Synoptic Analysis Using ERA5
- Interdecadal Variability of Summer Precipitation in Northwest China and Associated Atmospheric Circulation Changes
- A New Hybrid Machine Learning Model for Short-Term Climate Prediction by Performing Classification Prediction and Regression Prediction Simultaneously
- Surface Weather Parameters Forecasting Using Analog Ensemble Method over the Main Airports of Morocco
- Impacts of the Urban Spatial Landscape in Beijing on Surface and Canopy Urban Heat Islands
- Assessment of Urban Climate Environment and Configuration of Ventilation Corridor:A Refined Study in Xi’an