
Decarbonization of Maritime Transportation: A Case Study for Turkish Ship Fleet
2023-03-01 11:01BernaKanberoluEdaTuranandrkemkknk
Berna Kanbero?lu, Eda Turan and G?rkem K?kkülünk
Abstract Climate change and global warming are among the most severe threats to the global ecosystem, caused by greenhouse gas emissions.Therefore,all industries that cause environmental emissions should collaborate in the struggle against climate change.In this context, the International Maritime Organization (IMO) approved the initial greenhouse gas strategy at the MEPC 72 session in April 2018 to achieve targets for 2050.With this strategy, the IMO aims to create and improve new regulations that can enhance energy efficiency to achieve their short-term, midterm, and long-term goals.In this study, one of the novel terms, energy efficiency existing ship index (EEXI) values, has been calculated for the Turkish fleet to guide the maritime sector.The Turkish fleet in the study refers to the Turkish-owned vessels both sailing with a national or inter‐national flag.In accordance with this regulation, the number of Turkish fleets that were identified as either above or below the IMO reference lines has been determined.Additionally, EEXI values have been recalculated using the engine power limitation (EPL) method for ships that ex‐ceed the required limits, and the success rate of this method has been estimated.As a result, the application of EPL increased the number of ships below the Phase 2 reference line from 15.6 % to 53.1 %.To the best of our knowledge, this research, which has been carried out on all Turkish-owned ships, is the first study intended to serve as a guide for other ship owners in the global maritime industry regarding energy efficiency management.
Keywords Energy efficiency existing ship index; Energy efficiency; Emissions; CO2; Engine power limitation; Decarbonization
1 Introduction
The significance of the environment and sustainability has been fully understood on a global basis and in this respect,some regulations and precautions should be taken to control air pollution.IMO considered control of greenhouse gas emissions sourced by ships and adopted a new regulation re‐lated to energy efficiency for new ships and existing ships in 2013.There are some technical measures included in this regulation.These technical measures are classified into three groups as EEDI (Energy Efficiency Design Index) for new building ships, EEOI (Energy Efficiency Operational Indica‐tor) and Ship Energy Efficiency Plan (SEEMP) for existing ships.The regulations entered into force on 1 January 2013 and are valid for all new building ships of 400 gross tonnage and above, irrespective of flag and ownership (MEPC 2011).
In the following years, the IMO continued to effectively increase its energy efficiency measures for ships.In this concept, the Energy Efficiency Existing Ship Index (EEXI)was adopted in MEPC 76 as a technical regulation that fol‐lows the concept of the EEDI.There is no difference be‐tween EEDI and EEXI, at least in terms of calculation.Since the EEDI has not been applied to ships manufactured in 2013 and before, the new index to be calculated for these ships is called EEXI.In other words, EEXI is applied to ex‐isting ships while EEDI applies to new ships.The primary purpose of these indexes is the reduction of the CO2emis‐sions (MEPC 2021a)(IMO 2020a).The initial IMO strate‐gy on reducing greenhouse gas emissions from ships was determined at the MEPC 72 session and adopted by resolu‐tion MEPC.304(72).This strategy comprehends phases to decline the carbon intensity for new ships with the new im‐plementations regarding EEDI and reduce CO2emissions per transport work by at least 40% by 2030 and 70% by 2050 for ongoing vessels.It is aimed to sustain the envi‐ronment for future generations by creating a framework for further actions and the future plans for international ship‐ping (IMO 2020a; MEPC 2018a).The IMO’s fourth GHG Study in August 2020 shows that international shipping CO2emissions rose from 962 million tons in 2012 to 1056 million tons (a 9.6% increase) in 2018.In case relevant measures not taken, emissions from international shipping are expected to increase by between 90% and 130% by 2050 compared to emissions in 2008 (IMO 2020a).
A case study presented in the study, is an evaluation for shipowners to analyze energy efficiency indices of their fleet and prepare an action plan for improvement these in‐dices accordingly.This study contributes to the engineer‐ing literature and both a guidance for the shipowners.In other words, the Energy Efficiency Existing Ship Index(EEXI), which will become mandatory for ships over 400 GRT by January 2023, was examined for Turkish fleet ships to guide Turkish and international shipping companies.In addition, the calculated EEXI values were presented sepa‐rately for each ship type and compared with the EEDI phase lines.Finally, Engine Power Limitation (EPL), one of the technical measures to be implemented to improve the at‐tained EEXI, was carried out to analyze applicability.
According to the studies about decarbonisation in ship‐ping, Wan et al.(2018) discussed the technical and opera‐tional precautions in order to decrease emissions sourced by maritime transportation and they stated that in spite of transporting the goods the most efficiently in terms of en‐ergy, the shipping industry is not adaptive to decarbonize economic growth.Therefore, a target should be defined to achieve the desired emission reduction levels.In this re‐spect, they have introduced technical, operational and mar‐ket-based solutions for decarbonizing international ship‐ping.Lindstad and Eskeland (2015) examined the effects of three alternatives as speed reductions, cargo inventory costs and hull forms on the cost of emission reduction for crude oil tankers.They observed that reducing the speed of the vessel below design speed, the cost reduction is much smaller than the reduction in fuel consumption and hence emissions.Secondly, slender vessels are more advanta‐geous than standard designs for lower fuel consumption at high speeds.Thirdly, ship size also effects fuel consumptions where larger vessels operate with lower fuel consumption and fourthly fuel price increase causes an increase in the cargo values.Papadis and Tsatsaronis (2020) studied on the alternatives for decarbonisation in the energy sector and offered some solutions in order to cope with this challenges.They analysed decarbonization options for the sectors in the energy field such as electricity generation sector, heat supply sector, petroleum products and synthetic fuels, enduse energy sectors, households, industries, etc.They point‐ed out that decarbonization of energy sector fully is not possible in 21stcentury due to some facts regarding capital requirements, energy and energy policy needs.Develop‐ment and implementation of international policies and laws in the countries are suggested in the study in order to overcome emission sourced problems.On the other hand,the most significant measure for future was proposed as carbon tax.Armstrong (2013) made a review for optimisation opportunities considering into three groups as operational,technical and commercial optimisation in order to maintain low carbon shipping.They discussed optimisation initia‐tives as hull and propeller, engine performance optimisa‐tions, cargo heating management, route and trim optimisa‐tion, sonic cleaning of economiser, fuel slide valve grade,slow-steaming, enhancing hull coatings and drydocking strategies, etc and decided that the yielding maximum ben‐efit is achieved by slow-steaming.Additionally, Gray et al.(2021) not only investigated maritime trade, but also airway and highway transportation modes and current and future sit‐uation of these sectors have been given in detail and made suggestions for the future of transportation systems.They highlighted that there are challenges to turn into full electrifi‐cation and as the energy transition progresses, full electrifica‐tion of the heavy-duty transport sector will not be feasible.Thereby, gaseous and liquid alternative fuels will be required.
There is a further debate on how to reduce carboniza‐tion in the maritime industry considering case studies in the literature.In this respect, Karaduman et al.(2020) com‐pared carbon emissions of eleven Balkan countries includ‐ing Turkey subject to their transportation activities in their study.As a method, logistics performance index (LPI) of the countries has been examined and they have indicated that there was a positive relationship between LPI and the carbon performance of the selected countries.They also concluded that Balkan countries, which have higher LPI scores, could cause less carbon emissions.Liu et al.(2021)performed a simulation in order to estimate ship emissions in Ports of Tokyo, Long Beach, Shanghai, Hamburg and Singapore for 2020.2030 and 2050 with scenario model‐ling.The ports selected in the study have heavy vessel movements and therefore the results of the study may cre‐ate an outlook to the policy makers in order to make new regulations.They projected that emissions to be decreased in the Ports of Tokyo, Long Beach, and Hamburg and in‐crease in the Ports of Shanghai and Singapore by 2050 in accordance with the traffic volume.They showed the sig‐nificance of traffic volume in addition to the emission reg‐ulations and made an insight for the policy makers regard‐ing future potential regulations.Prasad and Raturi (2019)reflected the maritime traffic in Fiji, evaluated energy effi‐ciency measures by making a scenario analysis for 2040 and made suggestions for the country that shipping is a crucial activity as an island country for the economy.In this context, they made a questionnaire-based survey in or‐der to collect data for passenger and cargo movements since there was no official record of fuel consumed by maritime vessels in Fiji.The result of the study declares that total energy demand for fossil fuel in Fiji maritime sector would increase and some precautions should be con‐sidered such as using cleaner fuels, adopting energy effi‐ciency measures, introduction of hybrid and sail against diesel usage, maintenance and coating of the hull, propel‐ler polishing, and speed reduction are presented as a solu‐tion to decrease the effects of diesel consumption.Bagoul‐la and Guillotreau (2020) reported the role of maritime transportation on French economy by using Input - Output(I-O) approach and reported the impacts of maritime trade on air pollution.According to the results of the approach,the maritime transport industry pulls other industries upwards in the country however the industry is mainly ignored by the government.Moreover, maritime industry maintains more employment opportunities to the population, especially passenger transport activities have greater contribution than freight transportation.Wang and Zhou (2018) provid‐ed a method for the emission reduction regulations in the scope of assessment of life cycle considering environmental and economic impacts in order to guide decision makers in the maritime companies.They created a life cycle assess‐ment model for four main stages of a vessel as construction,operation, maintenance, and scrapping activities.It is clearly seen that operation phase causes the highest amount of emissions.An economic analysis has also been carried out to convert the environmental effects into money and find out the effects of emission reduction target of the life cycle cost and they reached a result that a high target will have a higher profit due to saving from carbon credits and trading of final products.Nian and Yuan (2017) offered a method in the scope of assessment of life cycle for maritime transportation for oil tankers and evaluated the alteration of carbon emis‐sions by reducing the ship speed.They stated that larger tank‐ers are more carbon efficient compared to smaller ones in terms of emission factors, in contrast, large tankers produce more carbon emissions than smaller tankers for considering quantity of life cycle carbon emissions.Additionally, it is discussed that while speed reduction helps to reduce the quantity of the life cycle carbon emissions, random reduc‐tion in ship speed may also prevent the energy and carbon efficiency in tanker transportation.Leonardi and Browne(2010) developed a method to determine the carbon footprint of especially maritime sector and benchmarked carbon emis‐sions of UK, France and Belgium supply chains in a case study.The effect of logistics choices on the carbon footprint of the mar‐itime transport have also been investigated.One alternative is pre‐sented as using a hub port enables to reduce carbon emissions since there are less port calls during total voyage and the other factor is given as the average fuel use per day at sea of the vessel.Another alternative is the use of a charter vessel for a direct trip instead of a container vessel to improve the energy efficiency.
Some researchers have also investigated impacts of pas‐senger transportation on shipping emissions and thereby,Dillman et al.(2021) made a detailed study on passenger transportation of Reykjavik by using modelling and simu‐lation techniques and measured the ratio of greenhouse gas emissions in the city.They indicated that while decarbon‐ization through electricity has an effect on less emissions,but also travel behaviour and urban form should also be al‐tered to reach more successful solution.Zis et al.(2020)analysed what extent of Ro-Pax shipping comply with the new IMO regulations for decarbonisation.They declared that combination of the techniques for reducing emissions should be more feasible for emissions reduction and more fundamental alteration would have to be implemented, for in‐stance fuels having less carbon coefficient since reduction technologies have limited impacts on emission reductions Serra et al.(2020) discussed the environmental effects of Ro-Ro shipping in the Mediterranean area and showed the effect of optimised network by analysing the current origin-desti‐nation ports of roro.They proposed an alternative route for existing Mediterranean shipping network.They estimated the effects of both existing and new optimized network both for economic and ecological aspects by applying Tier 3 method and showed that there was a significant reduction in emissions both for cruising, hotelling, and manoeuvring phases of the optimized network.Zheng et al.(2019) men‐tioned that carbon emissions were increased due to the rise in cruise shipping and in this respect, they studied minimum fuel consumption forming artificial neural network model in pas‐senger transportation.Total fuel consumption is reduced from 97.4 t to 86.6 t of a voyage with the proposed mathematical model and this method can be used for a decision support tool for determination of the voyage speed of cruise vessels.
Moreover, there are some researches regarding energy efficiency in order to make ships more environmental friendly.Hansen et al.(2020) made interviews with the ship crew in order to understand the application of SEEMP(Ship Energy Efficiency Management Plan) onboard and presented suggestions for the improvement of the SEEMP in practice.In this context, coordinating the jobs with stakeholders, access to performance data for energy effi‐ciency on board, safety, involvement of different actors and workers are summarized as prominent factors.Rehm‐atulla and Smith (2015) have also investigated blockades of maritime transportation with regards to energy efficien‐cy and reduction of carbon by using a survey analysis.In practice, participation of stakeholders and confronting ob‐jectives are considerable parameters for the development of a beneficial SEEMP.According to the results of the sur‐vey, fuel consumption monitoring, general speed reduction and weather routing were cited as measures that have the highest potential.Another research that made survey to the main actors in the shipping industry have been executed by Rehmatulla and Smith (2020) and they focused on bulk carrier operators considering various charter con‐tracts.They aimed to investigate the variation of energy efficiency implementations subject to the charter types of the vessels and in final, they have observed that energy ef‐ficiency technologies to maintain low carbon shipping were mostly adopted by time charter vessels compared to spot charter companies.Zhang et al.(2019) proposed an al‐ternative indicator given name as Energy Efficiency Per‐formance Indicator (EEPI) for energy efficiency and envi‐ronmental friendly shipping.It is indicated that EEPI can be used as a benchmarking tool due to its simple form and practicability and although data were derived from oil tankers, the proposed indicator could be applied to other types of vessels.Kanbero?lu and K?kkülünk (2021) com‐pared and analysed the EEOI values by using the actual voyage data of five bulk carriers and discussed what ener‐gy efficiency improvements could be needed.The most significant parameter for energy efficiency is given as fuel consumption of main engine in the study.Therefore, ship‐ping companies that should co-ordinately work together of both technical and operational departments, must be paid attention.On the other hand, they concluded that shipping firms should update their efficiency in terms of fleet pro‐ductivity since the fleet efficiency has fallen Parlak and K?kkülünk (2016) examined some of the parameters during ship operations to increase the performance of the diesel en‐gine in terms of fuel-saving.According to the authors, exist‐ing measurement systems should be improved to analyse failures comprehensively and detect the problems early.
Some research regarding fuel efficiency shows that devel‐opments is fuel technologies have a significant effect on de‐carbonisation.Müller-Casseres et al.(2021) analysed the maritime fuels production in Brazil and stated that it is Bra‐zil can follow the low carbon strategy in line with the goal of IMO 2050.They stated that individual fuel scenarios are less cost effective, and it should be focus on technologies such as fuel cell-based ships, bio-digestion and hydrogen production units.Moreover, integrated national reduction strategy in the energy sector might be more efficient for de‐carbonisation.I??kl? et al.(2020) studied on the fuel oil con‐sumptions of bulk carriers utilizing from the noon reports and made a statistical experimentation for predicting the fu‐el consumptions of the vessels.Several parameters as wind,distance, draught, etc.that effects the fuel consumption of the vessel has been considered during estimations with Re‐sponse Surface Methodology (RSM).The novelty of the study is given as using real data and the results indicated that the ship speed along with the frequency of rotation of the ship’s engines are the most notable input factors when estimating the fuel oil consumption of the vessel per mile.Prussi et al.(2021) examined alternative fuels in the mari‐time trade that contributes decarbonisation.They pointed out that despite having various options available for mari‐time sector, the usage of future mixture of fuels used will de‐pend on technology improvements, availability, costs and the real potential for emissions reduction and also indicated that the infrastructure should be improvement in order to apply various types of fuels.Wang et al.(2020) also examined the utilization of bio-methanol and biodiesel via two addi‐tives in twenty blends with marine diesel oil (MDO) and de‐clared that the blend could be considered as an alternative fuel by improving flash point.They reached that Diesel–biodiesel blends with additives 1% (volume basis) dodecanol and 0.5%(volume basis) 2-ethylhexyl nitrate and a low methanol content around 5% (volume basis) is seen as the most proper for use as marine diesel fuel according to the standards of ISO 8217:2017.
In addition to above studies, there are also some re‐searches in the literature, however very limited, on the in‐ternal and external costs of transportation such as air pollu‐tion costs, noise costs, etc.Vierth and Merkel (2020) inves‐tigated the current situation of Swedish maritime transport and made an estimation for the external and infrastructure maritime transportation costs in Sweden in order to inter‐nalize these costs.They recorded all vessel movements in Swedish ports during a year accordingly.The study illus‐trated that Ultra Low Sulphur Heavy Fuel Oil (ULSHFO)and Marine Gas Oil (MGO) were mainly consumed in Swedish territorial waters and the regulations were strict in the country.The results show that Ro-Pax, Ferry & Cruise vessel classes exhibits the lowest degree of internalization.Yuan et al.(2019) evaluated energy saving alternatives for maritime transportation based on modelling approaches.The alternatives were determined as speed reduction,weather routing, trim optimization, autopilot adjustment and speed control of pumps/fans.It is pointed out in the study that the significant precaution for energy saving was speed reduction and weather routing for cost effectiveness among all considered alternatives.Other precautions such as speed control of pumps and fans, autopilot adjustment and optimization of trim have also performed negative cost and resulted with cost reduction and energy savings.Moreover, Horvath et al.(2018) benchmarked alternative fuels and technologies for shipping sector in 2030 and 2040 and made a cost analysis.They aimed to designate most cost-effective combination of fuels and fuel cells or internal combustion engines to replace fossil oil as the main propulsion fuel.As a conclusion, they offered hydro‐gen fuel cells which were found the most likely to replace fossil internal combustion engines subject to the develop‐ments in this field.Zhu et al.(2018) investigated maritime emission trading system for container shipping and altera‐tion of fleet cost under scenario analysis by collecting real data from the sector.According to the results, implementa‐tion of maritime emissions trading system enables positive changes to an operator’s fleet composition, offers more en‐ergy-carbon-efficient ships, and even to the extent of lay‐ing up less energy-efficient ships.Significant reductions were presented in CO2emissions when bunker prices are assumed high.In addition, tightening the allocation of CO2allowances only has noticeable impact on reducing CO2emissions under high bunker price scenario.
In addition to above studies, research regarding Engine Power Limitation (EPL) are newly introduced to the litera‐ture.Rutherford et al.(2020) applied scenarios on the fuel and CO2savings of vessels with an alteration from 10% to 60% EPL strategies in 2018 and 2030.They focused on container ships, bulk carriers, and oil tankers fleet that cov‐ers majority of the international shipping emissions.They submitted that 40%–50% EPL would reduce CO2emis‐sions between 1% and 4% depending on ship type and size while 60% EPL reduces CO2fleetwide in 2030 by about 6%.Rigos (2022) investigated the effect of Engine Power Limitation on the Energy Efficiency Existing Ship Index in this thesis.The methods were examined in theoretical perspective and noon reports were obtained in order to analyse operational data in a practical perspective.It is speci‐fied that it not only the limitation of the main engine that af‐fects the real time “EEXI” [gr-CO2/t.nm] but also the quality of the fuel also plays a major role in the reduction of the actu‐al emissions.Mohr, H.et al.(2022) made a study in Carbon Intensity Indicator (CII) in the scope of container vessels and bulk carriers.Impacts of reduction and limitation of the main engine output in order to achieve specific CII rat‐ing reductions have been demonstrated.Additively, it is mentioned that CII value was reduced with proper opera‐tional planning even though route length of the vessel was increased.It is clearly understood that detailed operational planning improves the effectiveness regarding CII require‐ments.Therefore, the relationship between main actors of shipping business as shipowners, charterers and operators should be close in order to plan the operation of the vessels.
This literature review has examined the carbon emissions of the maritime industry and potential solutions for reduc‐ing them.The studies reviewed suggest that there are vari‐ous measures that can be taken to decrease the effects of diesel consumption, including using cleaner fuels, adopting energy efficiency measures, hull maintenance, and speed op‐timization.Life cycle assessment models have also been found to be useful in determining emission reduction regulations and assessing the environmental and economic impacts of vessel operations.However, it is important to note that some stud‐ies indicate that random speed reduction may not necessari‐ly improve energy and carbon efficiency in tanker transpor‐tation.Additionally, this review highlights the need for more research on the carbon footprint of the maritime sector and the impacts of the operation process.Overall, this literature review provides valuable insights into the current state of research on emissions and energy efficiency in shipping.However,more research is needed to fully understand and address the environmental impact of the shipping industry.
2 Material and method
2.1 Material
The information about the Turkish-fleet ships that includes 1077 ships in total for calculation was provided from mari‐time and trade section of IHS Markit that allows to reach comprehensive data on various sectors.Figure 1 illustrates the numerical values of different types of ships used in this study.Furthermore, Microsoft Excel is used for the calcula‐tion of EEXI values in the study since it enables to evaluate the data properly.Data have been organized in rows and col‐umns in the study and calculations have been carried out.

Figure 1 The number of ships based on ship type
Turkish fleet has similar characteristics with the global maritime fleet and also projects the current situation since the fleet contains several types of vessels such as bulk car‐riers, general cargoes, Ro-Ro’s, tankers, and container ships (Chamber of Shipping 2022).According to the data for 2021, Turkish fleet consists of; 26.2% bulk carriers,21.6% oil tankers, 17.7% container ships, 11.4% chemical tankers, 10.3% dry cargo ships, and 12.8% other types by DWT.Moreover, global maritime fleet consists of 42.77%bulk carriers, 29.00% oil tankers, 13.2% container ships,2.29% chemical tankers, 3.6% dry cargo ships, and 11.43% other types (United Nations 2021).
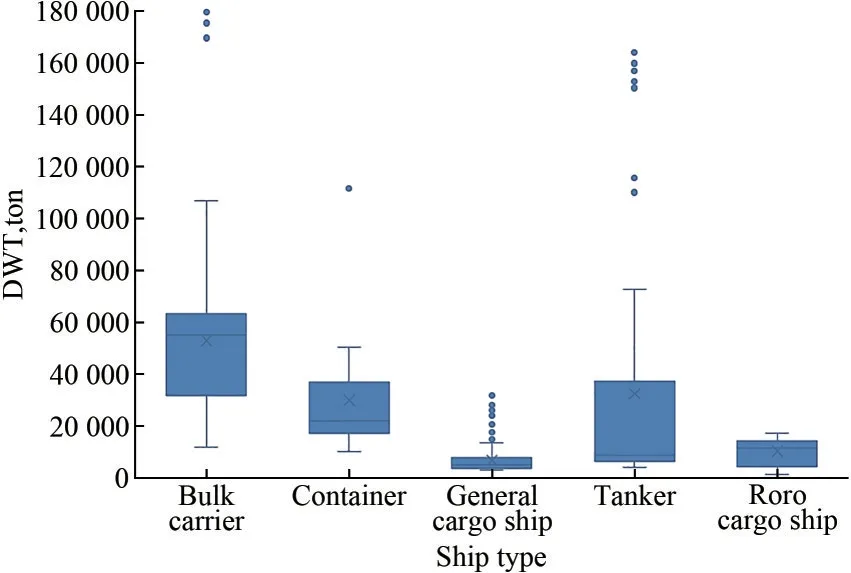
Figure 2 The boxplot of deadweight tonnage based on ship type
The distribution of deadweight tonnage with respect to the ship type has been demonstrated as a boxplot in Figure 2.The whiskers at the bottom and top in each box are symbolized their minimum and their maximum values.Also, the values outside the range of the box are identified as the outliers and these illustrate as dots.When the Turk‐ish-fleet vessels compared in terms of deadweight ton‐nage, it is seen that tankers and bulk carrier ships have greater tonnage than the other ship types.
2.2 Method
The calculation technique of the EEXI value is similar in principle as for EEDI, which is mandatory for new built ships.The basic difference is the ability to apply the meth‐od to existing ships.The EEXI formula was defined with the four terms as “Main engine CO2emissions”, “Auxilia‐ry engine CO2emissions”, “CO2emissions reduction tech‐nology(s)” and “Transport work”, respectively.These terms are shown as below (IMO 2020b):
According to IMO, the minimum energy efficiency lev‐el set in the MEPC is different for different ship types and sizes.Accordingly, reference lines have been established for each ship type.The attained EEXI is a design index that shows the energy efficiency of ships compared to a baseline set by the International Maritime Organization(IMO).In other words, the attained EEXI value will be compared to a required EEXI based on an applicable re‐duction factor expressed as a percentage relative to the baseline.
Due to the need to improve the efficiency of existing and new ships, IMO has established three phases.The mentioned phases in accordance with the applicable time period, are presented below (MEPC 2011):
Phase 0: 1 Jan 2013 – 31 Dec 2014, at least equal to the baseline;
Phase 1: 1 Jan 2015 –31 Dec 2019 at least 10% below the reference line;
Phase 2: 1 Jan 2020 – 31 Dec 2024, at least 20% below the reference line;
Phase 3: 1 Jan 2025 and onwards, at least 30% below the reference line.
2.2.1 Attained EEXI
EEXI is a design index proposed to measure the energy efficiency of ships by the International Maritime Organiza‐tion (IMO).The “attained EEXI” formula is detailed in 2022 Guidelines on The Methos of Calculation of The At‐tained Energy Efficiency Existing Ship Index (EEXI) as follows (MEPC 2022):
The parameters in the EEXI calculation formula are ex‐plained in detail below in accordance with the instructions provided by (MEPC 2018b; IMO, 2018) and (IMO, 2021;MEPC 2022):
Cfis the carbon factor based on the fuel type, remarked at NOxTechnical file (2014).The calculation in the study has been done considering that all Turkish fleet in the study is operating with marine fuel.There is no new fuel usage in the fleet.In case of any new fuel technology us‐age, the calculation of the study differs due to carbon fac‐tor.In this context, the fuels are regarded as HFO for the main engine and MDO for auxiliary engines of the vessels in this study and their Cfvalues are 3.114 and 3.206 t-CO2/t-fuel, respectively.Also, SFC is the specific fuel consump‐tion per unit of engine power, Capacity is the deadweight tonnage (DWT) for bulk carriers, general cargo ships, tank‐ers (Capacity = DWT).For container ships, it is calculated as 70% of the deadweight tonnage.(Capacitycontainer= 0.7 DWT).Furthermore, PMEis the main engine power (kW)and defined as 75% of the maximum continuous rating(MCR) power.PAEis the auxiliary engine power (kW)(MEPC 2022).
Moreover,Vrefis the ship speed.According to the EEXI calculation guideline (IMO 2020c), an alternative method was needed for pre-EEDI vessels to calculate ship speed(Vref,app) since these vessels did not have a speed-power curve or model test report.Therefore, the formula calculat‐ed the vessel speed approximately was suggested in the EEXI calculation guideline as below (MEPC 2021b):
In the above formula,mis the ship’s performance mar‐gin, which should be 5% of Vref,avgwhere MCRMEis de‐fined as the rated installed power of the main engine.MCRavgis the average of MCRMEfor main engines that cor‐responds to the EEDI reference line, and it is remarked in the draft guidelines of EEXI.Vref,avgis the mean of the ship speed, calculated as below:
As shown, the new formula called “Vref,app” depends on the ship type and installed power.The values of A, B and C are given in EEXI guidelines by IMO (MEPC 2021b).
2.2.2 Required EEXI calculation
The Required EEXI is the maximum value of the EEXI achieved, which is permitted for the specific ship type and size by IMO.Besides, this value is defined with specific reduction rates related to the EEDI reference baseline(IMO 2020c).
According to the MARPOL Regulation 25 of Annex VI,the formula representing the relation between “Attained EEXI” and “Required EEXI” as follows (MEPC 2021c):
where the reduction factorYis the percentage value of the decrease relative to “EEDI reference baseline” and these values are determined to achieve targets in GHG strategy by IMO.The reduction rates have been remarked in regula‐tion 25 of MARPOL Annex VI (MEPC 2021c).
The EEXI reference line value is defined as the maxi‐mum permitted EEDI values by IMO, is calculated with the following formula (IMO 2020c):
where the values ofaandcare constant in association with ship type (IMO 2020c).
3 Results and discussion
In this section, firstly, the attained EEXI value has been calculated using the formula described in the previous sec‐tion for all Turkish-fleet vessels.And then, each of these values has been examined to see whether it meets the re‐quirements for Phase 0, Phase 1, and Phase 2.Secondly,EPL is the method that reduces the CO2emissions of the current fleet has been applied to all Turkish-fleet ships.The EEXI values of the existing ships have been com‐pared to the new EEXI values calculated after the EPL ap‐plication.Finally, the reduction rate has been determined.
3.1 Comparison of attained EEXI and required EEXI
The variation of “Attained EEXI” values of all fleet ships associated with the reference line as Phase 0, Phase 1 and Phase 2 are illustrated in the Figure 3.In this con‐text, the assessment results of all fleet have been given be‐low;
Figure 3(a) illustrates the attained EEXI values of bulk carriers in Turkish fleet based on the reference line, which is Phases 0, 1 and 2.The number of bulk carriers below Phase 0, Phase 1 and Phase 2 reference lines are 48, 13 and 11, respectively.As seen from the figure that ships are clustering around the tonnage of 25,000 to 80,000 DWT.
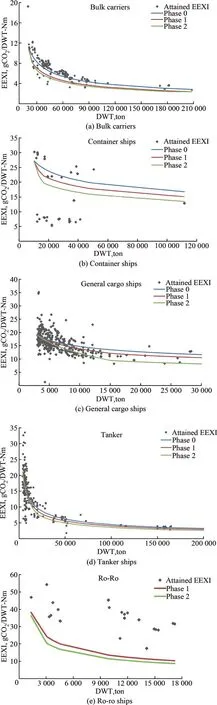
Figure 3 EEXI values of all fleet
Figure 3(b) shows the attained EEXI values of container ships in the Turkish fleet based on the reference line, Phas‐es 0, 1 and 2.The number of container ships below Phase 0, Phase 1 and Phase 2 reference lines are 45, 38 and 38,respectively.As can be seen from the mentioned graph,there are few ships above phase 0.Also, most of them meet Phase 1 and Phase 2 without any action plan.
Figure 3(c) shows the attained EEXI values of general cargo ships in the Turkish fleet based on the reference line,Phases 0, 1, and 2.The number of general cargo ships be‐low Phase 0, Phase 1, and Phase 2 reference lines are 306,290, and 228, respectively.As can be seen from the figure that ships are clustering around the tonnage of 3,000 to 10,000 DWT.
Figure 3(d) shows the attained EEXI values of tankers in the Turkish fleet based on the reference line, which is Phases 0, 1, and 2.The number of tankers below Phase 0,Phase 1, and Phase 2 reference lines are 142, 116, and 98,respectively.The tanker ships in the Turkish fleet are clus‐tered between 3,000 to 15,000 DWT.
Figure 3(e) shows the attained EEXI values of ro-ro cargo ships in the Turkish fleet based on the reference line, which is Phases 1, and 2.It is realized that there is no ship meeting the reference lines when the attained EEXI and the phase lines were compared for Turkish fleet ro-ro ships.
As can be seen from the figures, most of the bulk carrier and Ro-ro ships cannot even meet phase 0.In this context,a challenging process waits for bulk carriers.Major revi‐sions are required, especially to meet Phase 2.EPL alone will not be sufficient, and it may become mandatory for ships to cruise with gaseous fuels in the years ahead.
3.2 Application of engine power limitation (EPL)
Ships that do not meet the requirement of “Attained EEXI ≤ Required EEXI” should take short-term mea‐sures to increase energy efficiency and continue their commercial activity.Some of these measures are the change of fuel systems or the limitation in the main engine.Apart from these measures, some technological investments can be taken by shipowners (Alpha Marine 2021).
In this section, using EPL, the newly attained EEXI values are calculated by limiting the power of the main engine to 10%, 20%, and 30% and are shown separately for each ship type.Calculated the EEXI at 90%, 80%,and 70% of limited MCR are shown in the graphs as 10%, 20%, and 30% EPL.Moreover, the reference line shown in the graph as “Required EEXI” was calculated based on reduction factors (in percentage) in MEPC.328(76).This percentage value is equivalent to phase 2 and phase 3 range of EEDI (MEPC 2021c).
The EEXI value calculated using different ratios of EPL and the “Attained EEXI” value are shown in the Fig‐ure 4~8 for all Turkish fleet Bulk Carriers, Containers,General Cargo, Tankers, and Ro-Ro Cargo Ships relative to the reference line (Required EEXI).
Figure 4 shows the EEXI values of the bulk carriers in the Turkish fleet with 10%, 20% and 30% EPL applica‐tion.The number of ships meeting the reference line (re‐quired EEXI) with the application of EPL is 15, 38 and 40 for EPL 10%, EPL 20% and EPL 30%, respectively.In case of without EPL, the number of ships meeting the re‐quired EEXI value was 11.Besides, the mentioned ships are mostly collected between 20 000 and 80 000 in terms of tonnage.

Figure 4 EEXI values with EPL application of bulk carriers
Figure 5 illustrate the EEXI values of container ships in Turkish fleet with 10%, 20% and 30% EPL applica‐tion.In this figure, most of ships are between the tonnag‐es of 20 000 and 40 000.
As a result of the EPL application, the number of con‐tainer ships meeting the reference line (required EEXI)are 38, 44 and 49 for EPL 10%, EPL 20% and EPL 30%,respectively.In case of without EPL, the number of ships meeting the required EEXI value was 38.As it can be seen, the limitation of EPL 10% on container ships has not been beneficial.As can be seen, EPL application in all three ratios is not sufficient.In order for the ships to navigate with their current or EPL conditions, they need to apply additional energy efficiency applications.

Figure 5 EEXI values with EPL application of container ships
The EEXI values with 10%, 20%, and 30% EPL application of general cargo ships in the Turkish fleet are shown in Figure 6.There are 228 Turkish-fleet general cargo ships below the “Required EEXI” value for the first situation.This number was increased to 279, 324, and 377 ships, re‐spectively with the 90%, 80%, and 70% limitation of main engine power.Furthermore, the related ships are mostly clustered between 2 000 and 10 000 in terms of deadweight tonnage.As can be seen, it was observed that the trend of the line is more remarkable for small tonnage in ships by contrast with the other ships.
The variation of EEXI values obtained using EPL was analysed, and it was seen that the number of ships meet‐ing the required EEXI increased from 98 to 112, 137, and 192, respectively.While the trend in the improvement of the energy efficiency index has been found to be more ob‐vious for small tonnage ships, this trend is stable for the other ships.As can be seen, mostly with 30% EPL appli‐cation, the limits are lowered.Even in this case, a few ships remain above the limit line and it becomes neces‐sary to take additional energy efficiency precautions.

Figure 6 EEXI values with EPL application of general cargo ships
Figure 8 shows the EEXI values of the roro cargo ships in Turkish fleet with 10%, 20% and 30% EPL application.As can be seen from the below graphs, only one ship could meet the reference line with 30% EPL in roro cargo ship types.No success was achieved in the other EPL ratios.
To sum up, the attained EEXI value after applying 30% EPL is meeting the reference line in most ship types significantly in this study.However, in some cases the en‐gine power limitation of less than 30% also reduces the EEXI to a level matching with the required EEXI.There‐fore, it is important to apply the correct engine power lim‐itation ratio to the ships.Besides, the authors determined that the maximum reduction of EEXI values with EPL is more for low-tonnage ships.and it is obvious that choos‐ing the optimal main engine, especially for low tonnage ships, is quite a delicate task (Wang et al.2019).
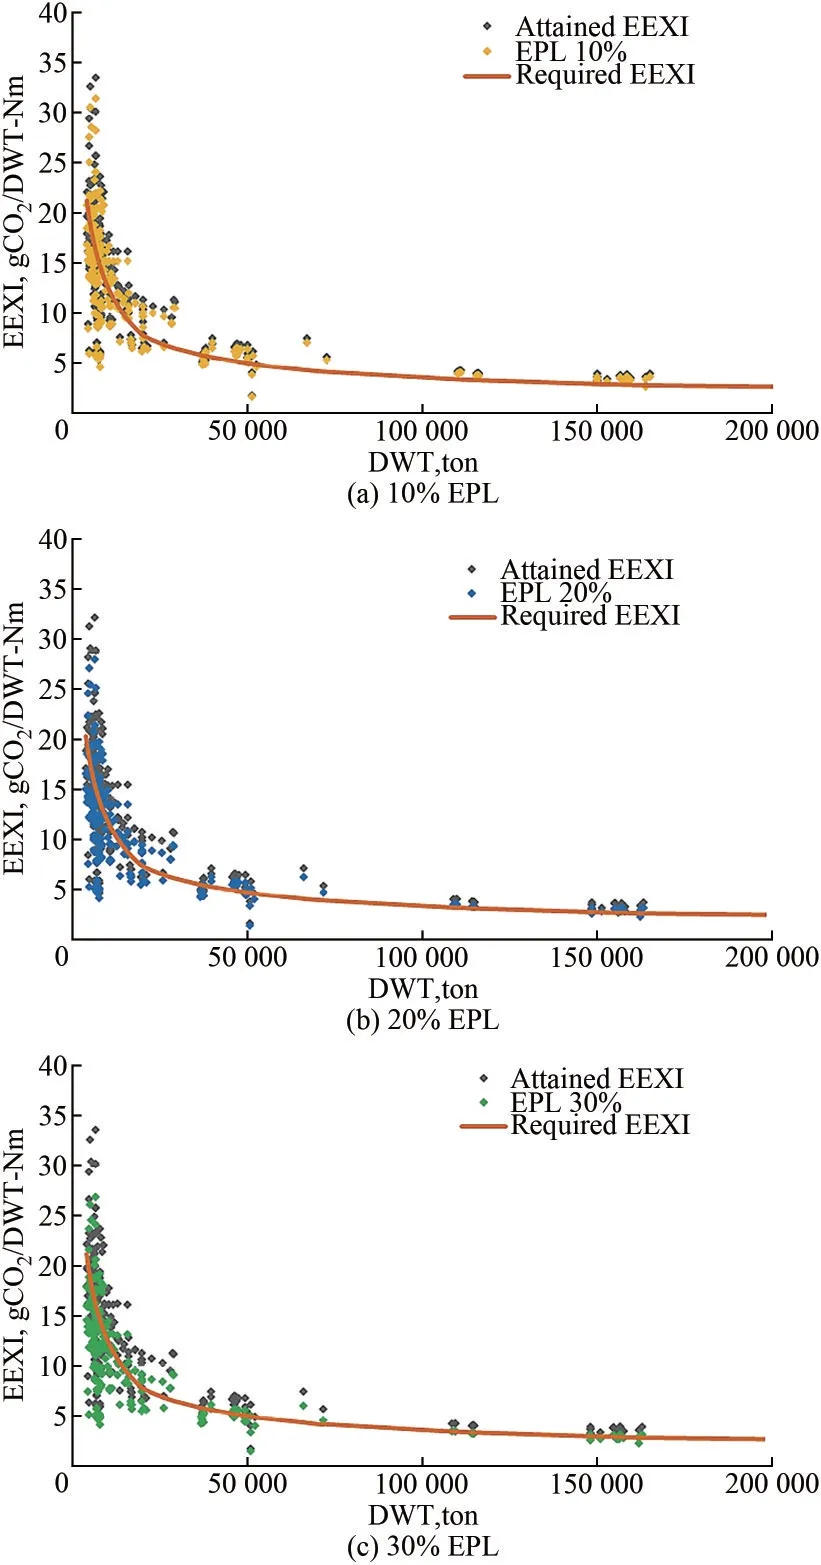
Figure 7 EEXI values with EPL application of tanker ships
4 Conclusions
In this research, initially, “Attained EEXI” values of Turkish-fleet vessels were compared and evaluated by us‐ing Phase 0, Phase 1 and Phase 2 reference lines of EEDI.It should be remembered, the required EEXI value is equivalent to approximately phase 2 of EEDI (MEPC 2021).The Engine Power Limitation (EPL) is known to be one of the easiest ways to improve the attained EEXI up to the required level.Therefore, in the second part, the existing ships in the Turkish fleet ships was applied the en‐gine power limitation (EPL) at different rates to meet the“Required EEXI”.The conclusions were mentioned as below:
? When bulk carriers are examined, it is seen that about 18% and 5% of them are below phase 0 and phase 1 lines, and only 4.2% are below the phase 2 line.After lim‐iting the engine as 10%, 20% and 30%, the rate of ships meets the required EEXI values increased to 5.8%, 14.6%and 15.4%, respectively.
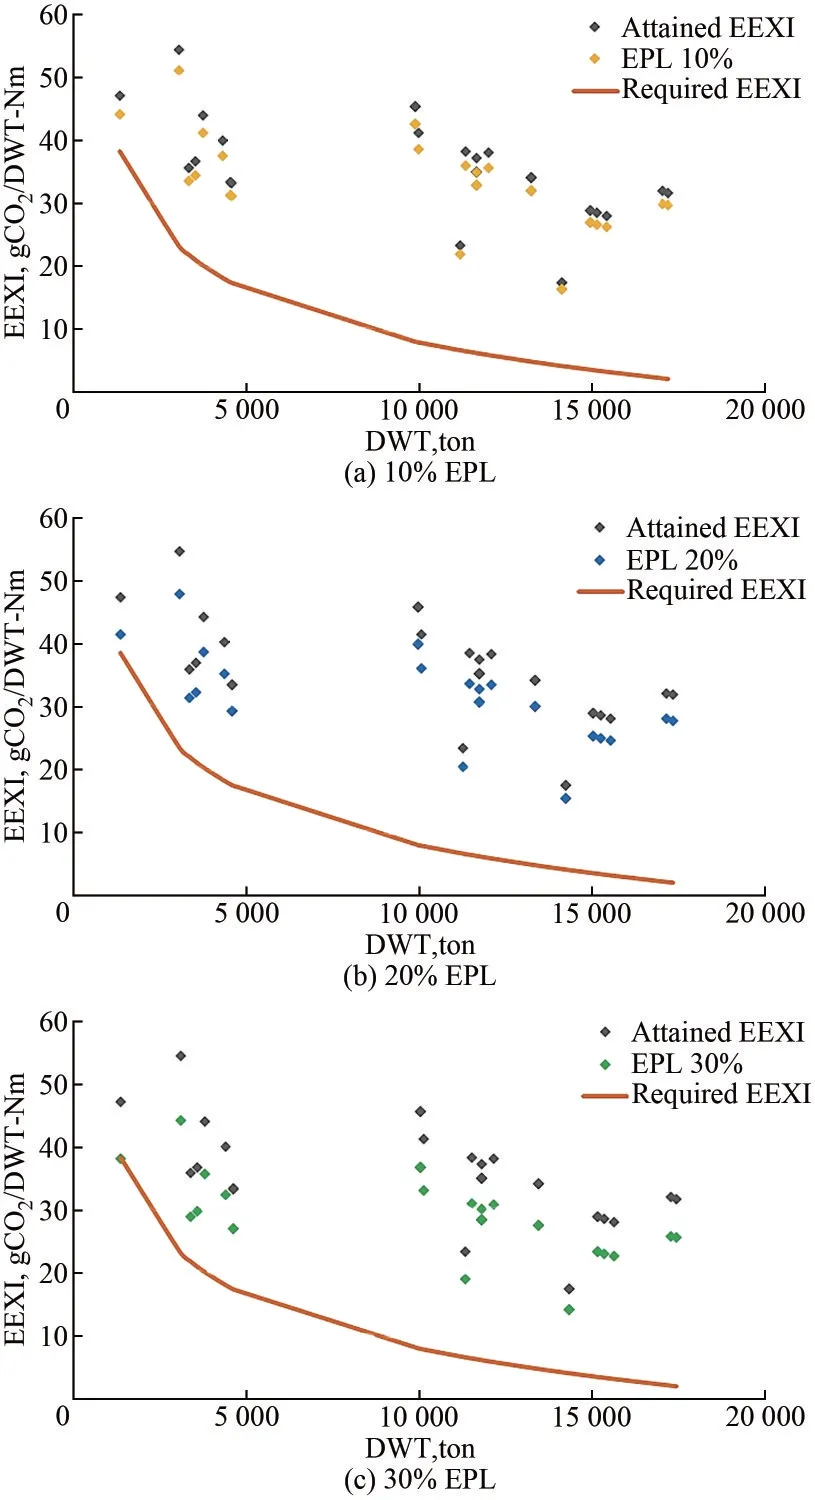
Figure 8 EEXI values with EPL application of roro cargo ships
? The percentages of container ships under phase 0-1-2 reference line are 68.2, 57.6 and 57.6, respectively.After limiting the engine as 10%, 20% and 30%, the rate of ships meets the required EEXI values increased to 57.6%,66.7% and 74.2%, respectively.
? 51.3% of general cargo ships are meet phase 2 refer‐ence line.After applying 20% EPL, it is seen that over 70% of these ships are meet the reference line.
? 51.2% of tanker ships are under phase 0 reference line.On the other hand, 41% and 35.3% of them are below the phase 1 and phase 2 reference line, respectively.After lim‐iting the engine as 10%, 20% and 30%, the rate of ships meets the required EEXI values increased to 40.4%,49.4% and 69.3%, respectively.
? In general, the number of entire Turkish-fleet ships meet the required EEXI is 375, which is only 34.8 percent of all ships.
? When 10% EPL was applied to existing ships, the num‐ber of ships meet the required EEXI reference line increases from 11 to 15 for bulk carriers, from 38 to 38 for container ships, from 228 to 279 for general cargo ships, from 98 to 112 for tanker ships, from 0 to 0 for roro ships, respectively.After 10% EPL application, the percentage of all ships meeting the reference line increased from 34.8% to 41.2%.? When 20% EPL was applied to existing ships, the num‐
ber of ships meet the required EEXI reference line increases from 11 to 38 for bulk carriers, from 38 to 44 for container ships, from 228 to 324 for general cargo ships, from 92 to137 for tanker ships, from 0 to 0 for roro ships, respective‐ly.After 20% EPL application, the percentage of all ships meeting the reference line increased from 34.8% to 50.4%.? When 30% EPL was applied to existing ships, the num‐ber of ships meet the required EEXI reference line increases from 11 to 40 for bulk carriers, from 38 to 49 for container ships, from 228 to 377 for general cargo ships, from 92 to 192 for tanker ships, from 0 to 1 for roro ships, respectively.After 30% EPL application, the percentage of all ships meeting the reference line increased from 34.8% to 61.8%.In conclusion, it was observed that more than 60% of Turkish-fleet ships do not comply with the terms and con‐ditions of the required reference line for the present.Al‐though EPL application is achieved to reach the required levels by IMO for some ships, it is not enough for all fleet ships.Apart from EPL, it is possible that additional mea‐sures would also be taken such as energy saving devices or using of alternative fuels by shipowners.Otherwise, the shipowners have no choice but to sell the vessel.All ship‐owners and manager companies should consider how they will achieve the compliance with EEXI.The decision will also depend on not only technical particulars such as the age, performance of the vessels, but also economic param‐eters as freight price fluctuations, fuel prices, expenses of the vessels.Moreover, another significant point is that the ships that have been sailing on the international waters will be classified based on their energy efficiency values in the near future (IMO, 2020d).
FundingSupported by Yildiz Technical University (YTU) Scientific Research Project Coordination Unit (SRPC) (BAPK) (Grant No.FBA-2021-4470).
Competing interestThe authors have no competing interests to de‐clare that are relevant to the content of this article.
 Journal of Marine Science and Application2023年4期
- Journal of Marine Science and Application的其它文章
- Review of Risk Analysis Studies in the Maritime LNG Sector
- Design and Optimization of an Integrated Power System of Solid Oxide Fuel Cell and Marine Low-Speed Dual-Fuel Engine
- Maritime Energy Transition: Future Fuels and Future Emissions
- Environmental and Economic Evaluation of Dual-Fuel Engine Investment of a Container Ship
- Combustion Analysis of Low-Speed Marine Engine Fueled with Biofuel
- The Potential of Inedible Biodiesel as an Eco-Friendly and Sustainable Alternative Fuel for Marine Diesel Engines in India