
Combustion Characteristics of Diesel/Butanol Blends Within a Constant Volume Combustion Chamber
2023-03-01 11:09WenhaoLiTieminXuanZhixiaHeQianWangandWeiminLi
Wenhao Li, Tiemin Xuan, Zhixia He, Qian Wang and Weimin Li
Abstract In this paper, the spray and combustion characteristics of diesel/butanol-blended fuels were studied within a high-temperature and high-pressure constant volume chamber equipped with a single-hole injector.Two blends with 80% diesel/20% butanol and 60% diesel/40% butanol mixed by volume were tested in this study.The pure diesel B0 was also tested here as a reference.The spray penetration, flame lift-off length, and soot optical thickness were obtained through high-speed schlieren imaging, OH* chemiluminescence, and diffused back-illumination extinction imaging technique, respectively.The thermogravimetric curves of different fuels were obtained through a thermogravimetric analyzer.The results showed that butanol/diesel blends presented a longer ignition delay (ID) and flame lift-off length compared with pure diesel, and such finding was mainly caused by the lower cetane number and higher latent heat of vaporization of n-butanol.With the increase in the n-butanol ratio, soot production in the combustion process decreased significantly.Given the shorter ID period, the soot distribution of pure diesel reached a steady state earlier than the blends.
Keywords Diesel/Butanol blend; Optical diagnosis; Thermogravimetric analysis; Spray characteristic; Soot formation
1 Introduction
Compressed ignition (CI) engines have been keeping a dominant position in propulsion systems (such as trucks,off-road vehicles, and ships) due to their high-power per‐formance, fuel economy, and thermal efficiency.With the development of renewable energy applications, the CI en‐gine will remain one of the critical power systems in the following decades.Especially for marine power systems,CI is difficult to be replaced with batteries in the short term due to low battery capacity and challenges for re‐charging.However, CI engines still face the challenges of increasing fuel efficiency and meeting strict emission reg‐ulations.Dealing with these challenges requires a thor‐ough understanding of the spray and combustion process in the CI engine.The study of spray mainly includes the macroscopic characteristics of the spray and its emission.The emission of particulate matter (mainly soot) has harmful effects on the atmospheric environment and hu‐man health.Understanding the formation and oxidation of soot in spray flame can guide us to optimize the fuel structure and improve combustion conditions.One effec‐tive way to reduce soot emissions is to use clean alterna‐tive fuels.Bio-alcohols, which are derived from renew‐able sources, have drawn great attention from engine re‐searchers because of their potential for clean combustion and easy application in CI engines.Butanol is one of the most popular alcohols.On the one hand, butanol can be blended with diesel in a wide range of ratios without layer separation.On the other, its diesel-like fuel properties make its application in CI engines disregard the need for large modifications (Yukio and Yoshihito, 1994; Zannis et al., 2004).However, the direct use of pure butanol in en‐gines is difficult because of its low reactivity (Lü et al.,2004).Therefore, butanol is usually mixed with a cetane reinforcer or high-cetane fuel in engineering applications(Lapuerta et al., 2008).
Yao et al.(2010) studied the performance and emis‐sion characteristics of n-butanol diesel blends in a heavyduty multi-cylinder direct injection diesel engine.The re‐sults showed that soot emission decreased significantly with the addition of n-butanol while keeping the NOxemission unchanged.The soot emission decreased fur‐ther with the increased proportion of n-butanol in the blended fuel.Rakopoulos et al.(2010a,2010b) studied the performance and exhaust emissions of n-butanol and conventional diesel blends on a four-stroke high-speed diesel engine.They observed that NOxand CO emissions decreased compared with that of pure diesel, and the more significant the proportion of butanol, the greater the reduction.On the contrary, the unburned hydrocarbon(HC) emissions in the exhaust gas increased, and the emissions continually increased as the proportion of buta‐nol increased.Do?an (2011) selected five n-butanol/die‐sel blends with different n-butanol ratios and tested each fuel on an unmodified single-cylinder four-stroke diesel engine at a speed of 2 600 r/min.The results showed that the opacity of flue gas, NOx, and CO emissions de‐creased, and HC emissions increased with the increased n-butanol content.In addition, the higher the n-butanol content, the higher the brake-specific fuel consumption and brake thermal efficiency, and the exhaust gas temper‐ature decreased with the increase in n-butanol content in the fuel.
Most studies on the effects of butanol addition on the combustion characteristics of CI engines focus on the en‐gine test rig, but limited information can be found in the fundamental research on diesel sprays and combustion.Consequently, this paper studied the spray and combus‐tion characteristics of two diesel/n-butanol blends and pure diesel in a high-temperature and high-pressure con‐stant volume combustion chamber (CVCC).The spray penetration, ignition delay (ID), OH flame lift-off length,and soot concentration distribution were quantified using multiple diagnostics.
2 Experimental setup and tools
2.1 Fuels and operating conditions
China Ⅵ 0# diesel was used as the basic fuel in the ex‐periment.The blended fuel B20 (20% butanol, 80% die‐sel by volume) and B40 (40% butanol, 60% diesel by vol‐ume) were tested, and the pure diesel B0 (100% diesel)was investigated under the same operating conditions as a reference.Table 1 shows the fuel properties of n-butanol and diesel.

Table 1 Fuel properties of n-butanol and diesel (C.Zhang et al., 2022;Tipanluisa et al., 2021; Z.Zhang et al., 2022; Csemány et al., 2022)
Table 2 displays the experimental conditions for this study.Two injection pressure (Pinj) and two ambient tem‐peratures (Ta) were used by injecting the fuel into a 15%oxygen exhaust gas recirculation environment mixed with nitrogen, and the ambient density (ρa) was kept constant at 22.8 kg/m3.For each operating condition, ten injection cy‐cles were recorded to reduce the uncertainties caused by cycle-to-cycle scattering.
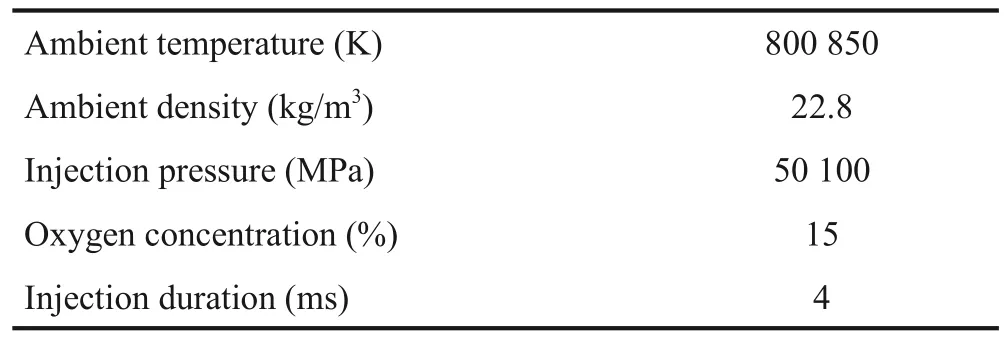
Table 2 Experiment conditions
2.2 Constant volume combustion chamber
All the experiments were conducted in an optically ac‐cessible CVCC, which can simulate the thermodynamic conditions of CI engines at the top dead center position.A heating element was installed at the bottom of the chamber to provide a high-temperature environment of 900 K.An external high-pressure gas storage cylinder provided the internal gas environment of the combustion chamber, and the maximum pressure can reach 6 MPa(Zhong et al., 2019a; Li et al., 2017).A Bosch high-pres‐sure common-rail system, where the injection pressure can reach 170 MPa, was applied to inject the fuel into the CVCC.A single-hole injector (120 μm in diameter) was equipped at the top center of the chamber to allow the spray to penetrate from top to bottom.Four windows with a diameter of 100 mm were arranged around the chamber orthogonality.To avoid high-temperature dam‐age to the glass window and keep a constant nozzle tip temperature, we inserted a cooling system into the cham‐ber around the injector and the optical window by run‐ning a continuous flow of ethylene glycol (Xuan et al,2018; Xuan et al, 2020a).
2.3 Optical techniques and image processing
Three optical diagnostic methods were used in this study: high-speed schlieren imaging, OH* chemilumines‐cence method, and diffused back-illumination extinction imaging technique.OH* chemiluminescence and highspeed schlieren imaging tests were performed simultane‐ously.Figures 1(a) and 1(b) show the optical path ar‐rangement of schlieren, OH* chemical luminescence and diffused background-illumination extinction imaging(DBI).Table 3 presents the camera parameters of the three optical diagnostic methods.
The schlieren method is based on the refraction of paral‐lel light after passing through a non-uniform medium due to density fluctuation.Density changes in the spray area are converted into image brightness changes.With this phenomenon and a high-speed camera, the spray area canbe easily distinguished from the ambient atmosphere of the combustion chamber.Figure 1(a) shows a schematic of the schlieren optical setup.The optical layout of the schlie‐ren method setup can be divided into light path and acqui‐sition system.In the light path arrangement, the point light source was scattered into parallel light after passing through a spherical lens mounted next to the chamber.The light beam was refracted due to the density change after passing through the spray area.The refracted light was then refocused by another spherical lens placed on the oth‐er side of the chamber and cut off by the schlieren stop placed at the Fourier plane.As the soot radiation spectrum is mostly located in the red and infrared regions, a bandpass filter (410–490 nm) was installed in front of the highspeed camera to eliminate the influence of soot radiation and environmental stray light on schlieren effect.Finally,the light was collected by a high-speed camera (Photron SA-Z) running at 60 000 frames per second (f/s).The schlieren images were first corrected by dynamic back‐ground subtraction and processed following an intensitybased criterion to quantify the spray tip penetration (Bena‐jes et al., 2013), which was defined as the distance from the furthest position point on the spray contour to the noz‐zle orifice.Figure 2 shows an example of the processed schlieren image.
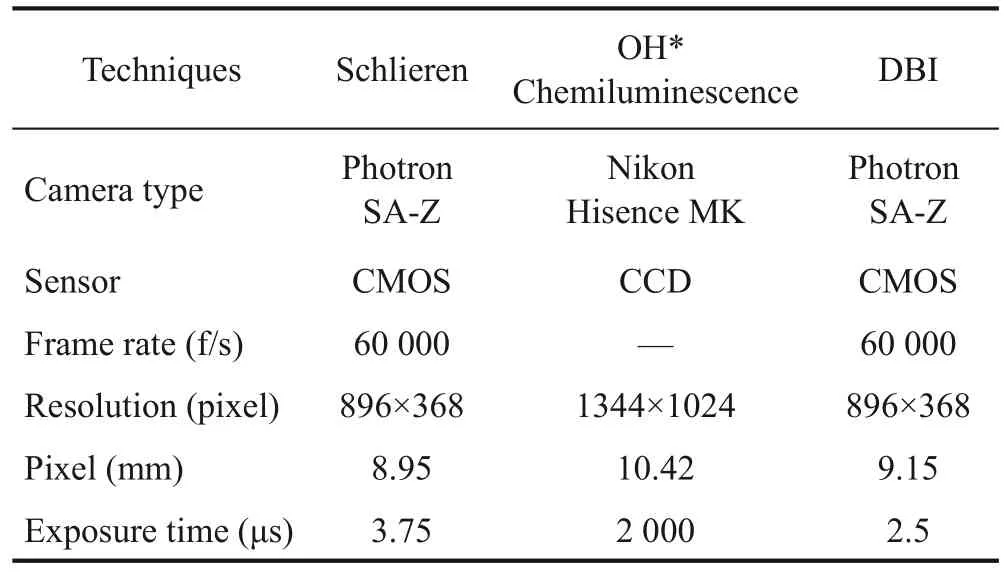
Table 3 Camera configuration

Figure 1 Schematic of the experimental setup
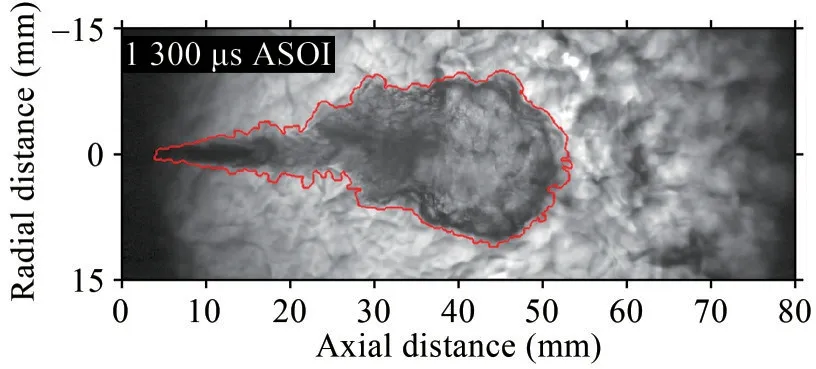
Figure 2 Schematic of processed schlieren image
Figure 3 shows the definition of flame lift-off length from OH* chemiluminescence images.The flame lift-off length (LOL) is defined as the distance from the injector tip to the initial high-temperature reaction location, and it was measured by the OH* chemiluminescence method.The OH* chemiluminescence signal can represent the high-temperature combustion zone on the stoichiometric surface, where OH* jumped from the high-energy state to the low-energy state and emitted radiation with a wave‐length of approximately 310 nm.The acquisition part of this method adopted an intensifier charge-coupled camera(ICCD) with an ultraviolet lens.When the spray flame is stable, the initial position of the high-temperature reaction location reaches a steady state.In the experiment, a bandpass filter (307±5 nm) was installed in front of the ICCD camera to avoid the interference of soot radiation.Accord‐ing to the processing method proposed by Siebers and Higgins (2001), the original image was divided into top and bottom parts along the spray axis.The position where the unilateral radiation light reached 50% of the first radi‐ation intensity peak was defined as the unilateral LOL,and the average of the top and bottom sides was the final LOL value of this individual cycle.The final presented LOL results were averages of over ten repetitions under each operating point.

Figure 3 Definition of flame lift-off length from OH* chemilumi‐nescence images
Figure 1(b) displays the DBI (Payri et al, 2015; Pastor et al, 2020) setup.A high-frequency pulse light emitting di‐ode (LED) (peak wavelength of 450 nm) and a Fresnel lens (d= 102 mm,f= 70 mm) were used to provide the parallel beam.The parallel beam then passed through an engineering diffuser (100 mm×100 mm) to form a uniform diffusion background light.A spherical lens (f= 600 mm)was placed on the other side of the chamber to collect the beam into a high-speed camera.
The camera was used to trigger the LED light source in the experiment.The frequency of the LED was set to be half of the camera frequency.Consequently, a sequence of images alternating with background light and without background light was obtained.Figure 4 shows the signal synchronization timing.When the LED is on, the light in‐tensity (I) detected by the camera equals the transmitted LED light intensity (It) plus the flame intensity (If).As the camera shooting speed is very high,Ifcan be calculated by interpolating two consecutive LED-off images with the flame intensity only.According to the Beer–Lambert prin‐ciple, the relationship between the transmittance of the soot cloud and the optical thickness (KL) value of the soot volume fraction is as follows:
whereI0is the initial light intensity of the LED back‐ground,Lis the optical path length of the background light passing through the soot cloud, andKis the average ex‐tinction coefficient on the path.
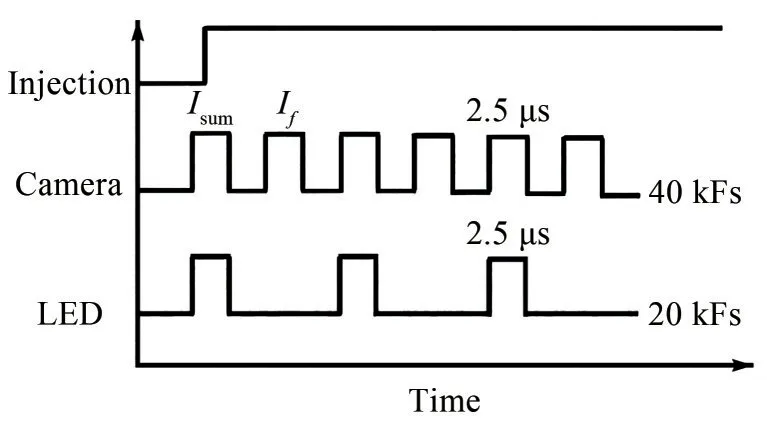
Figure 4 Schematic diagram of the pulse LED synchronization
The KL value of soot can be obtained by Eq.(1).After removing the liquid phase using soot radiation images as masks, the final soot KL image can be obtained (Figure 5).The soot mass (msoot) per pixel was finally obtained by line-of-sight integration as follows (Desantes et al., 2019):
whereρsootis assumed the soot density of 1.8 g/m3refer‐enced from Manin and Pickett (2013).λis the wavelength of the extinction method, andke= 7.61 is the dimensionless extinction coefficient calculated according to the Rayleigh–Debye–Gans (RDG) principle (K?ylü and Faeth, 1994).The parameters used for RDG approximation were refer‐enced from (Manin et al.2013) (fractal prefactor:kf= 8.36;fractal dimension:Df= 1.77; refractive index:m= 1.75?1.03i (Williams et al.2007); aggregate size:Np= 150; par‐ticle diameter:dp= 16 nm; wavelength:λ= 450 nm).

Figure 5 Example of soot KL image
3 Results and discussion
3.1 Fuel volatilization characteristics
Figure 6 presents the evaporation characteristic curves of the three fuels tested in this study.The thermogravime‐try (TG) and derivative TG (DTG) curves were divided in‐to three sections based on the weight loss rate.In the first stage, the weight loss was mainly caused by the evapora‐tion of low boiling point components in the fuel.Conse‐quently, B20 and B40 presented faster action on the weight loss due to the low boiling point of butanol, and DTG value increased with a higher portion of butanol.The weight loss rate slowed down when the weight loss ratio reached the butanol ratio of its blend oil.The second stage was the fuel pyrolysis stage.In the early period of this stage, the weight loss rates of the three fuels were almost the same, and the residues of the three fuels were mainly high-boiling-point substances.The remaining masses of the three fuels were 95% (B0), 76% (B20), and 57% (B40)of the initial mass.Given that the proportion of high-boil‐ing-point components in the initial blended oil was B0>B20>B40, as the temperature continually rose, the highboiling-point component lost weight, which resulted in the fastest evaporation rate of B0, followed by B20 and B40.The third stage was the carbonization stage, and the three kinds of fuels disappeared with the increase in tempera‐ture.Thus, the apparent difference in fuel evaporation be‐havior strongly influenced the spray mixing and later igni‐tion and combustion process.

Figure 6 Volatilization curves of all tested fuels
3.2 Spray penetration
Figure 7 presents the spray tip penetration with time af‐ter the start of injection (ASOI) under all operating points,where solid curves represent the penetration of 100 MPa cases, and the dashed curves represent those of 50 MPa cases.Each case’s corresponding ID was also presented as a vertical line.The penetration curves become flat after 68 mm because of the optical limit from the windows.The higher injection pressure resulted in a higher vapor pene‐tration due to the momentum flux.The fuel properties did not significantly influence the tip penetration before igni‐tion for the B0 and B20 fuels.The divergence can only be observed after ignition.The difference in ID resulted in different timings for the spray acceleration caused by low density within the flame.However, the B40 fuel presented a slightly lower vapor penetration forPinj= 100 MPa cases even before the ignition.This finding could have been caused by the difference in internal flow, where the differ‐ence in cavitation and discharge coefficient can affect va‐por penetration.More detailed CFD analysis still needs to be carried out.
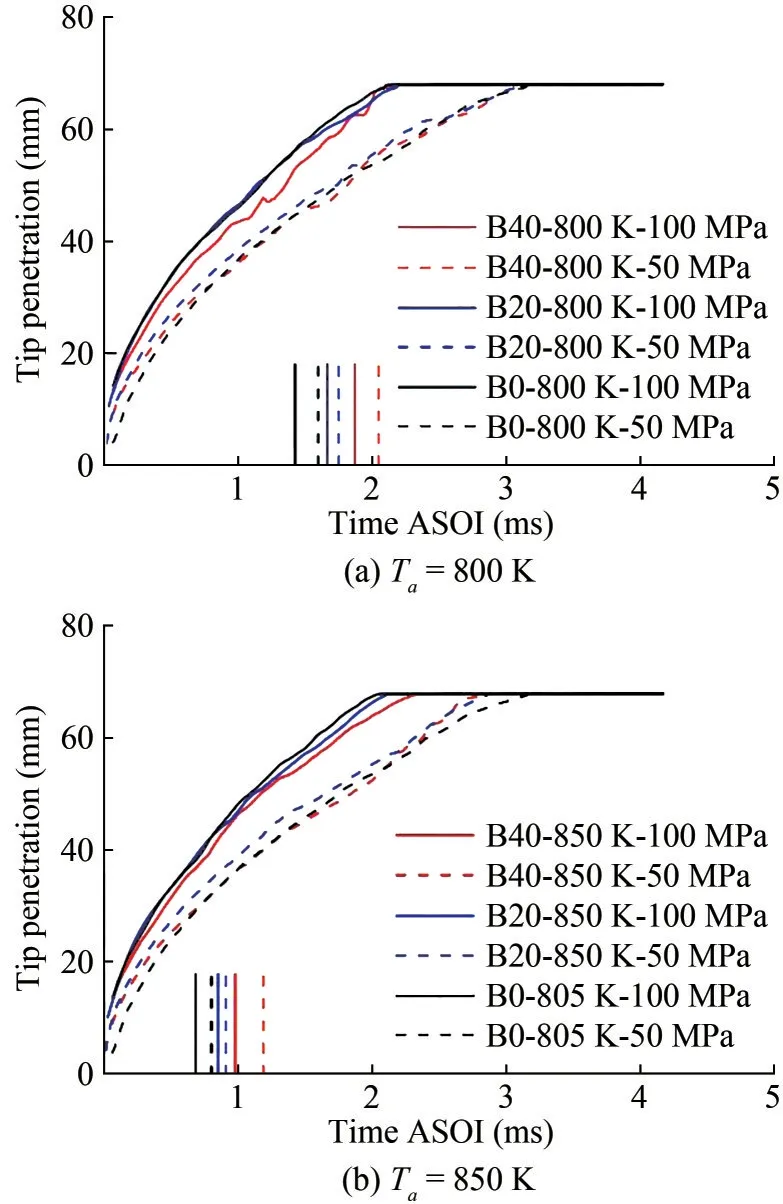
Figure 7 Tip penetration and corresponding ID under reaction conditions
3.3 ID and flame LOL
The ID period is defined as the time interval from the start of injection to the occurrence of high-temperature com‐bustion.Figure 8 presents the temporal evolution of schlie‐ren images during the ignition processes of the three fuels under operating conditions ofTa= 850 K andPinj= 100 MPa.The images on the left, middle, and right columns corre‐spond to fuels B0, B20, and B40, respectively.At 350 μs ASOI, the sprays of all fuels still behaved as non-reacting ones with a cone shape, and the tip penetrations were simi‐lar at approximately 27 mm.At 500 μs ASOI, the spray head of pure diesel (B0) became slightly transparent,which indicated its entry to the cool flame combustion stage.Subsequently, at 750 μs ASOI, the spray head of the B0 fuel turned dark again and started expanding radially,which represented the occurrence of high-temperature combustion.At this point, the spray penetration of B0 did not present a significant increase compared with the other two fuels due to the momentum conservation of the spray;this stage was defined as the stabilization phase (Desantes et al.2017).The cool flame stages of B20 and B40 oc‐curred at 750 and 900 μs after injection, respectively.At this timing position, capturing the “real” spray head against the background was difficult because the slight heat release from the cool flame caused the density gradient of the spray to become similar to that of the ambient gas.As a re‐sult, some of the spray contours were lost during image processing.At 900 and 1 100 μs ASOI, the high-tempera‐ture combustion stage occurred for the B20 and B40 fuels,respectively.With the increase in the butanol ratio, the fuel activities of B0, B20, and B40 gradually decreased, which eventually led to the delay of the two-stage ignition.

Figure 8 Time sequences of Schlieren images at Ta = 850 K and Pinj = 100 MPa
Figures 9(a) and 9(b) respectively present the ID and flame LOL of the three fuel operating conditions:Ta= 800,850 K andPinj= 100 MPa.The ID and flame LOL of the three fuels increased with a lower ambient temperature,which is consistent with that of previous research (Xuan et al., 2020b; Zhong et al., 2019b).With the decrease in tem‐perature, the IDs of B0, B20, and B40 increased by 0.53,0.45, and 0.59 ms, respectively.In addition, the LOL of B0, B20, and B40 increased by 15.13, 14.97, and 18.83 mm, respectively.The addition of more n-butanol to the blends led to a longer ID and LOL.For example, at 850 K operating conditions, the ID and LOL of the three fuels were as follows: B0: 0.69 ms and 7.20 mm, B20: 0.89 ms and 13.56 mm, and B40: 0.98 ms and 17.06 mm.The find‐ings can be explained as follows: On the one hand, the low‐er cetane number of n-butanol led to a lower reactivity of the blends.On the other hand, the high-vaporization latent heat of n-butanol contributed to a longer fuel evaporation and chemical reaction preparation, which eventually led to longer ID and LOL.Therefore, the ID and LOL of B0, B20,and B40 increased with the increase in the butanol ratio.
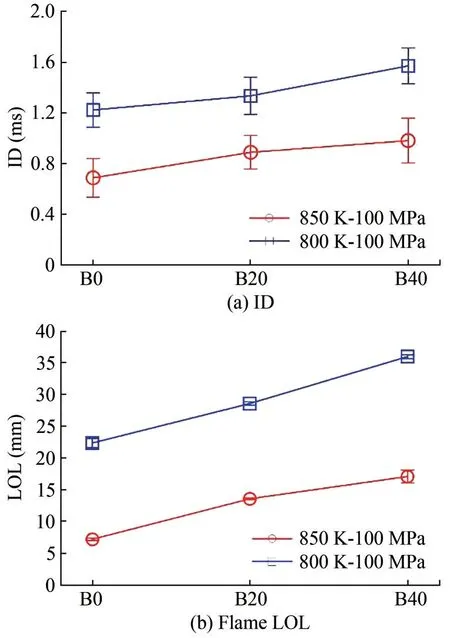
Figure 9 ID and flame LOL
3.4 In-flame soot formation
As B40 produced an extremely minute amount of soot,only B0 and B20 were analyzed for soot formation in flames.Figure 10 shows the temporal evolution of the soot KL value along the spray axis of B0 and B20 fuels atPinj=100 MPa andTa= 850 K.Five timing positions from 450 μs to 4 500 μs are given here.Figure 11 displays the corresponding two-dimensional image of the soot KL values of the two fuels at the same timing position under the same operating conditions.The spray contours are also presented in Figure 11 in red color.The soot onset of B0 (450 μs ASOI) occurred earlier than that of B20 (900 μs ASOI).This trend was consistent with the ID (Figure 9(a)).The sooting flames of both fuels stabilized after 2 000 μs ASOI,where the soot peak KL value of B0 was kept at around 1.7 on average, and that one of B20 was kept at around 1.Dur‐ing the stable stage, the high sooting area of B0 was con‐centrated downstream of 30–45 mm from the nozzle, and that of B20 was mainly located at 35–45 mm from the noz‐zle, a little further away from the nozzle because of the lon‐ger LOL.At 4 500 μs ASOI, the upstream of the soot cloud was oxidized rapidly owing to the “entrainment wave” after the end of fuel injection.The in-flame soot amount did not present a big difference at this timing position.
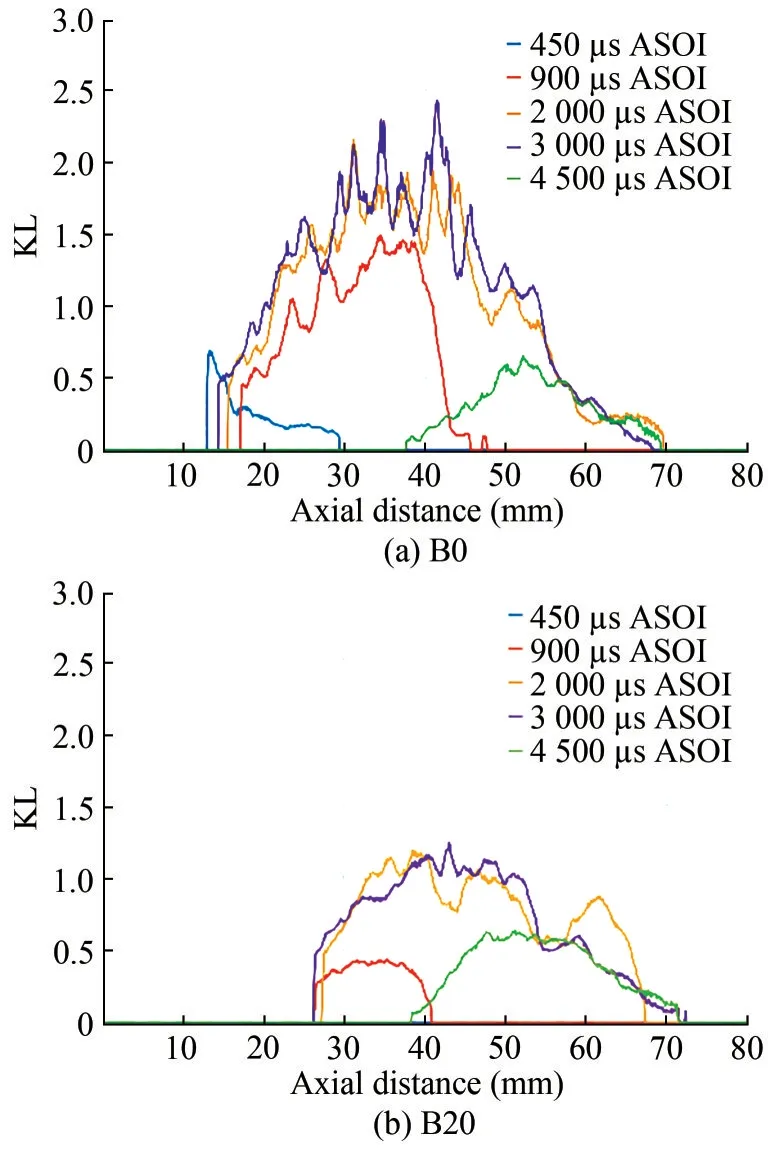
Figure 10 KL development process of different fuels on the spray axis

Figure 11 Image of soot KL value
A probability density map of soot formation over the en‐tire spray area was derived by overlapping the soot maps at all times (Figure 12).The radial widths of two probabili‐ty maps (>50% and >35%) are also presented at the bot‐tom of the figure.The initial soot formation area of B0 fu‐el was located at the spray axis of 15 mm, and that of B20 fuel was located at the spray axis of 25 mm.The main rea‐son was the shorter LOL of B0, which resulted in a consid‐erably higher equivalence ratio at the initial location of the flame.The high soot density region was located at the flame center, and the flame margin presented notably less soot probability.In general, the low probability density ar‐ea of B20 had a larger area ratio compared with B0, which meant the larger soot flame fluctuation of B20.As a conse‐quence, the sooting flame length in the axial direction of the >50% probability map was narrower (Figure 12(c)).However, this finding did not present a significant differ‐ence in the radial direction.The radials of the sooting flame (>50% probability) of both fuels were around 10 between 40–50 mm axial distance.On the other hand, the lower soot probability maps (>35% probability) did not show the same trend, where the sooting flame of B20 pre‐sented a larger area downstream in the axial and radial di‐rections.This result could have been caused by the thicker OH flame distribution owing to the contained oxygen within butanol.
Figures 13(a) and 13(b) present the total soot mass evolution during the whole injection process with 50 and 100 MPa injection pressure underTa= 850 K, respectively.The in-flame soot amount forTa= 800 K cases was small,especially for the blended fuel; thus, the results are not shown here.Soot production decreased significantly with higher injection pressure for all the fuels, which is consis‐tent with that of previous research (Xuan et al., 2021).This result was mainly caused by the longer flame LOL and shorter residence time within the high-temperature fu‐el-rich area.Moreover, the addition of more n-butanol re‐sulted in less in-flame soot production, which was consis‐tent with the engine exhaust emission tests (Zhu et al.,2023; Li et al., 2022; Bai et al., 2022).The soot mass during the quasi-steady phase was approximately 50%(40 μg to 20 μg to 10 μg) with every 20% butanol addition for thePinj= 100 MPa cases.This finding can be explained by two main reasons.The longer flame LOL (Figure 9)caused the initial position of the flame to start with a lean‐er mixture, which produced fewer soot precursors and less soot production.Moreover, butanol contains a large con‐tent of oxygen, which favored the increase in the soot oxi‐dation rate.Consequently, the in-flame soot of B0, B20,and B40 reduced gradually.

Figure 12 Probability maps of soot distribution

Figure 13 Temporal evolution of the total soot mass (Ta=850 K,ρa=22.8 kg/m3)
4 Conclusions
In this paper, the spray penetration, ID period, flame LOL, and total soot mass of B0, B20, and B40 fuels were studied by the schlieren method, diffused back-illumina‐tion extinction imaging technique, and OH* chemilumines‐cence method in a high-temperature and high-pressure CVCC.The transient soot productions of different fuels at various spray moments were compared.The main findings are as follows:
1) Under combustion conditions, the spray penetration trends of the three fuels at 800 and 850 K were the same.Meanwhile, the spray penetration rate of B0 was the fast‐est after ignition, followed by those of B20 and B40, main‐ly due to the high evaporation latent heat of butanol.
2) The ID and flame LOL of the blended fuel increased due to the decrease in the cetane number and the increase in the vaporization latent heat of the fuel caused by mixing butanol.
3) Soot formation in the flame decreased as the propor‐tion of butanol in the blended fuels increased.First, given the addition of butanol, the LOL and ID were reduced,which resulted in a later soot onset and stabilization times.The flame appeared in a thinner fuel-air mixture.Further‐more, the addition of butanol increased the oxygen content of the blended fuels, which can accelerate the oxidation rate of soot.Finally, the soot formation of butanol/diesel blended fuels was significantly reduced.
FundingSupported by the National Natural Science Foundation of China (Grant No.52276116), and Shenzhen Basic Key Research Project (Grant No.JCYJ20200109115414354).
Competing interestThe authors have no competing interests to declare that are relevant to the content of this article.
 Journal of Marine Science and Application2023年4期
- Journal of Marine Science and Application的其它文章
- Environmental and Economic Evaluation of Dual-Fuel Engine Investment of a Container Ship
- Study on Flow-induced Vibration Characteristics of 2-DOF Hydrofoil Based on Fluid-Structure Coupling Method
- Design and Optimization of an Integrated Power System of Solid Oxide Fuel Cell and Marine Low-Speed Dual-Fuel Engine
- Maritime Energy Transition: Future Fuels and Future Emissions
- Combustion Analysis of Low-Speed Marine Engine Fueled with Biofuel
- The Potential of Inedible Biodiesel as an Eco-Friendly and Sustainable Alternative Fuel for Marine Diesel Engines in India