
Towards a better understanding of pathways of multiple co-occurring erosion processes on global cropland
2023-03-22 03:46PsquBorriChristinAwYnNjcBzkYixinChnAyAmwFntArthurNicousFnrichSuryGuptFrncisMtthwsSirioMounoNiussiHrwynDviRoinsonForncTnMtthisVnmrckGrtVrstrtnDinViirPnosPnos
Psqu Borri , Christin Aw , J E.Yn , Njc Bzk , Yixin Chn ,Ay Amw Fnt , Arthur Nicous Fnrich , Sury Gupt , Frncis Mtthws ,,Sirio Mouno , Niussi Hrwyn , Dvi A.Roinson , Fornc Tn ,Mtthis Vnmrck , Grt Vrstrtn , Din C.S.Viir , Pnos Pnos
a Department of Environmental Sciences, Environmental Geosciences, University of Basel, Basel, Switzerland
b Department of Biological Environment, Kangwon National University, Chuncheon, Republic of Korea
c Department of Science, Roma Tre University, Rome, Italy
d Faculty of Civil and Geodetic Engineering, University of Ljubljana,1000, Ljubljana, Slovenia
e Department of Earth and Environmental Sciences, KU Leuven, Belgium
f International Platform for Dryland Research and Education, Tottori University, Tottori, 680-0001, Japan
g European Commission, Joint Research Centre (JRC), Ispra, Italy
h Laboratoire des Sciences Du Climat et de L'Environnement, CEA-CNRS-UVSQ-UPSACLAY, Gif sur Yvette, 91190, France i Universitˊe Paris-Saclay, INRAE, AgroParisTech, UMR SAD-APT, 91120, Palaiseau, France
j United Nation World Food Programme, 00148, Roma, Italy
k Centre for Landscape and Climate Research, School of Geography, Geology and the Environment, University of Leicester, University Road, Leicester, LE1 7RH, UK
l UK Centre for Ecology and Hydrology, Environment Centre Wales, Bangor, United Kingdom
Keywords:Modelling Multi-model approach Water Wind Gully Tillage Crop harvesting
A B S T R A C T Soil erosion is a complex process involving multiple natural and anthropic agents, causing the deterioration of multiple components comprising soil health.Here, we provide an estimate of the spatial patterns of cropland susceptibility to erosion by sheet and rill,gully,wind,tillage,and root crops harvesting and report the co-occurrence of these processes using a multi-model approach.In addition, to give a global overview of potential future changes, we identify the locations where these multiple concurrent soil erosion processes may be expected to intersect with projected dry/wet climate changes by 2070.Of a modelled 1.48 billion hectares (B ha) of global cropland, our results indicate that 0.56 B ha (~36% of the total area)are highly susceptible(classes 4 and 5)to a single erosion process,0.27 B ha(~18%of the total area) to two processes and 0.02 B ha (1.4% of the total area) to three or more processes.An estimated 0.82 B ha of croplands are susceptible to possible increases in water (0.68 B ha) and wind (0.14 B ha)erosion.We contend that the presented set of estimates represents a basis for enhancing our foundational knowledge on the geography of soil erosion at the global scale.The generated insight on multiple erosion processes can be a useful starting point for decision-makers working with ex-post and ex-ante policy evaluation of the UN Sustainable Development Goal 15(Life on Land) activities.Scientifically, this work provides the hitherto most comprehensive assessment of soil erosion risks at the global scale,based on state-of-the-art models.
1.Introduction
Despite being on the UN global agenda for a long time (UNEP,1982), accelerated forms of soil erosion are still today one of the main socio-environmental threats driving land degradation across the world(de Jong et al.,2011;Pr?av?alie et al.,2021),with important impacts on crop production, water quality, soil biodiversity, and biogeochemical cycles (Simmonds et al., 2022).With the onset of the United Nations (UN) Decade on Ecosystem Restoration(2021-2030),which aims“to halt the degradation of ecosystems,and restore them to achieve global goals” by 2030 (Farrell et al., 2022),and the Food and Agriculture Organization of the United Nations(FAO) calling for actions to stop soil erosion (FAO, 2019; Panagos et al., 2020), significant efforts have been taken to address these challenges.However,the lack of information about the possible cooccurrence of different processes at global scale can represent a concrete limitation for the achievement of multiple targets of the UN program,in particular the UN Sustainable Development Goal 2(Zero Hunger), Goal 6 (Clean water and sanitation), Goal 13(Climate action), and Goal 15 (Life on land) (Keesstra et al., 2016).
According to a meta-analysis of peer-reviewed research literature on soil erosion modelling published from 1996 to 2017(Borrelli et al.,2021),the basis of knowledge on global soil erosion dynamics rests on about ten studies: eight on water erosion (rill and interrill processes), one on wind erosion and one on tillage erosion (Table 1).Two new global scale studies were published after 2017,focusing on quantitative wind erosion(Yang et al.,2022)and soil loss potential due to root crops harvesting(Kuhwald et al.,2022).Further, despite the well-established use of geospatial technologies like Geographic Information Systems (GIS), spatial interpolation techniques, the increase of computer process power,machine learning algorithms, and the ever-growing range of environmental data,we are still faced with(i)a limited number of global assessments of soil erosion processes other than rill and interrill erosion and(ii)a lack of attempts to couple existing global assessments to gain insights on global co-occurrence and potential mutual reinforcement of soil erosion processes.The lack of new comprehensive knowledge on global soil erosion dynamics leaves many scientists and conservation actors across the world to resort still today to pioneering global studies carried out in the late 1980s and early 1990s, such as UNEP's project Global Assessment of Soil Degradation (GLASOD) (Oldeman,1994).Despite being based on a static observation approach and outdated information (Sonneveld& Dent, 2009), GLASOD remains the only accessible assessment reporting both possible spatial patterns and intensities of more than one soil erosion process at global scale(i.e.,for wind and water erosion).
A recent attempt to go beyond GLASOD and to gain a better and up to date understanding on the geography and socioenvironmental conditions of global erosion processes was launched by the Sixth Session of the Global Soil Partnership (GSP)Plenary Assembly which, under the solicitation of the Intergovernmental Technical Panel on Soils (ITPS), voted in favour of a resolution to put the development of a new UN country-driven global soil-erosion assessment on the agenda for 2019-2023(FAO,2019).The GSP Secretariat at FAO,after gathering more than 500 soil erosion experts during the UN Global Symposium on Soil Erosion(GSER19),started to coordinate a joined international effort to develop this new global assessment named UN-Global Soil Erosion mapping project (UN-GSERmap) (FAO, 2020).This UN initiative is structured along three fundamental research themes:Theme 1: Soil erosion assessment tools and data; creation,consolidation,and harmonization;Theme 2:Policies and practices in action to address soil erosion; and Theme 3: The economics of soil erosion prevention, management, and remediation.Theme 1 foresaw the development of a global assessment of water,wind and tillage erosion based on a multi-modelling approach, a first concrete step towards a new global assessment of soil degradation based on multiple co-occurring processes.Unlike previous UN mapping assessments carried out in the 1990's based on expert judgments,such as GLASOD(Oldeman,1994),this new assessment will substantially rely on modelling supported by field and remote sensing monitoring activities.The methodology for Theme 1 discussed at the FAO headquarters in Rome was conceptualized along a multi-phase structure, with the overall goal to spatially identify and quantify land exposed to different degrees of erosion using varying levels of accuracy and harmonization according to the individual phases and spatial scales of the assessment (Box 1) (FAO,2019).In a recent meeting of the GSP (FAO, 2022), however, the coordinator of the UN-GSERmapcommunicated that the global mapping will no longer include top-down modelling, as originally planned for the Phase-1, resulting instead from mosaicking operations of national-scale studies carried out by national experts.
Whilst there is a tendency to move towards bottom-up collaborative approaches for future global assessments through mosaicking national-scale studies carried out by national experts(FAO,2022),we argue that such an approach will lead to incoherent results at the global scale due to differences in data collections and analysis techniques.On the contrary, given the state-of-the-art, a top-down approach whereby a multitude of soil erosion processes are assessed over the entire globe using a consistent methodology is required to narrow current gaps of knowledge at a global scale and to support comparisons across national borders.Accordingly,with the intention of contributing to the UN initiative, we present here a novel data driven global assessment of the spatial distribution of multiple co-occurring soil erosion processes (i.e., interrill and rill, gully, tillage, wind, and (root or tuber) crop harvesting),based on a combination of individual soil erosion processes assessments.We used globally consistent datasets in order to guarantee the level of data harmonization recommended in the original guidelines defined during the UN Global Symposium on Soil Erosion (FAO, 2019).The proposed modelling approach is structured along two overall objectives, which are to (i) enhance ourknowledge on the geography and co-occurrence of multiple soil erosion processes based on state-of-the-art,data-driven modelling,and(ii)acquire insights on the possible effects of the future climate projections on spatial patterns in soil erosion processes.

Table 1 Lists of the global scale soil erosion assessments reported in peer reviewed literature.
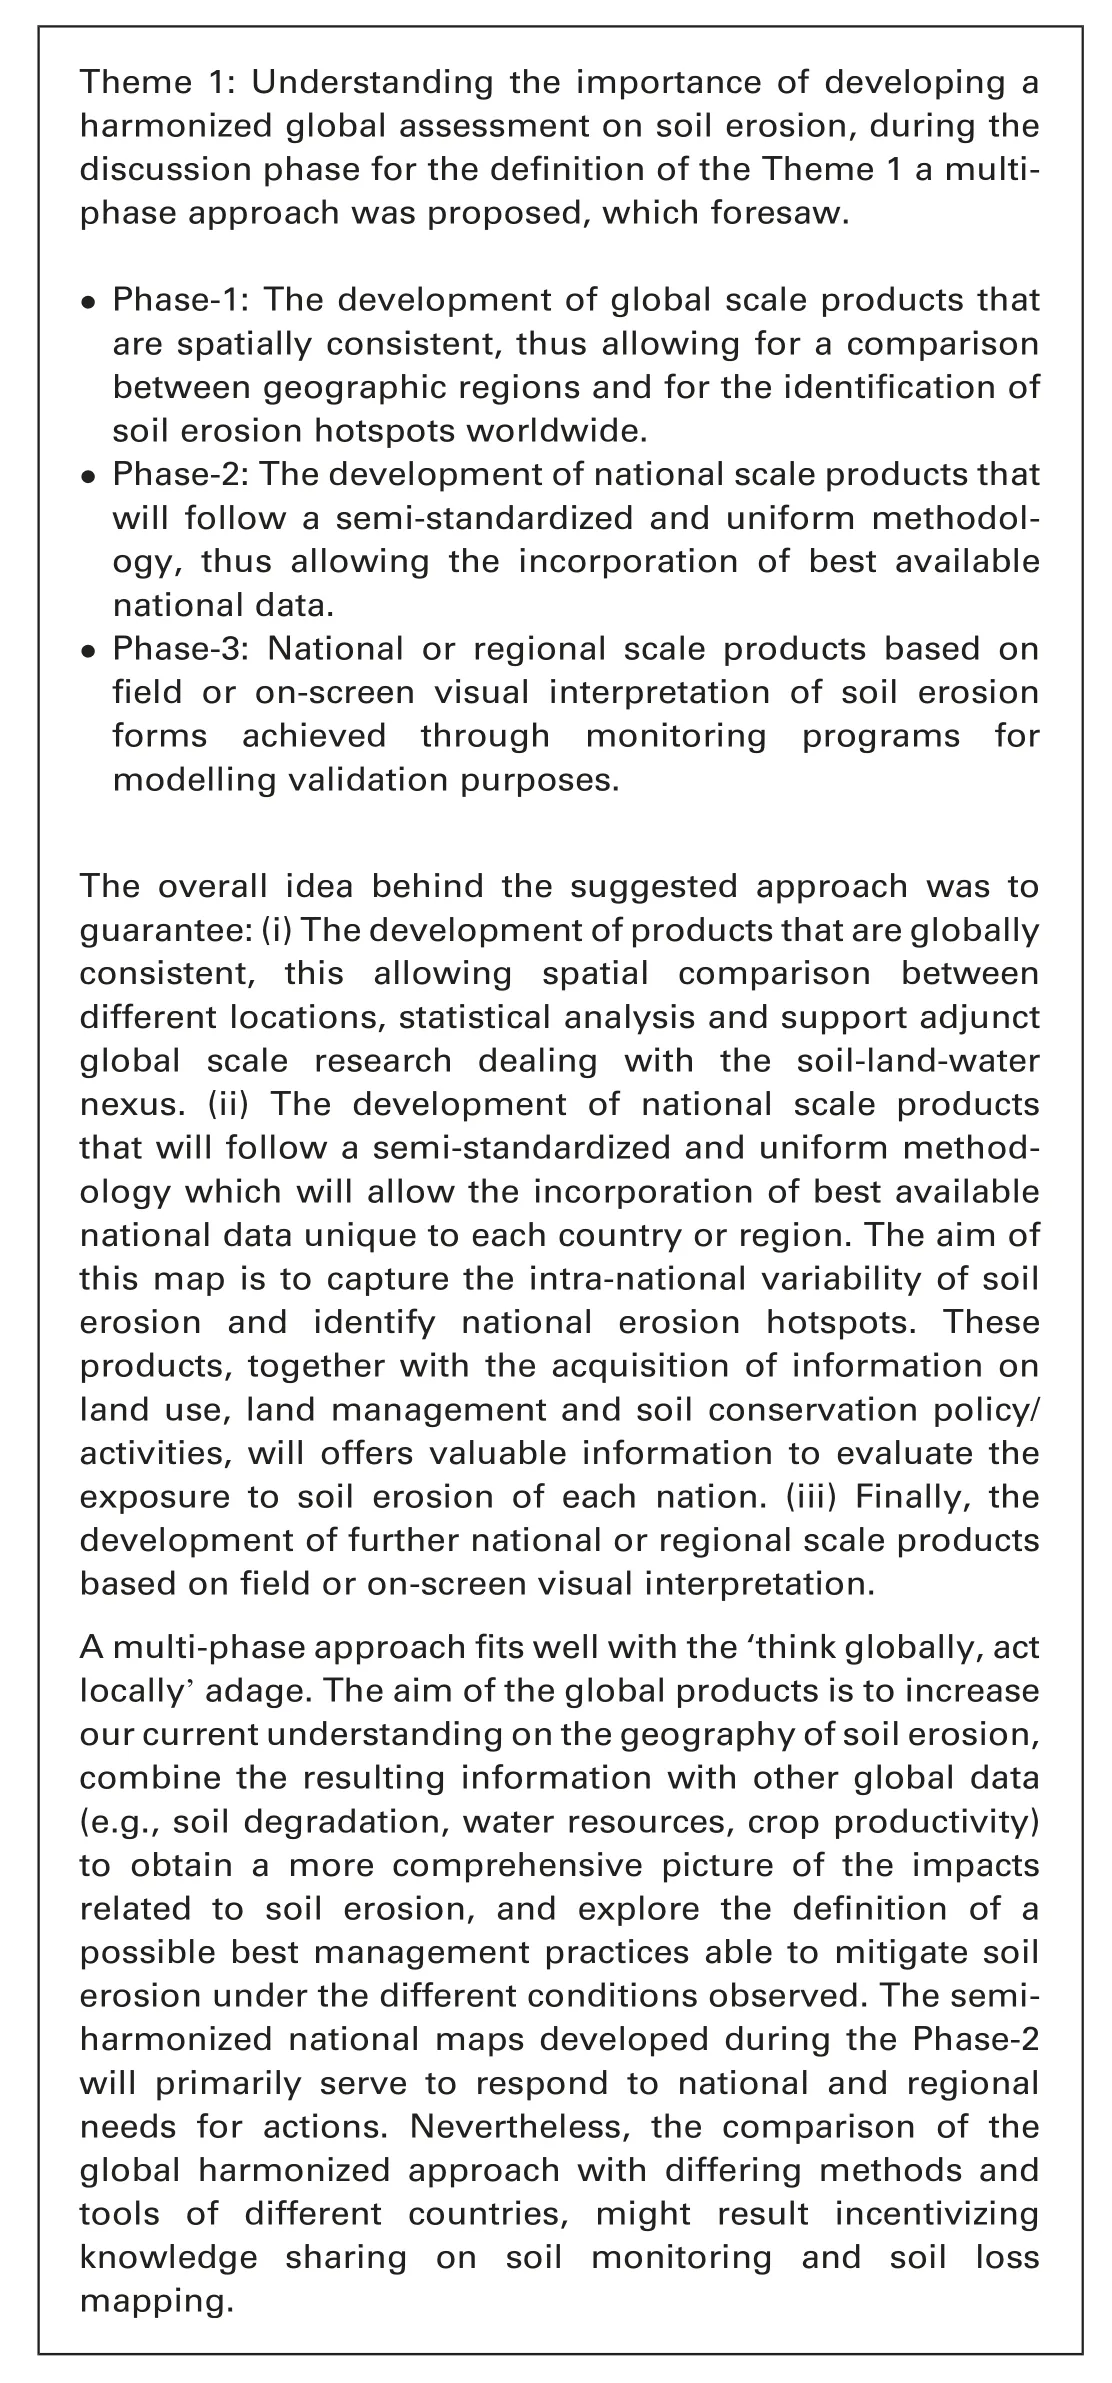
Box 1 Conceptual scheme of the UN-GSERmap project
2.Materials and methods
The modelling framework that we propose in this study targets the development of a multi-process soil erosion assessment at a global scale, as earlier proposed during the technical group discussion of the GSER19 symposium.Accordingly, we used globally consistent datasets to allow for a comparison between geographic regions and for the identification of possible global soil erosion hotspots.In addition to the three soil erosion processes taken into consideration in the UN-GSERmapproject (i.e., interrill and rill erosion, tillage erosion, and wind erosion), we included further processes (i.e., gully erosion and (root or tuber) crop harvesting erosion) in the analysis using the recent gully erosion global assessment developed by Vanmaercke et al., 2022, 2020).The Materials and Methods section is structured along the two overall objectives of the study to:(i)identify,according to our knowledge of the present day situation,areas in which a single process appears to be relevant, or areas in which multiple processes may be operating simultaneously (Chapter 2.2); (ii) cross compare these modelling results with future climate projections to gain insights on the effects of possible increased extreme weather events.Objective (ii) is addressed by spatially defining areas in which a future increase in wetter or dryer periods may affect the spatial patterns of these different erosion processes in the future(Chapter 2.3).
2.1.Modelling land susceptibility to multiple soil erosion processes
Here we report some key notions about the proposed global soil erosion assessments, merging multiple globally consistent predictive layers to formulate risk indices.A detailed description of the technical specifications of each individual assessment is provided in the Supplementary Methods.
The five soil erosion processes that we considered are:(i)water erosion due to interrill and rill (based on Borrelli, Robinson, et al.,2017); (ii) water erosion due to gully (based on Vanmaercke et al.(2020; Vanmaercke et al., 2022); (iii) tillage erosion (based on Van Oost et al.(2009)); (iv) wind erosion (based on Borrelli,Robinson, et al., 2017), and (iv) (root or tuber) crop harvesting erosion (in short SLCH) (based on Panagos et al., 2019).Hereafter,we refer to these processes as water, gully, tillage, wind erosion,and SLCH,respectively.All models constitute simple approaches to derive plausible spatial classifications of soil erosion magnitude.It must be stressed that the units of the modelling output differ for gully and wind erosion compared to the other processes.The global estimates of soil erosion due to water,tillage,and SLCH erosion are computed as a mass of soil displaced per unit area and time (Mg ha-1yr-1), averaged over a period of years to decades.These estimates do not consider the potential distances over which soil is displaced.The global occurrence of wind and gully erosion is estimated as susceptibility,expressed as a unitless score ranging from 0 to 1.As such, we are comparing and evaluating erosion susceptibility classes rather than absolute soil displacement.We applied different classification methods for the quantitative(water,tillage,and SLCH)and qualitative(wind and gully)estimates.In both cases,we defined five classes of risk, i.e., Class 1 = very low, Class 2=relatively low,Class 3=moderate,Class 4=relatively high and Class 5=very high.For the three quantitative models,we applied a pre-defined set of thresholds (0-2.5; 2.5-5; 5-10; 10-20;>20 Mg ha-1yr-1),while for the susceptibility models we applied a quantile classification method.
When estimating soil erosion potential for these soil erosion processes, we first considered a hypothetical consistent land-use scenario for the entire Earth's surface.More precisely, we assumed the application of annual mechanized tillage followed by crop plantation(common wheat)on all land,which de facto makes the entire modelled land (e.g., the entire terrestrial globe) as potential cropland.Only large waterbodies were removed from the modelled area, while rock outcrops could not be spatially defined due to lack of information at a global level.This hypothetical landuse scenario was intended to homogenously quantify the susceptibility to erosion processes across the globe, under theoretical farming use.Secondly, we restricted our areas of interest to the portions of global lands with potential or actual cropland use,which will be described below as intrinsic and actual scenarios.This cropland scenario does not apply for the gully erosion assessment, which relies on a machine learning extrapolation of onscreen mapped features and actual land-use conditions to produce a global layer for the actual land-use condition.A similar condition applies for the SLCH assessment, which is described in the Supplementary Methods, and is assumed to be sugar beet,instead of the wheat scenario used for water, wind, and tillage.To spatially harmonize the five individual modelling assessments,we(i) resampled each assessment to a grid cell resolution of~1000×1000 m2(which is a multiple of the ~250 m grid cells of the utilized MODIS data) and (ii) defined the spatial extent of the modelled area such that each soil erosion assessment spatially matches the 156.7 million grid cells into which the global land was subdivided.
We considered two distinct modelling areas to spatially describe what we called the intrinsic and actual scenarios.We defined the spatial extent of the intrinsic scenario (Fig.1a), which models the susceptibility of the total land considered suitable for croplands,by using the global crop suitability index proposed by Zabel et al.(2014), a gridded dataset expressing the crop suitability based on a set of 16 plants under rainfed and irrigation conditions for a reference period covering 1981-2010, with a spatial resolution of 30 arcsec(~1 km).By contrast,we defined the spatial extent of the actual scenario (Fig.1b) by the cropland as defined by the Copernicus Global Land Cover Layer(CGLS-LC100 collection 3)(Buchhorn et al., 2021) for the reference year 2019.Accordingly, the intrinsic and actual scenarios consist of 76.7(55%of the total land)and 33.4(24%of the total land;9.4%of the total land based on the cropland pixel fractional share)million grid cells,respectively.The modelled global cropland accounts for ~1.46 billion ha of the modelled Earth's land area.This cropland surface value is slightly smaller than the one reported by FAOSTAT(https://www.fao.org/faostat/en/),which in 2020 was equal to 1.56 billion ha.
2.2.Insights on the possible future changes in water and wind erosion susceptibility
For this analysis, we applied the methodology proposed by Borrelli et al.(2022a),where it is assumed that,in simplistic terms,the changes in rainfall amounts may mitigate the threat from erosion in some areas and,vice versa,exacerbate it in others.More precisely, we assume that where wetter projections (i.e., quarters)intersect with areas vulnerable to water erosion, it will result in a possible exacerbation of this erosion process.By contrast, where driest projections intersect with areas vulnerable to water erosion,a possible mitigation of this erosion process is considered.The same dynamic is true for wind erosion, but with an inverse function, where drier projections intersect areas vulnerable to wind erosion, it will result in a possible exacerbation of wind erosion.Vice versa, we assume that soil erosion due to wind tends to decrease where dry areas become wetter as the result of the increase of soil moisture that influences the force of cohesion and adhesion between water molecules and the soil particles.
Here, we propose an analysis to gain insights on changes in future patterns of water and wind erosion susceptibility globally based on the comparison of measured(1970-2000)and projected(2061-2080) long-term rainfall data.Of the considered erosion processes in this study, water (rill, interill and gully) and wind erosion are strongly governed by hydroclimatic and land surface conditions, allowing the inference of future trends based on comparable hydroclimatic layers.For both climatic periods we used WorldClim data(Fick&Hijmans,2017),in particular the WorldClim bioclimatic variable BIO16 (precipitation of wettest quarter) and BIO17 (precipitation of driest quarter).For the future projections,we used the average values obtained combining the bioclimatic variables BIO16 and BIO17 of eight General Climate Models(GCMs).We selected the future climate scenario derived from the Coupled Model Intercomparison Project Phase 6 (CMIP6) scenario SSP245,an update to scenario RCP4.5 known as ‘middle of the road’ scenario (Fricko et al., 2017).In the analysis, we assumed that soil erosion by water will be reinforced in areas that persistently receive more precipitation, whereas areas getting drier will be more vulnerable to wind erosion.We reported a potential increase or decrease of future erosion where changes between the two considered periods are larger than ±5%.
2.3.Model performance evaluation
We subjected the outcome of three of the five proposed modelling approaches to an evaluation procedure to gain insights on the performance of the models.We conducted overlay analyses to determine the distribution of reference locations into the five classes of land susceptibility to erosion.The underlying validation criteria is that the field observations on wind (Borrelli et al., 2017)and gully erosion (Borrelli et al., 2022b) are likely distributed in areas where these processes are relevant and,consequently,where the model should also predict high soil losses.Field observations on wind and gully erosion rest on qualitative observations, i.e., the presence of erosion.By contrast, the water erosion dataset compiled by García-Ruiz et al.(2015)reports measured soil erosion rates.In this later case, we only considered the cropland sites reporting measured erosion rates (plot or hillslope) above 5 Mg ha-1yr-1.We limited the evaluation procedure to the geographic extent of the Europe due to data limitation.
3.Results
3.1.Geography and potential co-occurrence of soil erosion processes
The five maps of land susceptibility to soil erosion shown in Fig.2 provide modelling estimates for a global land surface covering 187 countries, corresponding to ~8.2 billion km2(~55% of the Earth's land surface under the intrinsic scenario).The land susceptibility of each process was ranked into five classes, from very low to very high values.When we consider the overall land susceptibility to the five soil erosion processes,18.5 and 25.6% of the modelled area were found to be characterized by relatively low and moderate values,respectively,whereas 9.1 and 9%were found to be characterized by relatively high and very high values,respectively.Very low susceptibility was modelled for the remaining 37.8%of the global land.
When observed individually, wind erosion susceptibility patterns suggest a subdivision of the global surface into six noncontinuous macro regions encompassing all observed continents(Fig.2).Sizable areas with very high susceptibility(class 5)to wind erosion(~6%of the total land)include the surroundings of the great sandy deserts of the Sahara and the Arabian Desert, Southern Africa,Western Australia,the Interior West of the USA,and,to a lesser extent, Asian regions across Iraq, Iran, Uzbekistan and the Patagonian Desert in South America.Areas characterized by moderate to high values (susceptibility classes 3-4) comprise widespread portions of Australia,the Interior West and Southwest of the USA,the surroundings of the Sahara and the Arabian Desert, the Kalahari and Namib Deserts in Africa, Easter African countries, Northeast China, and the Atacama Desert in South America.Extended areas characterized by relatively low to moderate susceptibility values(classes 2-3)can be observed in large parts of the West and South USA, the Canadian Prairies, Northern Mexico, large sectors of Argentina, Paraguay, Bolivia and Venezuela, diffusely in Sub-Saharan Africa, most of the area of eastern states of Australia and Northeast China, around the three major Asian deserts (Turkestan Desert,Great Indian Desert,Gobi Desert in Asia),and sizable areas near the coasts in Southern and Northern Europe.Finally,very low wind erosion susceptibility region (class 1) characterizes the remaining ~55% of the total land.We observe a spatial affinity between the susceptibility patterns of wind erosion and gully erosion leading to local co-occurrence, particularly in the regions of the Sahara, the Arabian Peninsula, the Andes, Western USA, and Namibia.Dry areas characterized by limited vegetation cover,which tend to incentive the erosive action of wind and channelled water.
Regarding water erosion, the estimated susceptibility patterns indicate a process which is largely distributed globally.The predicted spatial patterns of water erosion classes tend to do not co-occur with wind and gully erosion estimates across the world.Such complementary patterns of these soil erosion processes are remarkably evident in Africa, South America, North America, and,to a lesser extent,in Asia,Europe,and Oceania.When water(sheet and rill) erosion susceptibility classes are considered, high susceptibility to water erosion is predicted to affect vast shares of the Tropical regions of South America, Africa, and Asia, as well as Central America,the US,the Mediterranean region,India,China and Korea.Relatively high to very high susceptibility classes were predicted for ~37%of the total land,more than SLCH(0%),wind(~13%),and tillage (~4.6%) erosion, but less than gully erosion (~39%).Relatively high to very high values of tillage erosion are associated with the mountain chains, where steeper slopes render these regions particularly susceptible to this kind of erosion process.As for SLCH, areas more susceptible to this process are found in North America, Europe, Eastern and South-central Asia, and widespread regions of South America.Specific soil texture conditions(e.g.,clay or loam) found in South America, on top of root and tuber crop farming and specific farming practices (e.g., highly engineered machine farming) may explain the particularly high susceptibility patterns we observe in this region.An overview of the land susceptibility classes associated to each soil erosion process is provided in Table 2.
In terms of soil erosion rates in croplands (actual scenario)(Fig.3),a very high susceptibility class-5 of water erosion is de facto remarkably more spatially widespread than the class-5 prediction for Tillage (~1%) or SLCH erosion (0%).It is also likely to be higher than the qualitative values predicted for wind erosion(value=0.15 dimensionless, ~5% of the modelled area).When analyzing the spatial footprint of each erosion process in cropland, 68% of the global farming landscape may be susceptible to SLCH (i.e., moderate or higher values; classes 3-5).A very large share of the modelled area was classified as moderately susceptible.It is worth stressing that the provided statistics rank each individual process according to its own soil erosion potential, and not in absolute terms.As such, the range of SLCH predictions is rather small, i.e.,min=1.8 Mg ha-1yr-1;max=7.5 Mg ha-1yr-1.With an estimated footprint of ~50%of the modelled global cropland,high to very high susceptibility to gully erosion was found to be the second spatially dominant erosion process in the actual global cropland.Classes 4-5 of water,wind,and tillage erosion are estimated for ~27%,~11%,and~3% of the modelled global cropland, respectively, but with important differences in spatial patterns and across the continents.
Fig.4 illustrates the spatial pattern of estimated land susceptibility to multiple erosion processes across the world's croplands.When considering the co-occurrence of moderate to higher susceptibility (classes 3-5) across all erosion processes, we see that,while croplands are generally affected by at least one degradation process on all continents, in extremely few cases they are affected by five processes simultaneously.
It is worth noting that a certain value for the sum of all susceptibility classes might substantially underestimate the overall real world risk class, since erosion processes might enhance one another, thus triggering positive feedback loops.An area prone to wind erosion might for instance have enhanced water erosion during winter/heavy rain fall/snow melt.Similarly, an area with high tillage erosion such as a hilltop,might be very prone to water and wind erosion due to the heavily damaged soil structure.However, it is important to further stress that this multiple assessment combines simulations of each process computed separately, lacking the ability to represent synergism between processes including their interactions.
3.2.Projections of possible future patterns of global water and wind erosion processes
Given that most soil erosion processes,and especially water and wind erosion,are driven by weather conditions,it is highly relevant also to compare the spatial patterns of our multi-process soil erosion estimates with those under projected changes in weather.Following the approach of Borrelli et al.(2022a),we anticipate that soil erosion by water will be reinforced in areas that get persistently wetter, while areas getting drier may become more vulnerable to wind erosion.We propose that areas already vulnerable to water and wind erosion processes,that are intersecting with areas where the wettest quarter becomes wetter and driest quarter drier,will be the most vulnerable and will have the highest risk.

Fig.3.Global spatial representation of the analysed soil erosion susceptibility processes in actual(scenario)cropland,i.e.,(a)water erosion due to interrill and rill,(b)wind erosion,(c) tillage erosion, (d) gully erosion, and (e) SLCH erosion.Modelled values are classified from very low (class 1) to very high (class 5).
Our analysis(Fig.5)identifies the subtropical and the temperate climate zones as being the locations most vulnerable to water erosion with increasing weather extremes during the wettest quarter.In the African continent, the vast majority of increase in water erosion vulnerability is expected to occur around the central belt of the Tropical savanna (Aw, K¨oppen-Geiger climate classification based on Beck et al.(2018)), which also contains the area with the highest population density in Africa.Areas with very high population density in Asia, such as the Tropical savanna of India,Thailand, Cambodia, Vietnam and Myanmar, will also face a potential increase in water erosion vulnerability.Extensive increases are also predicted to occur on the Tropical rainforest zones of Indonesia and Malaysia,potentially exacerbated by the substantial land uses changes due to palm oil production.Still in Asia,increases in water erosion vulnerability will affect vast areas of the Temperate(K¨oppen-Geiger Cfa, Cwa) as well as Cold (K¨oppen-Geiger Dwa,Dwb) climates of India, China, Korea and Japan due to high increases of rainfall erosivity.In Europe, as previously described by Borrelli et al.(2022a),the vulnerability to water erosion is predicted to increase in a widespread region covering most of central Eastern Europe under Temperate(Cfb)and Cold(Dfb)climates,i.e.,France,Germany, the United Kingdom, Austria, Hungary and Romania.A large region of increased water erosion vulnerability is also estimated in North America, covering different climate zones ranging from Arid(BSk),Temperate(Cfa)to Cold(Dfa)climates in the US.In South America,increases are predicted along the Northern Andean chain and the Temperate (Cfa) zones of Argentina, Uruguay and Brazil.By contrast, noteworthy decreases in water erosion vulnerability are diffusely predicted in coastal areas near the Mediterranean Sea, the Amazonian basin, Central America and Southeast Africa.

Fig.4.Co-occurrence of different soil erosion processes (by water, wind, gully, tillage and harvesting) in the 1 × 1 km2 cell size grid.
Concerning wind erosion,in Europe the Mediterranean climate domain possesses the most vulnerable areas due to increased drought during the driest quarter.Specifically, regions showing higher vulnerability to wind erosion are central eastern Spain,southern Italy,Greece,Turkey,Bulgaria,the Mediterranean coast in Provence and the French and English coastal areas near the English Channel.In Africa,the coastal areas of Morocco,Algeria and Tunisia show potential increase in wind erosion vulnerability, as well as large sections of Southeast Africa.In Oceania, a large portion of Australia's Queensland and New South Wales and, to a lesser extent, Southwestern Australia may be affected by an increase in wind erosion vulnerability.Increases in wind erosion vulnerability are also expected for the South and Southwest regions of US,South Chile, and Paraguay.Overall, these increases seem to be fairly counterbalanced by areas of vast decrease in wind erosion encompassing all observed continents.
Similar to our present-day multi-process erosion vulnerability estimates,we note that projecting future overall erosion risk as the sum of individual erosion process risks is likely to underestimate the real-world risk due to positive feedback loops triggered by the co-occurrence of degradational processes itself.
3.3.Model performances
The best dataset available for assessing model performance consists of presence-only observations of erosion events across Europe.While such information is helpful for evaluating our model's true positive rate, it does not allow assessing the false positive rate without further simplifying assumptions,such as that a sample of background locations does not contain any erosion event (Hastie and Fithian, 2013).In order to avoid such assumptions, we opted to focus on describing how the available data falls inside the classes used in this work.A total of 210,152, and 53 locations were employed for the evaluation of the performances of the gully, wind, and water erosion modelling, respectively.The cross-check results show that the areas that were predicted as susceptible to moderate or higher erosion coincide well with the reference field observations.Numerically, we observed that 285(69%) of the 416 locations reported in literature were classified as having high and very high susceptibility (classes 4-5), while another 42 (10%) fell into areas defined as having moderate susceptibility(class 3)(Fig.6).Cumulatively,79%of the observed sites showing erosion evidence on the ground fell into areas classified by our modelling as being moderately to very highly susceptible to erosion.The remaining 89 (21%) observation sites fell into areas classified by the models as having very low and low susceptibility to soil erosion.These sites,which are part of the 152 wind erosion observation sites, all rest on qualitative field observations.Excluding wind erosion,the overall field observation sites classified by our models as having moderate to very high susceptibility would raise to 89%(93% if only gully erosion is considered).
4.Discussion
The proposed modelling approach constitutes a first step towards narrowing the research gap in large-scale multi-process erosion assessments.It provides, for the first time, a global representation of the spatial extent,types,and relative magnitude of five major soil erosion processes.In spite of some degree of uncertainty,which will be discussed later, the results of this study shed new light on (i) the complex global geography of soil erosion, with an aim to go beyond previous assessments limited to water erosion processes,(ii)the locations where individual processes may have a strong impact on land degradation,and(iii)the locations where the co-occurrence of different processes may occur.
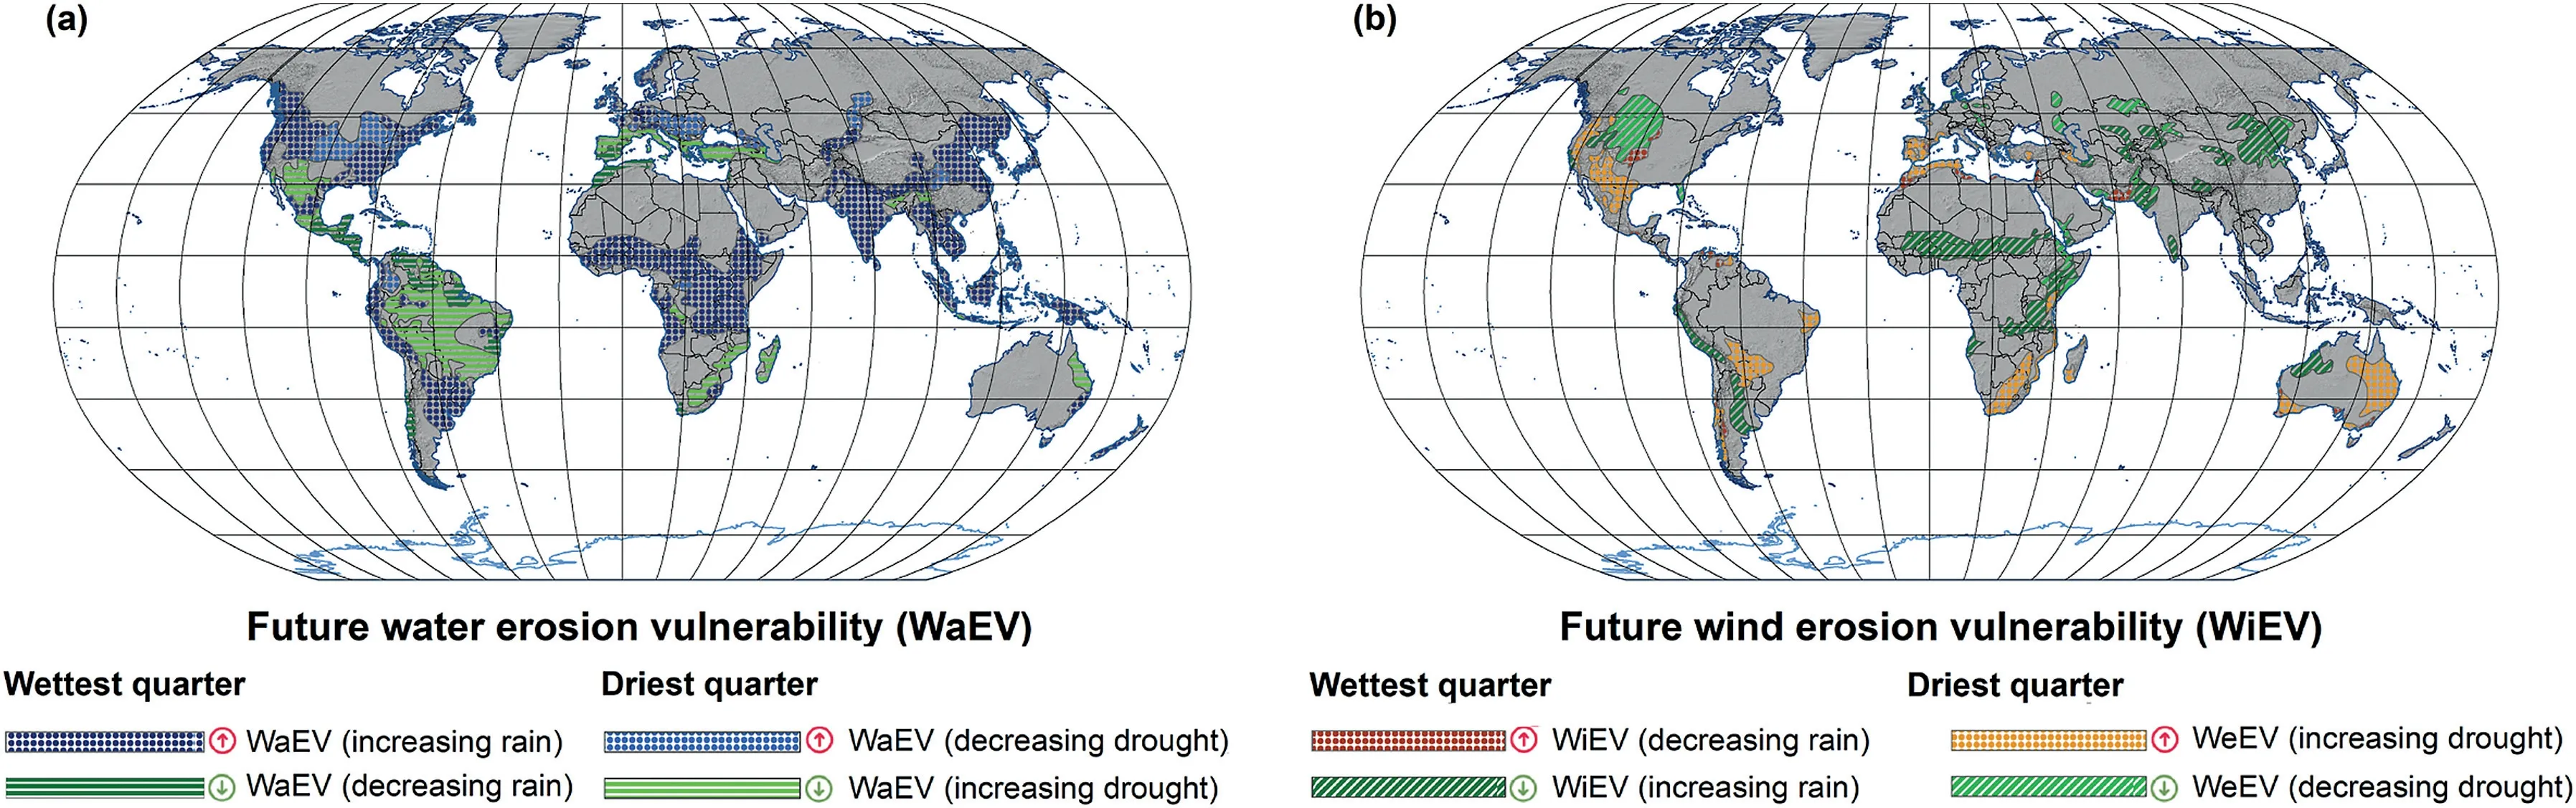
Fig.5.Global changes in future water and wind erosion vulnerability.Changes in future(a)water and (b) wind erosion vulnerability are assessed based on the comparison of the long-term rainfall dynamics between the 1970-2000 period and the 2061-2080 period, according to the ‘middle-of-the-road’ scenario SSP245 (WorldClim, Fick and Hijmans(2017)).The analysis assumes that soil erosion by water will be reinforced in areas that persistently receive more precipitation, whereas areas getting drier will be more vulnerable to wind erosion.Dotted areas indicate estimated future increases in water or wind erosion.By contrast,the striped areas highlight estimated future decreases in water or wind erosion.Grey areas indicate areas with changes below the considered threshold(i.e.,±5%).The grey topographic relief(hill shade)was derived from the NASA Shuttle Radar Topography Mission version 3.0 (Robinson et al., 2014).

Fig.6.Comparison of the modelled land susceptibility to water(a),gully(b),and wind erosion (c), with 411 field measurements sites (dots) described in the literature as being affected by erosion.
When dealing with complex phenomena such as soil erosion processes(Nearing,2013;Poesen,2018),especially at a global scale(Van Oost et al.,2007),the accuracy of the modelled output remains an important concern.As observed by Auerswald et al.(2003), a validation sensu strictu of prediction models like USLE at regional or larger scales is not feasible due to the lack of long-term field-scale measurements,particularly with global consistency.In fact,several modelling applications have been reported in the literature without any validation attempt,as discussed extensively in a recent review study (Borrelli et al., 2021).As previously done in pan-European(Borrelli et al., 2017) and global scale studies (Borrelli, Robinson,et al., 2017), here we propose an evaluation of the models’ performance despite the low data availability.More precisely,we carried out a cross-check of the results to evaluate whether the areas predicted as susceptible to erosion coincide with the observations sites used as a reference.The results indicate that for most of the reference sites(79%),a moderate to high soil erosion susceptibility was predicted.The fair agreement between our estimates and the observations provided by independent studies gives us confidence that the estimates achieved through the global models can identify areas found to be experiencing erosion processes.
Still, it is necessary to note two important limitations to our evaluation and methodological approaches.First, the number of sites used for the cross-check is still rather exiguous and spatially limited to Europe.Future evaluation attempts resting on larger global observations datasets are desirable.These will likely be possible in the near future, thanks to the UN-Global Soil Erosion mapping project (UN-GSERmap), which is currently carrying out field observations in multiple countries and will be completed by 2025.Second, the statistical approach employed to evaluate land susceptibility to erosion processes was based on a quantile classification.While this method is adequate to represent the distribution of predicted values in a consistent way, it is important to mention that the thresholds used to subdivide the predicted soil erosion values are scale dependent.The definition of thresholds,and the subsequent erosion susceptibility classification, are thus influenced by the presence of regions subject to high erosion estimates.For instance, in the European Union the mean soil loss rate by sheet and rill erosion is estimated at 2.46 Mg ha-1yr-1(Panagos et al.,2015), which exceeds by 1.6 the average soil formation rates of the region(1.4 Mg ha-1yr-1,Verheijen et al.(2009)).This mean soil loss rate, when compared to the national rate of soil loss by water erosion estimated by the UN for Malawi (29 Mg ha-1yr-1,Omuto & Vargas (2019), clearly shows the spatial relativeness of soil erosion.As a result, when defining a set of thresholds considering both the European Union and Malawi, the resulting classes would be a statistical compromise between two regions with different erosion patterns.Likewise, the soil erosion susceptibility classes that we propose here represent a best fit-type classification considering the global complexity of landscapes and climate drives,but are not necessarily the most appropriate classification for local purposes.While this approach is statistically meaningful and needed to provide worldwide consistency in this study,it may not be optimal to properly suit all needs and aspirations for soil loss mitigation.For instance, recent studies in Europe consider 2 Mg ha-1yr-1as the long-term non-tolerable soil erosion threshold (Di Stefano et al., 2023), while in Switzerland, the Soil Pollution Ordinance (SoilPO, (FOEN, 2017), sets, by law, the tolerable level of soil erosion to 2 or 4 Mg ha-1yr-1, depending on soil depth (<70 or >70 cm) of the location.Such thresholds would clearly be an unreachable target for Malawi,where the magnitude of soil loss by water erosion is substantially greater.In this regard,Borrelli, Robinson, et al.(2017) suggested that the matter of the relativeness of the soil erosion can still be addressed with the quintile classification method, by defining thresholds at specific scale of interest, i.e., national, subnational, or smaller level.An example of this approach is shown in Fig.7, clearly illustrates the contrast in the distribution of the three predicted susceptibility classes(3-5)when thresholds are defined at(a)global and(b)pan-European scales.

Fig.7.Comparison of the predicted land susceptibility(classes 3-5)to wind erosion in Europe classified according to the(a)global and(b)European index ranges.The dots indicate locations described in the literature as being affected by wind erosion.
Further, it is important to stress the hypothetical nature of the simulated scenarios.Under the intrinsic scenario, we considered the total land suitable for farming.Under the actual scenario, we only considered the land classified by the ESA's programs as cropland.This modelling assumption allowed us to consistently map the soil erosion susceptibility across the world.However, it also implies that our estimates do not attempt to replicate the different existing farming systems and crop types.The provided estimates thus represent the potential rather than the actual soil erosion conditions, which limits our capacity to evaluate the modelling results.Thus, while on the one hand the insights obtained through modelling evaluation suggest that the simplified approach is well suited to detect the areas susceptible to the observed erosion for the proposed scale and objective.On the other hand, assuming a consistent cropping (i.e., common wheat), we need to keep in mind that we locally underestimate erosion where crops more sensitive to erosion are planted.This because as demonstrated by the relationship between plant silhouette/cover area and soil loss ratio,wheat is one of the crop types less sensitive to both water and wind erosion (Wischmeier and Smith, 1978).Accordingly, in addition to the quantile classification aspect discussed earlier, another source of uncertainty, and possible underperforming in the evaluation process, resides in the hypothetical nature of the adopted cropping scenario.This condition can lead to a possible underestimation in our estimates.Obviously, such condition does not apply to gully erosion or SLCH modelling,the latter of which considers root crops (sugar beets and potatoes) national statistics rather than wheat.
To further support the validity of our modelling results, we conducted a comparative analysis between our wind and water erosion results and the information reported by the US National Resources Inventory (NRI); a statistical survey of land use and natural resource conditions and trends on US non-Federal lands.We compared cropland areas predicted by our models to have moderate to very high susceptibility to wind and water erosion(classes 3-5)against all NRI sites with soil loss rates exceeding the tolerable threshold for the reference year 1982 (preferred to more recent assessments due to lower soil conservation,e.g., no-till and reduced tillage).The results illustrated in Fig.8 confirm the good agreement between the spatial patterns of our assessments and those of an independent assessment.In numerical terms, we estimated a spatial agreement (based on overlapping area) between the two approaches equal to 86% and 54% for the wind and water erosion sites, respectively.While we are unable to explain why wind erosion performs substantially better than water erosion,we can speculate at this stage that, besides the systematic underestimation of our predictions stemming from the use of an all-wheat scenario as discussed above, our global model application may have used higher class thresholds than the ones used by the NRI.Nonetheless,the good correspondence of our results with regional estimates in US and in EU supports our hypothesis that soil erosion processes can be fairly assessed at global scale.At the very least,our capacity to estimate global erosion patterns is in line with what we currently achieve when assessing them at regional and national scales.Still, it is important to stress, once more, that this study constitutes a first attempt in the direction of multi-process assessment at global scale and substantial progress is needed in both further development of the modelling schemes and the evaluation of their results.
The authors recognize that modelling based on data-driven assumptions has its limitations, and that there is a need for field monitoring.Here, we contend that the provided top-down set of predictions may serve as a basis for developing more effective stratified monitoring network and informing targeted mitigation strategies under the UN-Global Soil Erosion mapping project(UNGSERmap) (FAO, 2020).In line with suggestions raised during the Global Symposium on Soil Erosion(GSER19)at FAO Headquarters in Rome(FAO,2020),these five globally consistent products can allow spatial comparison between different locations, statistical analysis and support adjunct global scale research dealing with the soilland-water nexus.As reported earlier, in a recent meeting of the GSP (FAO, 2022), the coordinator of the UN-GSERmapcommunicated that the global mapping will no longer include top-down modelling, as originally planned for the Phase-1, but will instead result from mosaicking operations of national-scale studies carried out by national experts, thus starting directly from Phase-2.In doing so, the GSP will follow the same procedure previously undertaken to develop the Global Soil Organic Carbon Map (GSOCmap) (FAO, 2018).While such an approach will significantly contribute to our understanding of multiple soil erosion processes in several countries across the globe, it may lack the ability to provide spatially consistent global information (Guevara et al.,2018).That said, the development of national scale products coordinated by FAO and GSP Secretariat may lead to semi-standardized methodology which will allow the incorporation of best available national data unique to each country or region.As such, the result of our study and the ongoing work of the UN-GSERmapcan be considered complementary, moving towards a more comprehensive and detailed understanding on erosion processes on a global scale.In this direction,a substantial leap in quality will be obtained when the so-called Phase-3 of the UN-GSERmapproject will be completed, aiming at “national scale products based on field or onscreen visual interpretation of soil erosion signs achieved through monitoring programs” (FAO, 2020).New knowledge based on field and on-screen visual interpretation of soil erosion features will increase both (i) our capacity to evaluate the performances of models and to(ii)map more accurately the global geography of soil erosion.

Fig.8.Graphical results of the comparative analysis between (a) the US National Resources Inventory (NRI) and (b) our results wind and water erosion (classes moderate and higher, 3-5).
A further aspect concerning the Phase-3 of the UN-GSERmapproject is the possibility to carry out field observation/measurements of other human-related factors enhancing the erosion processes,such as grazing and the use of heavy vehicles/machinery.It is a highly relevant prospect, given that regions with high water erosion (Fig.2a and 3a), such as the tropical regions of South America,Asia,as well as Central America,India,and China,are also considered as places for domestic animals(Gilbert et al.,2018).This helps to better understand the role of these factors in the different erosion processes and eventually parametrize them in national or global scale assessments.Keller and Or,2022 demonstrated that the soil stresses induced by modern vehicles are higher than the critical mechanical thresholds of many arable soils,which leads to chronic soil compaction in the root zones below the tillage depths.Similarly,the effect of the soil compaction in arable and grasslands can also be increased due to the cattle's grazing (Lai & Kumar, 2020).This, in turn, has an adverse effect on the functioning of the soil,especially in soil hydraulic properties, leading to more runoff and ultimately increased soil erosion(Nawaz et al.,2013).A preliminary analysis looking for insights into possible effects of changes in soil pore geometry due to cattle's grazing compaction suggests that soil saturated hydraulic conductivity (Ksat) tends to decrease in grassland with an increasing number of cattle (Supplementary Information).However,field tests are needed to confirm this trend and the Phase-3 of the UN-GSERmapproject may represent a great opportunity to further investigate the phenomenon and to shed new light on the consequences of human-induced soil compaction to soil erosion processes.
A further element of novelty in this study lies in the provided future projections for the year 2070.Recent global-scale climate projections suggest that we are moving towards a more vigorous hydrological cycle(Fick&Hijmans,2017),which may substantially affect future water-erosion dynamics(Panagos et al.,2022a).Given that most soil erosion processes, and especially water and wind erosion, are driven by weather conditions, we believe it is highly relevant to compare the spatial patterns of our present-day multiprocess soil erosion estimates with those under projected changes in weather.Following the approach applied over the European continent by Borrelli et al.(2022a), here we assume that soil erosion by water will be reinforced in areas that get persistently wetter, while areas getting drier may become more vulnerable to wind erosion.The resulting projections,illustrated in Fig.5,provide spatially explicit information concerning the areas that may be affected by wind and water erosion processes exacerbated by climate change.Despite some degree of uncertainty, these projections provide the basis for both: (i) designing a more targeted and efficient stratified monitoring scheme and(ii)targeting policy for coping and mitigation actions.The projections could also provide further support in the field activities of UN-GSERmapproject,as monitoring design is most effective when a stratified random approach can be used.Understanding and identifying areas that are more susceptible to specific erosion processes can help in the delineation of strata for such an approach.In light of our findings,we also suggest that monitoring programs should be adopted not only to address water erosion, but also to develop strategies to mitigate tillage, wind and gully erosion.
5.An outlook for concurrent erosion processes assessments

Fig.9.Monthly (No.) co-occurrence of above-average wind (wind climatic erosivity,CE) and water (rainfall erosivity, R) erosion drivers.
The applied globally harmonized approaches come with the future advantage of gaining insights into the temporal aspects of erosion,both in the current and future climatic scenarios(Panagos et al., 2022).For example, we carried out further geospatial operations to evaluate the possible temporal perspective of compound wind and water erosion processes.Our aim here is to observe if these two erosion processes are likely to spatially co-occur at a monthly time scale, potentially exacerbating the overall erosion impacts.To do so,we simply adapted the drivers of wind(monthly averages of wind climatic erosivity, CE)and water erosion(rainfall erosivity, R) models as proxies for these processes.Fig.9 shows what emerged from this analysis.We observed that several regions around the globe may be interested by co-occurrence of aboveaverage water and wind erosion drivers in the same month.Geographically, areas showing co-occurrence of above-average wind and water drivers appear to be primarily located in coastal regions and involving co-occurrence time periods around 4-6 months.Furthermore,there are some regions where co-occurrence of above-average wind and water erosion can be expected more frequently(>6 months),such as some islands and coastal regions in South America and Africa.By contrast, from our analysis emerges that in most of continental areas water and wind erosion may not be expected to occur at the same time.A condition that seems to be more pronounced in large part of Asia and Europe, while some exceptions to this trend can be found in central USA,parts of Africa,Australia and South America.Based on the insights achieved from this preliminary analysis, we believe that it is worth to address future research in the observation and co-occurrence of soil erosion processes at monthly scale.A better understanding of the monthly dynamic has the potential to increase the design of effective mitigation strategies.
6.Data availability
All data supporting the findings of this study are available within the article text or are freely available at the European Soil Data Centre (ESDAC, https://esdac.jrc.ec.europa.eu/), the institutional soil data repository of the European Commission Joint Research Centre(Panagos et al.,2022b).This study also contributes to the objectives of the EU Soil Observatory working group on soil erosion to give better insights on global soil erosion assessments.
7.Conclusions
In this study,we use a multi-model approach to present a novel assessment of the spatial distribution of individual and combined(additive) threat to soil due to five erosion processes across the world's areas suitable for farming.The modelling scheme allows for the spatial identification, at a 1 km grid cell resolution, of areas in which single erosion processes are dominant and areas in which a combined effect of multiple processes are operating and interacting.The fair agreement between our predictions and regional assessments of soil erosion suggests our approach is suitable for global estimates of soil erosion susceptibility and can act as an early warning for policymakers to implement efficient monitoring to aid the direction and development of mitigation strategies on the ground.Yet we emphasize that models based on data-driven assumptions have limitations, and that there is a need for increased field monitoring and resource allocation for the development of comprehensive process-based models, including thorough validation procedures against independent field observations.In the context of limited data availability and unsuitable process-based models for global scale applications, however, simple, physically plausible empirical methods for predicting soil erosion such as the ones we report in this study can provide reasonably accurate estimates for most practical purposes.
Declaration of competing interest
The authors declare that they have no known competing financial interests or personal
Relationships that could have appeared to influence the work reported in this article.
Acknowledgements
P.B.was funded by the Horizon Europe project AI4SoilHealth(Grant No.101086179).J.E.Y was funded by the EcoSSSoil Project,Korea Environmental Industry & Technology Institute (KEITI)(Grant No.2019002820004).We thank all GloSEM platform data providers, i.e., EC-JRC, EC-ESDAC, ESA, NASA, OpenGeoHub, ISRIC,FAOSTAT, AQUASTAT, LUH2, WorldClim, and TerraClimate.
Appendix A.Supplementary data
Supplementary data to this article can be found online at https://doi.org/10.1016/j.iswcr.2023.07.008.
 International Soil and Water Conservation Research2023年4期
- International Soil and Water Conservation Research的其它文章
- Atlas of precipitation extremes for South America and Africa based on depth-duration-frequency relationships in a stochastic weather generator dataset
- Calibration,validation,and evaluation of the Water Erosion Prediction Project (WEPP) model for hillslopes with natural runoff plot data
- Saturation-excess overland flow in the European loess belt: An underestimated process?
- Streamflow prediction in ungauged catchments by using the Grunsky method
- Comparison and quantitative assessment of two regional soil erosion survey approaches
- Long-term trends of precipitation and erosivity over Northeast China during 1961-2020